

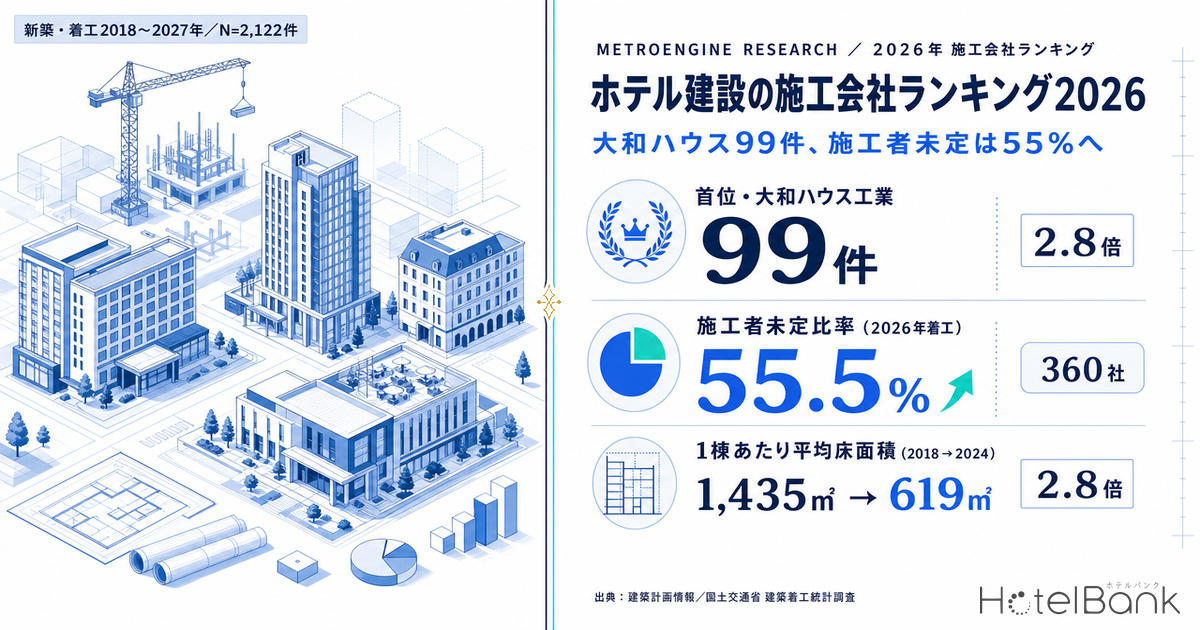
Coverage of hotel supply usually gets as far as “how many rooms are going up where.” What almost never gets discussed is who is building them — the identity of the contractor. From a developer’s point of view, whether or not you can secure a builder is the difference between a project happening and not happening, and when the roster of construction firms changes, the shape of the hotels that get built changes with it. For this analysis we extracted 2,122 new-build hotel projects from publicly posted construction plan notices, consolidated the contractor names, and tallied who is building hotels of what size, and where.
Metric Definitions Used in This Article
- Scope: Publicly posted construction plan notices whose primary use is lodging, with work type “new build” and a construction start year between 2018 and 2027. Duplicate records sharing the same address, total floor area, number of floors and year were removed, leaving 2,122 projects.
- Contractor: The construction company listed on the plan notice. Corporate-form markers (Kabushiki Kaisha, (K.K.) and the like) and branch/regional-office names were stripped before consolidating names. Joint ventures and multi-company listings are tallied separately.
- “Undecided”: Projects whose contractor field was blank or marked undecided at the time the plan was posted. Contractors appointed later are not reflected in this data.
- Total floor area: The gross floor area (sqm) stated on the plan notice. Because the share of notices that state a room count swings widely by year, total floor area is used as the size metric.
- Data sources: MetroEngines Research & Consulting (aggregation of construction plan notices); Ministry of Land, Infrastructure, Transport and Tourism (MLIT), Statistical Survey on Building Construction Starts
- — Daiwa House Industry, 99 projects, tops the consolidated ranking — 2.8x the 35 projects of second-placed Takenaka Corporation. Exactly one firm stands apart (new builds, construction start 2018-2027; 1,218 projects with an identified contractor).
- — The top 20 firms account for 42.6% — concentration is low. Of 360 firms, 202 (56.1%) built exactly one hotel over the period, pointing to a market with a very wide base.
- — Contractor “undecided” on 55.5% of projects starting construction in 2026. That is up 30.3 points from 25.2% in 2018, and even after subtracting what earlier plan disclosure can explain, 12-22 points remain unexplained.
- — Median total floor area of 978 sqm for 2026 construction starts — down to roughly a quarter of the 3,713 sqm recorded in 2018, with only 5.1% exceeding 10,000 sqm. The firms doing the building have shifted toward residential-sector builders.
- — Construction cost per sqm is up 78% (from ¥332,000 to ¥591,000 per sqm between 2018 and 2024). The floor area buildable on the same construction budget shrinks to 56%, which is the arithmetic behind the shift to smaller boxes.
Consolidating Names Reshuffles the Ranking – Track Records Are Scattered Across Branch Offices
The first thing worth establishing is the pre-processing. Contractor names on plan notices are written inconsistently even for the same company – “Kabushiki Kaisha Takenaka Corporation,” “(K.K.) Takenaka Corporation,” “Kabushiki Kaisha Takenaka Corporation Tokyo Head Office” and so on. Across the 1,218 single-contractor projects, company names appeared in 565 distinct spellings, but stripping corporate-form markers and branch/regional-office names consolidated them into 360 firms. In other words, roughly 36% of the spellings were duplicates of the same company.
Whether or not you do this changes the ranking substantially. Before consolidation, the most common single spelling was “Daiwa House Industry Co., Ltd.” at 35 projects – but the company’s work was split across 29 different spellings including its Tokyo head office and Nagoya and Fukuoka regional offices, and bundling them gives 99. Takenaka Corporation was split 12 ways, its largest single spelling accounting for 17 projects versus 35 after consolidation. Taisei Corporation goes from 10 to 28, Ichiken from 8 to 25. Without consolidation, the large contractors that sell through branch networks look smaller than they are, and firms registered under a single spelling look relatively larger.
Source: MetroEngines Research & Consulting, compiled from publicly posted construction plan notices (N=1,218 projects)
The Top 20 Contractors – Daiwa House at 99 Projects, and the Gap Below It
The table below shows the top 20 firms after consolidation. Daiwa House Industry leads with 99 projects, 2.8x second-placed Takenaka Corporation (35). Only one firm stands apart; below it the field spreads fairly evenly across a 35-to-14 band.
| # | Contractor (consolidated) | Projects | Median floor area (sqm) | Median floors above ground | Prefectures active in | Share in Tokyo |
|---|---|---|---|---|---|---|
| 1 | Daiwa House Industry (大和ハウス工業) | 99 | 4,156 | 12.0 | 26 | 33% |
| 2 | Takenaka Corporation (竹中工務店) | 35 | 20,200 | 18.0 | 9 | 29% |
| 3 | Daito Trust Construction (大東建託) | 34 | 1,092 | 10.0 | 2 | 97% |
| 4 | Shin Nihon Construction (新Nihon Kensetsu (日本建設)) | 33 | 2,912 | 14.0 | 3 | 79% |
| 5 | Taisei Corporation (大成建設) | 28 | 12,550 | 12.0 | 10 | 39% |
| 6 | Shimizu Corporation (清水建設) | 27 | 13,512 | 13.5 | 7 | 56% |
| 7 | Ichiken (イチケン) | 25 | 3,166 | 12.0 | 6 | 52% |
| 8 | Seiwa Corporation (生和コーポレーション) | 23 | 1,146 | 10.0 | 3 | 91% |
| 9 | Kajima Corporation (鹿島建設) | 20 | 11,968 | 16.0 | 7 | 30% |
| 10 | Obayashi Corporation (大林組) | 20 | 21,340 | 15.5 | 6 | 35% |
| 11 | Asahi Kasei Homes (旭化成ホームズ) | 20 | 737 | 6.0 | 1 | 100% |
| 12 | Kintaro Home (金太郎ホーム) | 19 | 650 | 10.0 | 1 | 100% |
| 13 | Fujita (フジタ) | 18 | 4,630 | 13.0 | 6 | 50% |
| 14 | Nakano Fudo Construction (ナカノフドー建設) | 18 | 4,212 | 10.5 | 7 | 56% |
| 15 | Toda Corporation (戸田建設) | 18 | 9,881 | 12.0 | 7 | 39% |
| 16 | Toyoko Inn Denken (東横イン電建) | 18 | 4,050 | 14.0 | 8 | 28% |
| 17 | Nihon Kensetsu (日本建設) | 17 | 2,043 | 10.0 | 4 | 41% |
| 18 | Kumagai Gumi (熊谷組) | 17 | 9,719 | 14.0 | 5 | 41% |
| 19 | Panasonic Homes (パナソニックホームズ) | 16 | 502 | 5.0 | 2 | 94% |
| 20 | Goda Corporation (合田工務店) | 14 | 2,900 | 12.0 | 3 | 86% |
Source: MetroEngines Research & Consulting, compiled from publicly posted construction plan notices (new builds, construction start 2018-2027; of N=2,122 projects after de-duplication, the 1,218 with an identifiable contractor)
Concentration is by no means high. The top 10 firms together account for 28.2% of the 1,218 projects, and even the top 20 reach only 42.6%. Meanwhile, of the 360 firms, 202 (56.1%) built just one hotel over the period. New-build hotel construction is not a market cornered by a handful of majors; it rests on a long tail that includes local builders. For a developer that means the choice set is wide – but whether a given firm has actually built a hotel before is something you have to verify project by project.
Four Groups by Size and Geographic Reach – National General Contractors vs. Tokyo-Only Builders
Project counts alone hide enormous differences: two firms with “20 projects” can be doing completely different work. Plotting the top 20 by median floor area per project (x-axis) against the number of prefectures they actually worked in (y-axis) splits the market cleanly.
Source: MetroEngines Research & Consulting, compiled from publicly posted construction plan notices (top 20 firms; bubble size = number of projects)
The upper right is where the major general contractors sit. Obayashi Corporation has a median floor area of 21,340 sqm, Takenaka Corporation 20,200 sqm, Shimizu Corporation 13,512 sqm, Taisei Corporation 12,550 sqm and Kajima Corporation 11,968 sqm. Their median building height is also high at 12-18 floors, and their work centres on large mixed-use projects.
The lower left, by contrast, is a group with median floor areas around 1,000 sqm operating in only one to three prefectures: Panasonic Homes at 502 sqm, Kintaro Home 650 sqm, Asahi Kasei Homes 737 sqm, Daito Trust Construction 1,092 sqm and Seiwa Corporation 1,146 sqm. All 20 of Asahi Kasei Homes’ projects and all 19 of Kintaro Home’s are in Tokyo; the figure is 97% for Daito Trust Construction and 94% for Panasonic Homes. By size these are one-twentieth to one-fortieth of a major contractor’s project. Two completely different kinds of building sit inside the same phrase, “new hotel construction.”
Daiwa House Industry alone occupies an exceptional position: a mid-sized median of 4,156 sqm, yet spread across 26 prefectures with 99 projects. It is the only firm straddling both zones. Some regionally rooted firms also show up: Goda Corporation (Kagawa) has 12 of its 14 projects in Tokyo, while Toyoko Inn Denken is spread across eight prefectures with Chiba as its largest. Head-office location and construction location do not necessarily line up.
Contractor “Undecided” on 40% of Projects – From 25% in 2018 to 55% in 2026
More telling than the ranking is the share of projects with no contractor assigned. Of the 2,122 projects, 852 (40.2%) had “undecided” in the contractor field at the time the plan was posted. And that share has risen consistently with each successive construction-start year.
This chart aggregates publicly posted construction plan notices, which are issued on a rolling basis starting several months before construction begins. Project counts for the most recent and future years (2026 and 2027) are therefore expected to grow as further notices appear, and should be read as a lower bound on the confirmed pipeline as of today.
Source: MetroEngines Research & Consulting, compiled from publicly posted construction plan notices (N=2,122 projects after de-duplication)
Among projects starting construction in 2018, 25.2% were undecided (130 of 516). That rose to 35.0% in 2019, 49.0% in 2022, 53.1% in 2025 and 55.5% in 2026 (171 of 308). The 2027 start year reads 66.7%, but with a base of only 27 projects it is indicative only.
One observational caveat is needed. Because plans are posted before construction starts, the earlier the posting, the more likely the contractor field is still blank. And the median gap between posting date and construction start did lengthen by about a month, from 96 days in 2018 (N=279) to 126 days in 2026 (N=134). But the undecided share rose by 30 points, well beyond what a 30-day shift can explain. The natural reading is that longer build schedules and difficulty in selecting contractors are compounding each other. For how much the construction-to-completion period has actually stretched, see Hotel Build Times: 2.80-Year Median Across 67 Planned Projects, which measures it project by project. MLIT’s FY2024 White Paper on Land, Infrastructure, Transport and Tourism likewise flags that workers aged 55 and over make up about a third of the construction workforce, raising the loss of building capacity as skilled tradespeople retire en masse as a central issue.
Scenario analysis: how much can disclosure timing explain? (three cases)
| Case (assumption) | Implied undecided rate | Explained by disclosure timing | Residual (selection factors) |
|---|---|---|---|
| Conservative: longer lead time has no effect on the undecided rate | 25.2% | 0.0pt | 30.3pt |
| Central: undecided rate scales with lead time (elasticity 1.0) | 33.1% | 7.9pt | 22.4pt |
| Aggressive: elasticity 2.0 (double weight on the lead-time effect) | 43.4% | 18.2pt | 12.1pt |
Assumptions: starting from the 25.2% undecided rate of the 2018 construction-start cohort (N=516), the 1.31x increase in median posting-to-start days – 96 days in 2018 (N=279) to 126 days in 2026 (N=134) – is applied at elasticities of 0, 1.0 and 2.0. The observed figure is 55.5% for 2026 starts (N=308). Calculation by the HotelBank Editorial Team
Under any of these assumptions, 12-22 points remain unexplained by longer lead times alone. The rise in the undecided share cannot be written off as an observational artefact; the reasonable conclusion is that the number of projects being posted without a contractor secured has genuinely increased.
2025-26 Plans Have Shifted to Small Boxes – Only 5% Exceed 10,000 sqm
When the builders change, so does what gets built. The chart below plots, for projects with an identified contractor, the median floor area per project and the share of large projects of 10,000 sqm or more, by construction-start year.
Source: MetroEngines Research & Consulting, compiled from publicly posted construction plan notices (projects with an identified contractor; 2027 excluded from the chart as N=9)
In 2018 the median floor area was 3,713 sqm and 13.7% of projects exceeded 10,000 sqm. During the pandemic years of 2021-23 project counts collapsed while individual projects grew larger: the median hit 7,280 sqm (2021) and the 10,000-sqm-plus share climbed to 32-33%. What survived the thinning-out were the large projects with the balance sheets to carry them. Consistent with that, the share taken by the five major general contractors – Kajima, Obayashi, Shimizu, Taisei and Takenaka – rose to 28-39% in this period.
2025-26 looks entirely different. Project counts recovered to 111 and 136, but median floor area shrank to 990 sqm and 978 sqm – close to a quarter of the 2018 level – and the 10,000-sqm-plus share fell to 4.5% and 5.1%. The five major general contractors hold just 2.7% and 3.7%.
| Construction-start cohort | Contractor identified | Distinct firms | Median floor area | Leading contractors (projects) |
|---|---|---|---|---|
| 2018-2019 | 728 | 248 | 3,175㎡ | Daiwa House Industry 59 / Shimizu 21 / Shin Nihon Construction 21 / Takenaka 20 / Daito Trust Construction 20 / Ichiken 18 |
| 2020-2023 | 196 | 85 | 5,205㎡ | Daiwa House Industry 21 / Taisei 15 / Takenaka 10 / Shin Nihon Construction 9 / Obayashi 8 / Kajima 7 |
| 2024-2027 | 294 | 133 | 1,112㎡ | Seiwa Corporation 23 / Asahi Kasei Homes 19 / Daiwa House Industry 19 / Kintaro Home 12 / Daito Trust Construction 9 / Takamatsu Corporation 9 |
Source: MetroEngines Research & Consulting, compiled from publicly posted construction plan notices
The roster has turned over. In 2018-19 the leaders were Daiwa House Industry, Shimizu, Shin Nihon Construction and Takenaka. In 2024-27 they are Seiwa Corporation with 23 projects, Asahi Kasei Homes with 19, Daiwa House Industry with 19 and Kintaro Home with 12. Residential builders whose core business has been rental apartments and detached housing have moved to the front as the builders of small urban lodging facilities.
This is not simply a case of large projects hiding in the undecided bucket. For 2024-27 starts, the median floor area of undecided projects is 1,470 sqm (N=349), not far from the 1,112 sqm of projects with a named contractor (N=293). Including the undecided ones, recent plans themselves are getting smaller. As an aside, projects far above 10,000 sqm tend to go to joint ventures: the median floor area of 2024-27 joint-venture projects (N=5) was 91,820 sqm. Very large projects still exist, but in count terms they are exceptional.
National Statistics Show the Same Shape – Record Building Counts, Floor Area per Building at 43% of 2018
This downsizing is not confined to the plan notices we aggregate. The same shape appears in MLIT’s construction starts statistics for new lodging-use buildings.
Source: MetroEngines Research & Consulting, compiled from MLIT, Statistical Survey on Building Construction Starts
In 2024, 2,836 lodging-use buildings started construction – the highest count since 2015, above both the pre-pandemic peak of 2019 (2,300) and the subsequent 2022 high (2,374). Yet total floor area started came to 1.756 million sqm, only 58% of the 3.039 million sqm recorded in 2018. Average floor area per building fell from 1,435 sqm in 2018 to 406 sqm in 2023, and even in 2024 stood at 619 sqm, or 43% of 2018. More buildings, each one smaller. The trend visible in our plan-notice data and the trend in official statistics agree.
Cost is likely one reason. Dividing planned construction cost by floor area in the same statistics, the unit cost for lodging-use buildings went from ¥332,000 per sqm in 2018 (about ¥1.10 million per tsubo) to ¥591,000 per sqm in 2024 (about ¥1.96 million per tsubo) – a 78% increase. For how far that increase eats into the 2027-2029 opening pipeline, see Construction +41% and Labor Crunch Erase Japan’s Supply, which breaks it down by region.
Source: MetroEngines Research & Consulting, compiled from MLIT, Statistical Survey on Building Construction Starts
On the same budget you can now build only a little over half the floor area you could in 2018. To hold the total down, you either cut floor area or make the project itself smaller. The drop in average floor area per building from the 1,300-1,400 sqm range in 2016-18 to the 400-600 sqm range since 2022 is consistent with that arithmetic.
Scenario analysis: floor area buildable on a given construction budget (sqm)
| Cost per sqm (¥10k/sqm) | ¥500m budget | ¥1.0bn budget | ¥2.0bn budget | ¥3.0bn budget |
|---|---|---|---|---|
| 33.2 (2018) | 1,506 | 3,012 | 6,024 | 9,036 |
| 45.0 | 1,111 | 2,222 | 4,444 | 6,667 |
| 59.1 (2024) | 846 | 1,692 | 3,384 | 5,076 |
| 70.0 | 714 | 1,429 | 2,857 | 4,286 |
Assumptions: floor area = construction budget / cost per sqm. Unit costs are estimates derived by dividing planned construction cost by floor area started for lodging-use buildings in MLIT’s Statistical Survey on Building Construction Starts (¥332,000/sqm in 2018, ¥591,000/sqm in 2024). Land, design and supervision fees, and FF&E are excluded. Calculation by the HotelBank Editorial Team
A standard 2018 plan (median floor area 3,713 sqm) implied roughly ¥1.23 billion in construction cost at the unit price of the day; the same floor area at 2024 prices comes to about ¥2.19 billion. The 2025-26 standard of 978 sqm works out to roughly ¥580 million at 2024 prices. By cutting floor area to a quarter, developers keep construction cost below half of the earlier level. With unit costs 1.78x their 2018 level, a flat budget buys only 56% of the floor area – the shift to smaller buildings looks less like a preference than an arithmetic consequence.
How to Read This From the Development Side
Converting floor area into room counts makes recent plans more concrete. Across the 761 projects that state both floor area and room count, the median floor area per room is 30.7 sqm. But the ratio varies sharply by size band: for projects under 1,500 sqm (N=87) it is 16.3 sqm per room, with a median of 59 rooms. Sixteen square metres per room including common areas describes a small lodging facility built out of compact guestrooms.
The standard hotel being planned in 2025-26, in other words, is a small urban box: around 1,000 sqm of floor area, roughly 10 storeys, and a few dozen rooms. The five top-20 firms with a Tokyo share above 90% – Asahi Kasei Homes at 100%, Kintaro Home 100%, Daito Trust Construction 97%, Panasonic Homes 94% and Seiwa Corporation 91% – rank high in the most recent cohort precisely because this format suits Tokyo’s narrow sites. Indeed, Tokyo accounts for 706 (58.0%) of the 1,218 projects with an identified contractor. For which segments the hotels actually opening in Tokyo skew toward, see Tokyo 2026: 68 New Hotels and 2,055 Rooms, Broken Down by Segment.
Three practical points follow. First, securing a contractor is a precondition for breaking ground, not an outcome of it. In an environment where more than half of projects have no contractor at the time of posting, the project schedule needs to budget explicit time for contractor selection. Second, hotel-building experience varies enormously between firms: 202 of 360 built a single hotel over the period, and firms with multiple projects are few. Third, the firms to approach differ by size band. The companies actually winning 10,000-sqm-plus mixed-use developments and those winning 1,000-sqm small boxes barely overlap. The two clusters in the upper right and lower left of the scatter chart above are both “companies that build hotels,” but they operate in different markets.
Rising construction costs and a stretched contracting base both work to hold down new supply. For an existing hotel there is an upside to that: the pace at which competitors are added slows. For anyone pursuing development, the direction indicated by the last two years of plan data is that designing a project small enough to pencil out is becoming the mainstream approach.
Methodology and Sources
The contractor data in this article was compiled by MetroEngines Research & Consulting by extracting projects whose primary use is lodging from publicly posted construction plan notices. The scope is work type “new build” with a construction start year of 2018-2027; after removing duplicate records sharing the same address, floor area, number of floors and start year, the base population is 2,122 projects.
Contractor names were consolidated by stripping corporate-form markers (Kabushiki Kaisha, (K.K.), Yugen Kaisha and so on), normalising full-width and half-width characters, and removing branch, regional-office and sales-office names. “XX Construction Tokyo Head Office” and “XX Construction Osaka Branch” are both merged into “XX Construction.” The 52 joint-venture and multi-company entries are excluded from the single-contractor ranking and handled separately.
This data aggregates publicly posted construction plan notices and does not cover every new-build hotel project. For the most recent and future years in particular, because notices are issued on a rolling basis from several months before construction begins, counts are expected to rise as further notices appear and should be read as a lower bound on the confirmed pipeline as of today. “Undecided” reflects the status at the time of posting; contractors appointed afterwards are not reflected. Because the share of notices stating a room count swings widely – about 57% in 2018-19 versus a few percent from 2025 – total floor area is used for size comparisons.
National construction start statistics are taken from MLIT’s Statistical Survey on Building Construction Starts, by-use data (lodging use, all building owners). Cost per sqm is an estimate calculated by dividing planned construction cost by floor area started, and differs from actual contract amounts.
Related Reading
- Shizuoka’s 67 New 2026 Hotels: 1,089 Rooms, 64% One-Room Villas
- Hiroshima 2026: 1,003 New Rooms, City Settled ADR Turns -4.1% in July
- Hotels at Year 10: The Renovation Gap Is +13.6% Below 100 Rooms
- Naniwasuji & Haneda Access Lines 2031: Hotel Investment Timelines
- Hotel Build Times: 2.80-Year Median, 1.96 Solo vs 4.00 Mixed-Use
- Construction +41% & Labor Crunch Erase Japan’s 2027-2029 Hotel Supply
- Tokyo 2026: 2,055 New Rooms, 55.6% Business Hotels, ADR Turns Negative
References and Sources
■ Data sources
Projects whose primary use is lodging were extracted from publicly posted construction plan notices and aggregated by MetroEngines Research & Consulting. Scope is work type “new build” with construction start 2018-2027; after removing duplicates sharing address, floor area, number of floors and start year, the base population is 2,122 projects (1,218 with an identified contractor across 360 firms; 852 undecided; 52 joint ventures). National construction start trends use MLIT’s Statistical Survey on Building Construction Starts, lodging use, all building owners.
■ Scenario assumptions
Contractor names were consolidated by removing corporate-form markers, normalising full-width and half-width characters, and removing branch/regional/sales-office names, condensing 565 spellings into 360 firms (52 joint-venture and multi-company entries excluded from the single-contractor ranking). The decomposition of the undecided rate is a sensitivity analysis starting from the 25.2% undecided rate of the 2018 construction-start cohort and applying the 1.31x increase in median posting-to-start days (96 to 126) at elasticities of 0, 1.0 and 2.0. Cost per sqm is an estimate of planned construction cost divided by floor area started (¥332,000/sqm in 2018, ¥591,000/sqm in 2024), and buildable floor area is calculated as budget divided by unit cost (excluding land, design and supervision fees, and FF&E).
■ Limitations and caveats
This data aggregates publicly posted construction plan notices and does not cover every new-build hotel project. Because notices are issued on a rolling basis from several months before construction begins, counts for the most recent and future years (2026-2027) are expected to rise and should be read as a lower bound on the confirmed pipeline. “Undecided” reflects the status at the time of posting; contractors appointed later are not reflected. Because the share of notices stating a room count swings widely – about 57% in 2018-19 versus a few percent from 2025 – total floor area is used for size comparisons. Cost per sqm is not an actual contract amount, and the sensitivity analyses are calculations under stated assumptions, not forecasts.
■ Plan and supply data
- MetroEngines Research & Consulting – aggregation of publicly posted construction plan notices (new builds, construction start 2018-2027; N=2,122 after de-duplication, of which 1,218 have an identified contractor across 360 firms)
■ Government statistics
- MLIT, Statistical Survey on Building Construction Starts – by use and by building owner: number of buildings, floor area, planned construction cost (statistics ID 0003114490, lodging use, 2011-2024)
- MLIT, FY2024 White Paper on Land, Infrastructure, Transport and Tourism – challenges facing the construction industry