

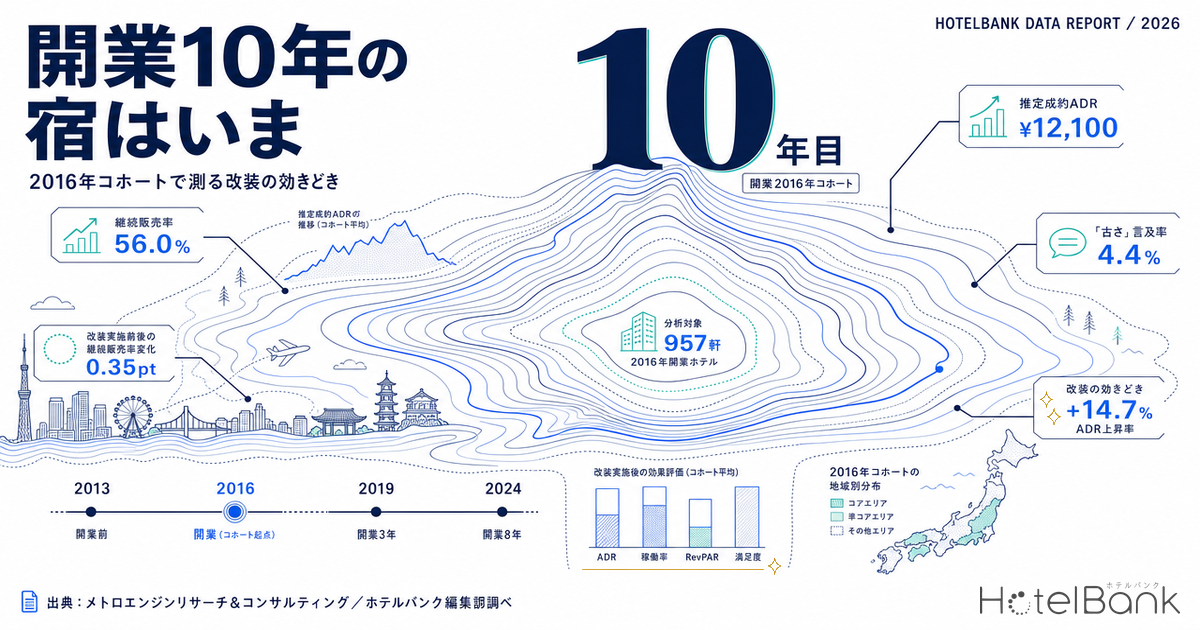
How does a hotel that opened ten years ago look as an asset today? Plenty of coverage discusses how a property ramps up in its first years, but what owners and investors actually want to know is where it stands a decade later — and, working backwards from that, when to put money into the building. This article organizes the question around opening year (cohort), lining up three measures — estimated settled ADR, guest review scores, and the rate at which reviews mention that rooms feel “dated” or that the property has been “renovated” — to describe, as a descriptive benchmark, where the passage of time actually shows up in asset value.
Metric Definitions Used in This Article
- ADR (average daily rate) = an estimated settled rate (tax-exclusive equivalent), calculated by applying a property-type correction coefficient to the lowest publicly listed plan level each property posts on OTAs (two guests per room, per-room price, tax included). Cross-checked against property-level results disclosed by listed hotel REITs, the median error is approximately 7%. These are estimates and differ from each property’s actual transacted prices or accounting figures. Cohort-level ADR is the median across the properties covered (the level of a typical property in that cohort).
- Cohort = properties grouped by the opening year that can be confirmed from OTA listing information. This corresponds to the year operations began as lodging, not the year the building was completed.
- “Dated” mention rate / “renovation” mention rate = the share of analyzed guest reviews that contain wording touching on room age or wear, and wording touching on renovation or refurbishment, identified through natural-language analysis of guest reviews. This is the frequency of mentions, not a rating score.
- Review score = the average score (out of 5) of reviews posted in the past 24 months. Data from submission channels where the score field is treated as blank is excluded from the aggregation.
- Data sources: MetroEngines Research & Consulting / guest reviews compiled by the HotelBank Editorial Team
- — Of the 1,708 properties in the 2016 opening cohort, 957 (56.0%) could be observed selling within the past 90 days. That is roughly 34 points below the 89.9% recorded by the 2024 cohort in its second year.
- — Rate levels are set by location, not by age. Among business hotels in major metropolitan areas, the gap between 2016 openings at ¥12,100 and 2019 openings at ¥13,100 is only about 8%.
- — Where age does show up is in reviews. The “dated” mention rate climbs from 2.2% for 2018 openings to 6.4% for 2013 openings, and properties above 5% score 3.95 against 4.30 — a 0.35-point drop.
- — The renovation-mention gap concentrates below 100 rooms. Against +13.6% in metro areas and +14.7% in regional markets, the gap narrows to +4.2% and +5.6% at properties with 100 rooms or more.
- — A mid-case illustration of ¥900,000 per room against a +¥900 ADR gap gives a simple payback of 3.7 years. Years eight to ten after opening — while the “dated” mention rate is still in the 2% range — is where the cost-benefit line falls.
How many hotels that opened ten years ago are still being sold today
Start with the population. Within the scope MetroEngines Research covers, 1,708 lodging properties can be confirmed as having opened in Japan in 2016. This is not a complete census — it is limited to properties whose listings could be confirmed on OTAs, and that caveat belongs up front. Of those, 957 could be observed with sales activity within the past 90 days, or 56.0%.
Run the same count by opening year and a clean gradient appears. The 2024 cohort, now in its second year, is 89.9% still selling; that falls to 61.5% for the 2018 cohort in year eight, and 56.0% for the 2016 cohort in year ten. This is not a closure rate, however. Properties that shifted to direct booking or to specific reservation channels, and those that pivoted to corporate or group business, also fall on the “sales not confirmed” side of this count. The accurate reading is the share that can be continuously observed selling on OTAs.
Source: MetroEngines Research & Consulting (based on confirmed OTA listings, all 47 prefectures of Japan, by opening year)
| Opening year | Years elapsed | Properties confirmed listed | Observed selling, past 90 days | Continued-listing rate |
|---|---|---|---|---|
| 2013 | 13 yrs | 620 | 345 | 55.6% |
| 2014 | 12 yrs | 681 | 398 | 58.4% |
| 2015 | 11 yrs | 1,094 | 637 | 58.2% |
| 2016 | 10 yrs | 1,708 | 957 | 56.0% |
| 2017 | 9 yrs | 2,144 | 1,186 | 55.3% |
| 2018 | 8 yrs | 2,128 | 1,309 | 61.5% |
| 2019 | 7 yrs | 2,077 | 1,478 | 71.2% |
| 2020 | 6 yrs | 2,257 | 1,629 | 72.2% |
| 2021 | 5 yrs | 1,820 | 1,386 | 76.2% |
| 2022 | 4 yrs | 1,681 | 1,371 | 81.6% |
| 2023 | 3 yrs | 2,014 | 1,692 | 84.0% |
| 2024 | 2 yrs | 1,974 | 1,774 | 89.9% |
Source: MetroEngines Research & Consulting (based on confirmed OTA listings. Covers the scope MetroEngines Research tracks; not a complete census)
Where the 2016 cohort is located
Break the 957 properties from the 2016 openings that are still confirmed selling down by prefecture and Kyoto stands out with 118, followed by Tokyo with 68, Okinawa with 59, Nagano with 56 and Osaka with 52. This is the cohort that came up all at once — small properties centered on Kyoto — as the surge in inbound visitors coincided with the build-out of the regulatory framework for private lodging and simple accommodations. The median property has 27.5 rooms, and the 957 properties together account for only 28,238 rooms.
This locational skew feeds straight into the rate analysis that follows. When ADR is compared across opening years at face value, much of what looks like an effect of age is in fact a difference in what was built where in that particular year.
Source: MetroEngines Research & Consulting (opened 2016, observed selling within the past 90 days, N=957 properties)
Rates are set by location, not by building age
From here the analysis narrows to the five property types for which the estimated settled ADR calculation has been validated — business hotels, city hotels, resort hotels, ryokan and capsule hotels — and covers only properties observed selling within the past 90 days. That gives 4,979 properties across the twelve cohorts from 2013 to 2024, of which 4,659 yielded an estimated settled ADR.
Looking at business hotels, the largest group by property count, the cohort median ADR rises from ¥7,100 for 2013 openings to ¥11,400 for 2018 openings, then falls to ¥8,000 for 2024 openings — a hill-shaped curve. Reading that straight as “older buildings are cheaper” is risky. Split the same data between major metropolitan areas (Tokyo, Osaka, Aichi, Kyoto, Kanagawa, Chiba, Saitama, Hyogo, Fukuoka and Hokkaido) and the rest of the country, and the shape of the curve changes completely.
Source: MetroEngines Research & Consulting (business hotels, cohort medians. Metro N=34–256 properties / regional N=51–142 properties)
Business hotels in major metropolitan areas run ¥12,500 for 2013 openings, ¥12,100 for 2016, ¥13,100 for 2019 and ¥11,200 for 2024. The gap between a ten-year-old property (2016 opening) and a seven-year-old one (2019 opening) is about 8%; between a thirteen-year-old (2013) and a seven-year-old, only about 5%. Regional markets look the same: ¥7,300 for 2016 openings against ¥8,400 for 2019, a difference of 13%. Much of the large step visible in the all-Japan figures was created by differences in the metro share of each opening year — the 2013–2015 cohorts are roughly 60% regional, while the 2018–2020 cohorts are more than 60% metro.
Put differently, the level of the rate itself is determined more by location than by age, and simply having reached ten years does not by itself pull rates down materially. For owners that is encouraging. If a ten-year-old asset is not structurally destined to lose pricing power, then whether rates hold has a great deal to do with operations and capital expenditure.
Where age clearly shows: “dated” mentions in reviews
What does not show up in rates does show up in what guests write. Guest reviews compiled by the HotelBank Editorial Team were run through natural-language analysis, and the share of reviews touching on room age or wear was calculated by cohort. To keep the number of analyzed reviews from skewing between properties, the calculation is limited to properties with at least 100 analyzed reviews.
The result was unambiguous. The average “dated” mention rate is 6.4% for the 2013 cohort (N=77 properties), 5.6% for 2015 (N=130), 4.4% for 2016 (N=173), 3.0% for 2017 (N=248), 2.2% for 2018 (N=257) and 1.0% for 2019 (N=98). Around the ten-year mark, the frequency with which guests remark on the age of the rooms clearly begins to rise. The mention rate for “renovation” or “refurbishment,” by contrast, was broadly flat at 3.5–4.1% across the 2013–2018 cohorts, which each contain more than 100 properties. Renovation itself happens in every generation; the differences appear within a cohort rather than between them.
Source: HotelBank Editorial Team research (natural-language analysis of guest reviews. Limited to properties with at least 100 analyzed reviews, N=72–257 properties per cohort)
Note that from the 2019 cohort onward the number of properties covered falls (N=72–98), so the finer movements beyond that point should not be over-read. The reliable range is 2013–2018, where each cohort exceeds 100 properties. Across that range the “dated” mention rate declines almost monotonically, and the correspondence between age and mention frequency comes through cleanly.
A 5% “dated” mention rate is the watershed for review scores
So what happens as mentions of age increase? Take the 870 properties opened between 2013 and 2017 (nine to thirteen years elapsed) that have at least 50 reviews and an available estimated settled ADR, and split them into four bands by “dated” mention rate.
| “Dated” mention rate | Properties | Review score | Median estimated settled ADR | Median rooms |
|---|---|---|---|---|
| No mentions | 323 | 4.30 | ¥10,700 | 81 rooms |
| 0–2% | 83 | 4.29 | ¥11,100 | 150 rooms |
| 2–5% | 229 | 4.22 | ¥13,400 | 132 rooms |
| 5% or more | 235 | 3.95 | ¥9,970 | 55 rooms |
Source: MetroEngines Research & Consulting / HotelBank Editorial Team research (openings 2013–2017, at least 50 reviews, N=870 properties)
Source: HotelBank Editorial Team research (openings 2013–2017, N=870 properties)
Up to 2% there is almost no effect on scores. Even in the 2–5% band the decline is slight, to 4.22. Above 5%, however, the score falls to 3.95, widening the gap against the no-mentions band to 0.35 points. On a five-point average score, 0.35 is enough to move where a property sits in search results and how it reads during comparison. Note too that the 5%-and-above band has a median of just 55 rooms. The smaller the property, the more directly age feeds into its score. Larger properties spread evaluation across public areas, food and service, whereas at a small property the rooms themselves carry almost the entire score.
The window where renovation works concentrates below 100 rooms
This is the core of the article. Business hotels opened between 2013 and 2017 were split into four strata by location (major metropolitan area / regional) and size (under 100 rooms / 100 rooms or more), and within each stratum the group with a renovation mention rate of 3% or higher was compared against the group below 3%. With location and size held constant, this describes how properties that draw many renovation mentions differ, in rate and in score, from those that draw few.
| Stratum | Renovation mention rate 3% or higher | Renovation mention rate below 3% | ADR gap | ||||
|---|---|---|---|---|---|---|---|
| N | ADR | Score | N | ADR | Score | ||
| Metro, under 100 rooms | 53 | ¥11,200 | 4.09 | 47 | ¥9,900 | 3.82 | +13.6% |
| Metro, 100 rooms or more | 123 | ¥13,600 | 4.21 | 113 | ¥13,100 | 4.13 | +4.2% |
| Regional, under 100 rooms | 40 | ¥7,300 | 4.15 | 58 | ¥6,400 | 3.87 | +14.7% |
| Regional, 100 rooms or more | 55 | ¥8,400 | 4.15 | 71 | ¥8,000 | 4.14 | +5.6% |
Source: MetroEngines Research & Consulting / HotelBank Editorial Team research (business hotels opened 2013–2017, at least 50 reviews, N=560 properties)
* The ADR gap (%) is calculated from unrounded medians, so it differs by roughly 0.4–0.6 points from a figure recalculated using the rounded ADR values shown in the table.
Source: MetroEngines Research & Consulting / HotelBank Editorial Team research (N=560 properties)
In all four strata, the group drawing more renovation mentions sits higher on both rate and score. But the size of the gap differs completely by stratum. Under 100 rooms the spread is double-digit — +13.6% in metro areas and +14.7% in regional markets — while at 100 rooms or more it narrows to +4.2% and +5.6%. Review scores follow the same pattern: +0.27 to +0.28 points under 100 rooms, but only +0.08 and +0.01 at 100 rooms or more.
The same direction holds for ryokan. Of the 163 ryokan opened between 2013 and 2017, the 84 with a renovation mention rate of 3% or higher had a median estimated settled ADR of ¥20,300 and a score of 4.43, against ¥16,000 and 4.27 for the 79 below 3%. Median room counts were 18 and 14 respectively — small properties in both cases.
These are descriptions of correlation, not evidence that renovation pushed rates up. The reverse ordering — that properties with earnings power are the ones able to commit to a renovation — is entirely plausible. Even so, the implication for owners is clear. The greatest apparent upside per yen invested sits in the range around ten years after opening, at properties under 100 rooms. At large properties, capital expenditure is less likely to surface as a rate difference; the smaller the property, the more directly room condition translates into pricing power.
Properties holding high scores on a ten-year-old asset
From the cohorts centered on 2016 openings, the following properties combine high review scores over the past 24 months with frequent mentions of renovation or refurbishment in their reviews. Each was confirmed as operating on its official website before being listed here.
| Property | Location | Rooms | Score | Reviews | Renovation mention rate |
|---|---|---|---|---|---|
| Hotel Kanra Kyoto (ホテルカンラ京都) | Kyoto | 68 | 4.73 | 1,234 | 10.1% |
| AYA Niseko (綾ニセコ) | Hokkaido | 79 | 4.50 | 354 | 8.0% |
| HOTEL SHE, KYOTO | Kyoto | 34 | 4.48 | 678 | 10.6% |
| Daiwa Roynet Hotel Matsuyama (ダイワロイネットホテル松山) | Ehime | 307 | 4.41 | 2,559 | 4.9% |
| Kanazawa Sainoniwa Hotel (金沢 彩の庭ホテル, opened 2015) | Ishikawa | 64 | 4.76 | 871 | 6.2% |
Source: HotelBank Editorial Team research (review scores and renovation mention rates over the past 24 months) / MetroEngines Research & Consulting (room counts)
What they share is scale — all around 100 rooms or fewer — and a history of work done within a few years of opening that surfaces in the reviews. HOTEL SHE, KYOTO carried out a full refurbishment three years after opening and established itself as a destination hotel in the Higashi-Kujo area, as documented by the firm’s creative partner. Viewed over a ten-year horizon, the properties holding high scores tend to be those that rebuilt themselves once along the way, rather than carrying the original opening concept straight through.
Renovation costs keep rising — the opportunity cost of waiting
One thing that cannot be ignored in deciding when to act is the rise in construction costs. The Ministry of Land, Infrastructure, Transport and Tourism’s construction cost deflator stood at 130.0 as of August 2025 (FY2015 = 100), roughly 30% above where it was at the start of 2016. Public works design labor rates were also raised in FY2025 for the thirteenth consecutive year, and costs continue to be pushed up from both the materials and the labor side.
In practice, guideline figures for 2025 put guest-room-only refurbishment at roughly ¥500,000–¥1,000,000 per tsubo (3.3 m²), and full refurbishment including public areas and building systems at roughly ¥1.2 million–¥2.0 million. Wallpaper replacement is quoted at ¥250,000–¥450,000 per guest room and lighting renewal at ¥180,000–¥350,000 — each running 10–20% above previous levels, reflecting higher materials prices.
The opportunity cost of deferring a renovation therefore bites twice: “dated” mentions accumulate in reviews and scores drift down, and the construction cost itself rises every year. Put the other way round, the stage at which the “dated” mention rate is still in the 2% range — roughly years eight to ten after opening — reads as the easiest point at which to act on a cost-benefit basis. Move only after passing 5% and you carry both the score recovery and the higher construction bill.
For a real example of investment impact, the renovation cases published by Japan Hotel REIT Investment Corporation (ジャパン・ホテル・リート投資法人) are instructive. At one of its properties, a ¥45 million investment converted 19 of 219 rooms to a residential type, and added beds raised per-room capacity from two or three guests to a maximum of five. First-half 2025 ADR came in at ¥34,890, up 90.5% against the same period of 2019. It is a case showing that even concentrated investment in a limited number of rooms can feed through to rate when it changes how the rooms themselves are used.
Estimating the payback period per yen invested
Everything to this point describes observed differences. To turn that into an ownership decision, the difference has to be restated as the period over which it repays the money put in. What follows is an illustrative scenario combining the stratum-level ADR gaps observed in this article with the renovation cost ranges from the previous section; it is not a business plan for any specific property. Incremental revenue is simplified as “ADR gap × 365 days × assumed occupancy,” and the payback period as “investment ÷ incremental revenue.” Assumed occupancy is set at 75% on a full-year basis for the mid case.
| Scenario | Assumption | Basis for the ADR gap | ADR gap | Incremental revenue (per room, per year) | Simple payback |
|---|---|---|---|---|---|
| Pessimistic | Response no better than at large properties | Observed gap, metro / 100 rooms or more | +¥500 | ¥136,875 | 6.6 yrs |
| Mid | Response in line with regional properties under 100 rooms | Observed gap, regional / under 100 rooms | +¥900 | ¥246,375 | 3.7 yrs |
| Optimistic | As observed at metro properties under 100 rooms | Observed gap, metro / under 100 rooms | +¥1,300 | ¥355,875 | 2.5 yrs |
Source: illustrative calculation based on MetroEngines Research & Consulting / HotelBank Editorial Team research (ADR gaps are the observed values in the tables above)
Change the investment amount and the picture changes. The next table sets out simple payback periods across two axes: investment per room and ADR gap.
| Investment per room | ADR gap (per room, per night) | |||
|---|---|---|---|---|
| +¥400 Regional, 100 rooms or more | +¥500 Metro, 100 rooms or more | +¥900 Regional, under 100 rooms | +¥1,300 Metro, under 100 rooms | |
| ¥450,000 Surface refresh: wallpaper + lighting | 4.1 yrs | 3.3 yrs | 1.8 yrs | 1.3 yrs |
| ¥900,000 Room interiors + furnishings | 8.2 yrs | 6.6 yrs | 3.7 yrs | 2.5 yrs |
| ¥1,350,000 Interiors + partial systems renewal | 12.3 yrs | 9.9 yrs | 5.5 yrs | 3.8 yrs |
| ¥1,800,000 Full guest room including bathroom | 16.4 yrs | 13.2 yrs | 7.3 yrs | 5.1 yrs |
Source: illustrative calculation based on the observed ADR gaps and renovation cost ranges given above (incremental revenue = ADR gap × 365 × 0.75)
Three things stand out. First, at the ADR gaps observed below 100 rooms (+¥900 to +¥1,300), everything from a surface refresh to a full room-interior renewal pays back in roughly one to four years. Second, at the gaps observed at 100 rooms or more (+¥400 to +¥500), the same investment stretches to eight to sixteen years. The implication noted earlier — that at large properties, levers other than guest-room renovation work better — becomes sharper when expressed as a payback period. Third, a full refurbishment including the bathroom (¥1.8 million per room) takes more than five years even below 100 rooms. How the scope of work is designed changes the conclusion.
Setting assumed occupancy at 65% for the full year multiplies the payback periods by roughly 1.15; at 85%, by roughly 0.88. Occupancy levels themselves are outside the scope of this analysis, and any real decision needs to substitute the property’s own actuals. This calculation is also on an incremental-revenue basis and excludes operating costs, revenue lost during the works, and the FF&E replacement cycle. On a GOP basis the payback period would be longer than shown.
Conclusion — how to read a ten-year-old asset
To draw the findings together. First, most of the difference in estimated settled ADR across opening years is explained by differences in locational composition. Among business hotels in major metropolitan areas, the rate gap between 2016 and 2019 openings is only about 8%. Reaching ten years does not by itself break pricing.
Second, where age clearly appears is in what guests write. The rate at which reviews mention room age climbs from 2.2% for 2018 openings to 6.4% for 2013 openings, taking off around the ten-year mark. And among properties above a 5% mention rate, review scores fall from 4.30 to 3.95 — a drop of 0.35 points.
Third, the gap between properties whose reviews mention renovation and those that do not is concentrated in the range below 100 rooms. With location and size held constant, metro properties under 100 rooms show +13.6% and regional ones +14.7%. At 100 rooms or more the gap narrows to +4–6%. Ryokan point in the same direction.
From an ownership perspective, that adds up to a single focal combination: eight to ten years after opening, under 100 rooms, with a “dated” mention rate still in the 2% range. An asset at that stage is well positioned to capture upside in both rate and score from a limited outlay. At large properties, by contrast, levers other than guest-room renovation — how public areas are used, how the product is designed — are more likely to work. Lined up by cohort, ten years reads less as a period over which an asset erodes than as the period over which enough information accumulates to judge where to put the money.
⚠ On the scope of the data: Opening years are those confirmable from OTA listing information, aggregated within the scope MetroEngines Research tracks. This is not a complete census. “No sales observed in the past 90 days” does not necessarily mean closure; it also captures changes in sales channel and similar shifts. Where individual properties are named, operations were confirmed on the official website, though circumstances may change after publication. The relationship between renovation mention rates and rate or score is a descriptive correlation and does not demonstrate causation.
Related reading
- Listed vs Settled ADR Gap: Japan’s 46-Prefecture Upside Map 2026
- A 4.1 Review Score Is Average, Not a Strength: Sapporo Price Position
References and Sources
■ Data sources
Opening years confirmable from OTA listing information, estimated settled ADR, and sales observation status over the past 90 days (MetroEngines Research & Consulting). Coverage is limited to properties located in Japan’s 47 prefectures; listings whose location cannot be identified are excluded from the population. Review-derived metrics (“dated” mention rate, “renovation” mention rate, review score) are compiled by the HotelBank Editorial Team and cover posts from the past 24 months.
■ Assumptions behind the calculations
The “payback period per yen invested” tables are illustrative. ADR gaps use the observed stratum-level differences from the body text (+¥400 to +¥1,300) as they stand; assumed occupancy is 75% for the full year in the mid case (with 65% and 85% shown as sensitivities); and investment per room takes ¥450,000 to ¥1,800,000 from the renovation cost ranges cited above. Incremental revenue = ADR gap × 365 days × assumed occupancy; simple payback period = investment per room ÷ incremental revenue. These are not business plans for any specific property.
■ Limitations and caveats
(1) The payback estimate is on an incremental-revenue basis and excludes operating costs, revenue lost during the works, and the FF&E replacement cycle. On a GOP basis the payback period would be longer. (2) The relationship between renovation mention rates and rate or score is a descriptive correlation and does not demonstrate causation; the reverse explanation — that properties with earnings power are the ones able to commit to a renovation — also holds. (3) This analysis contains no measured occupancy data and evaluates asset condition on two metrics, rate and guest review score. Assessing profitability inclusive of occupancy requires separate verification. (4) The ADR gaps (%) in the stratified comparison table are calculated from unrounded medians and therefore differ by roughly 0.4–0.6 points from figures recalculated using the displayed ADRs. (5) “No sales observed in the past 90 days” is not synonymous with closure and includes changes in sales channel and similar shifts.
■ Market data
- MetroEngines Research & Consulting — opening-year data based on confirmed OTA listings, estimated settled ADR, sales observation status (N=620–2,257 properties per cohort)
- HotelBank Editorial Team research — natural-language analysis of guest reviews (“dated” mention rate, “renovation” mention rate), review scores over the past 24 months
■ Government statistics and public data
■ REIT and industry materials
- Japan Hotel REIT Investment Corporation, “Hotel Operating Results” (Japanese)
- [Hotel REIT case study] Investment amounts and ADR: the effect of renovation seen through examples in Sapporo and Urayasu (Japanese)
■ Renovation cost benchmarks
- Interior construction cost benchmarks for hotels and ryokan: per-tsubo rates, cost breakdowns and estimating guidelines (Japanese)
- What do hotel renovations cost? Available subsidies and pitfalls, explained by professionals (Japanese)
- Trends and outlook for construction costs (Japanese)
■ Official information for individual properties