

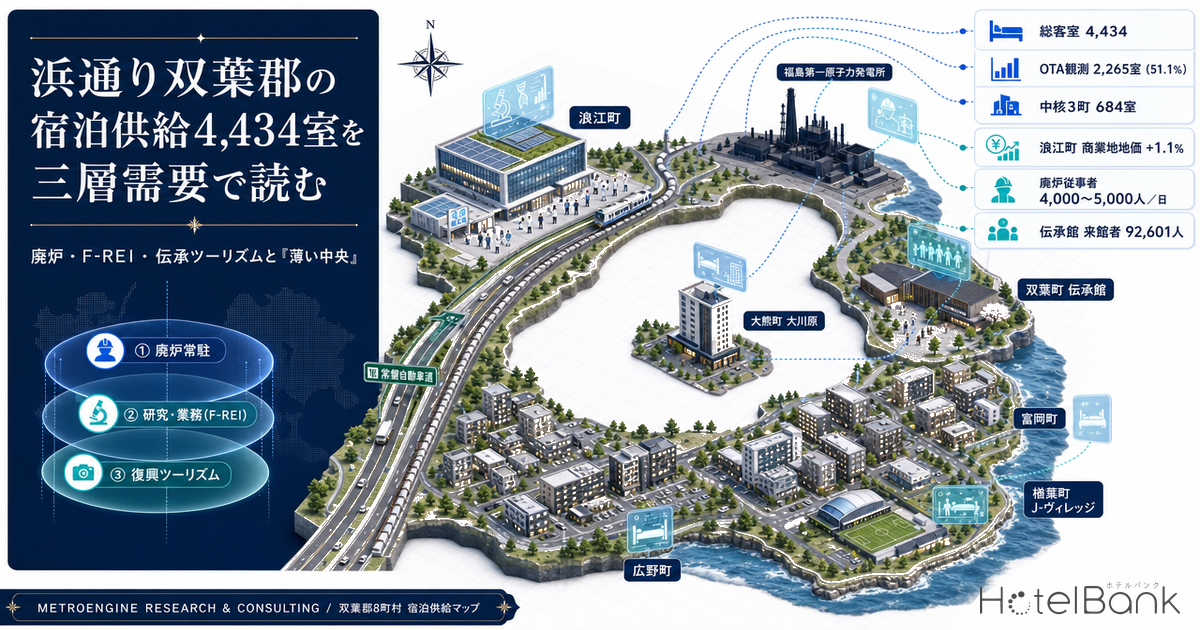
The eight municipalities of Futaba District in Fukushima Prefecture’s Hamadori coastal region contain 63 verified operating lodging facilities with 4,434 guest rooms. Yet only 2,265 of those rooms — barely half — appear with published prices on OTAs and other general distribution channels. The remainder is contract-based long-stay inventory, making supply and demand difficult to read from the outside. This article overlays three distinct demand sources — long-term resident demand from decommissioning work, business demand generated by the Fukushima Institute for Research, Education and Innovation (F-REI), and leisure demand from disaster-memorial tourism — onto data on resident population, employment structure, land prices, and the supply pipeline, mapping quantitatively where this area’s lodging supply is thick and where it is open.
Metric Definitions Used in This Article
- ADR (average daily rate): An estimated settled rate (tax-exclusive equivalent) calculated by applying category-specific adjustment coefficients to the lowest published plan level each facility lists on OTAs (double occupancy, per room, tax included). Cross-checked against property-level actuals disclosed by listed hotel REITs (91 facilities, most recent three months), the median error is approximately 7%. These are estimates and differ from each facility’s actual transacted rates or accounting figures. Area-level ADR is the median of the facilities covered (the level of a typical facility in the area).
- Listed price (all-plan average): The average selling price across all plans, from room-only to meal-inclusive (double occupancy, per room, tax included). This uses a different basis from ADR.
- OTA-observed inventory: The number of guest rooms with prices published on OTAs and other general distribution channels, within the scope tracked by MetroEngines Research. Inventory sold only through contracts or bulk corporate use is excluded.
- Data sources: MetroEngines Research & Consulting / Ministry of Land, Infrastructure, Transport and Tourism (National Land Numerical Information, Real Estate Information Library) / Ministry of Internal Affairs and Communications and Ministry of Economy, Trade and Industry (Economic Census)
- — Of 63 facilities and 4,434 rooms, only 27 facilities and 2,265 rooms (51.1%) carry prices on OTAs and other general distribution channels. The remaining 2,169 rooms are centered on bulk corporate and long-term contracts, leaving supply-demand opaque from the outside.
- — Supply is skewed south. Hirono, Naraha, and Tomioka alone account for 3,627 rooms, or 82%, while Futaba, Okuma, and Namie — the three towns closest to the demand sources — hold just 684 rooms, or 15%: a “donut-shaped” distribution.
- — Demand comes in three layers — resident decommissioning workers (on the order of 4,000-5,000 per day), F-REI-related business travel, and memorial tourism (92,601 visitors in FY2025) — and the weekday and weekend peaks do not overlap.
- — On price, 83% of distributed inventory sits below ¥8,000, and only 2 facilities with 298 rooms price at ¥10,000 or above. The business and research stay band (¥10,000-¥16,000) is the largest white space.
- — In a simplified model, converting existing stock delivers a 13.7% investment yield with 7.3-year payback, beating a new-build business hotel (6.0%, 16.6 years). Land prices have turned only in Namie’s commercial zone, at +1.1%.
Three-Layer Demand Structure — Weekday Residency, Business Travel, and Weekend Visits Do Not Overlap
Lodging demand in the core of Hamadori is composed entirely differently from that of a typical regional city. Seasonal tourism demand is not the main axis; instead, three demand sources of different character coexist in the same area. Because each generates on different days of the week, with different lengths of stay and different price tolerances, the defining feature from the supply side is that this cannot be treated as a single market.
The first layer is resident demand tied to decommissioning work. According to disclosures from Tokyo Electric Power Company Holdings and press reporting, on the order of 4,000-5,000 people per day are engaged in decommissioning-related work at the Fukushima Daiichi Nuclear Power Station. The government and TEPCO have set 2051 as the completion target, and while its feasibility is debated, the underlying premise — that a workforce of meaningful scale will continue to stay in Hamadori for at least the next two decades — has not changed. This layer is concentrated on weekdays, involves long consecutive stays and corporate contracts, and is highly price-sensitive.
The second layer is business and research demand centered on the Fukushima Institute for Research, Education and Innovation (F-REI), established in April 2023. Its headquarters is in Namie, and the main facility site has been fixed in the town’s Kawazoe district. The mid-term plan calls for expanding the number of principal investigators (PIs) in stages to roughly 15 in 2026 and roughly 50 in 2030, with facilities to enter phased use within the Reconstruction Agency’s mandate period (FY2030). Beyond the researchers themselves, joint-research partners, contracted companies, and inspection delegations accumulate on top — and unlike the first layer, this group demands a higher standard of meeting rooms and workspace.
The third layer is reconstruction tourism. The Great East Japan Earthquake and Nuclear Disaster Memorial Museum in Futaba recorded 92,601 visitors in FY2025, up 6,050 from the prior year and the second-highest level since opening. Cumulative visitors reached 400,000 in August 2025. The museum targets 101,000 visitors a year by FY2030, and against the backdrop of the 15-year milestone and heightened interest in natural disasters, visits including educational travel, corporate training, and study tours are growing. This layer concentrates on weekends and holiday periods, with short stays of one to two nights.
| Demand layer | Primary source | Time horizon | Day-of-week and stay profile | Lodging requirements |
|---|---|---|---|---|
| 1. Decommissioning residency | Decommissioning work at Fukushima Daiichi (on the order of 4,000-5,000 people/day) | 2051 completion target = long term | Weekday-concentrated, long consecutive stays | Low rate, meals included, bulk corporate contracts |
| 2. Research and business | F-REI (Namie) / travel by related companies and joint-research partners | Plan to expand from ~15 PIs in 2026 to ~50 in 2030 | Mainly weekdays, 2-4 nights | Meeting rooms, workspace, mid-rate band |
| 3. Reconstruction tourism | Memorial Museum and other commemorative facilities (92,601 visitors in FY2025) | FY2030 target of 101,000 visitors | Weekends and holidays, 1-2 nights | Experiences, food, connection to local assets |
What matters is that the peaks of these three layers offset one another. Layers 1 and 2 arise on weekdays; layer 3 on weekends. The “weekend occupancy trough” that burdens ordinary regional business hotels can, structurally, be filled here. Put the other way, whether a facility is specified to capture all three layers can substantially change its annual occupancy profile even at the same location.
Supply Structure — A “Donut” Thick in the South, Thin in the Center
So how is supply arranged against that demand? Within the scope tracked by MetroEngines Research, the eight municipalities of Futaba District hold 63 facilities and 4,434 rooms. Broken down by municipality, a clear imbalance emerges.
Hirono (1,725 rooms) and Naraha (633 rooms) — in the belt 20-30 km south of the power station — account for 2,358 rooms on their own, or 53% of Futaba District. Adding Tomioka’s 1,269 rooms brings the total to 3,627 rooms, or 82%, so supply leans heavily to the south. By contrast, the three towns nearest the power station — Futaba (269 rooms), Okuma (154 rooms), and Namie (261 rooms) — total just 684 rooms, or 15% of the district. Rooms are thinnest right next to the power station and the Memorial Museum, the very sources of demand. This “donut-shaped” supply layout is the structural signature of core Hamadori.
A second point not to overlook is the separation between distributed and contracted inventory. Of the 63 facilities and 4,434 rooms, prices are observable on OTAs and other general distribution channels for only 27 facilities and 2,265 rooms (51.1%). The remaining 2,169 rooms are centered on bulk corporate and long-stay contracts and cannot be counted as inventory a general traveler can book at will. The tendency is strongest among facilities of 300-plus rooms: of Hirono’s 1,725 rooms, only 922 (53%) are distributed inventory. Namie is the opposite — 260 of its 261 rooms (99.6%) are distributed, a completely different character.
There is also a clear wave in when supply was built. In the five years from 2016 to 2020, 17 facilities and 2,156 rooms opened — 49% of all rooms in Futaba District. That period coincided with the full opening of the Joban Expressway, the phased lifting of evacuation orders, and the ramp-up of decommissioning work. In the six years from 2021 onward, only 9 facilities and 549 rooms were added, a markedly calmer pace. In other words, half of the current stock consists of relatively new buildings only about five to ten years old. For anyone weighing renovation or conversion, that age profile is an encouraging input.
Location Assessment — Land Prices Signal a Turn in Namie
Against that skewed supply, how is the land market moving? Organizing MLIT’s Published Land Prices (as of January 1, 2025) for the standard sites within Futaba District, one municipality stands apart.
In Namie, the commercial site (Gongendo Machigashira, 600 m from Namie Station) came in at ¥26,800/sqm, up 1.1% year on year, and the residential site at ¥14,700/sqm, up 0.7% — both turning positive. By contrast, Tomioka’s commercial site stood at ¥30,000/sqm, down 1.3%; its land-readjusted residential site at ¥24,600/sqm, down 1.6%; and residential sites in Hirono and Naraha ranged from −0.4% to −1.7%. That Namie alone reversed direction within Futaba District suggests the land market is beginning to price in a concrete siting decision: the location of F-REI’s headquarters.
| Area classification | Non-demarcated city planning area |
| Use district | Quasi-industrial district |
| FAR / building coverage | 200% / 60% |
| Nearest station | JR Joban Line, Namie Station, 600 m |
| Frontage road | National route, 30.0 m wide |
| Water and sewer | Supplied and connected |
Namie, Tomioka, and Naraha have all designated tsunami-related disaster hazard zones by ordinance, restricting residential construction in low-lying coastal areas. The inland side along National Route 6 and around railway stations, where lodging facilities cluster, falls outside those designated zones, and the building regulations applying to the standard sites pose no obstacle to lodging development. For any development study, cross-checking the zone designation maps against the ordinances (including the Namie Town Ordinance on Disaster Hazard Zones) is the first step.
Resident Population and Employment — The Gap Between Who Lives There and Who Works There
To read a location’s demand base, resident population and working population have to be viewed separately. In core Hamadori, the two diverge in a way entirely unlike a typical regional city.
As the map shows, resident population is thinly distributed at the northern and southern ends (toward Hirono and Minamisoma) and in each town’s central district, with a void spreading around the power station. In aggregate, the target meshes across core Hamadori total 16,539 residents (2020 Census basis); the 2040 projection is 12,106, a decline of 26.8%, with an elderly share of 38.2%.
| Point (3 km radius) | Residents, 2025 | 2040 projection (vs. 2020) | Working-age share | Establishments | Employees | Office-sector share |
|---|---|---|---|---|---|---|
| Central Namie | 1,552 | 1,185 (−28.9%) | 57.7% | 94 | 821 | 8.5% |
| Central Tomioka | 1,801 | 1,499 (−20.7%) | 65.2% | 133 | 2,157 | 19.5% |
| Okuma, Okawara | 866 | 790 (−9.9%) | 86.5% | 24 | 347 | 0.0% |
| Central Naraha | 2,686 | 2,084 (−28.8%) | 52.6% | 128 | 1,779 | 7.1% |
| Around Futaba Station | 13 | 7 (−53.3%) | 45.0% | 4 | 19 | 0.0% |
| Minamisoma, Haramachi | 31,023 | 25,326 (−24.6%) | 54.0% | 1,544 | 12,139 | 10.2% |
| Around Iwaki Station | 56,594 | 49,357 (−17.9%) | 59.6% | 3,841 | 33,646 | 15.4% |
Three points stand out in this table. First, the 86.5% working-age share in Okuma’s Okawara district. While surrounding municipalities run between 52% and 65%, Okawara is a newly built urban district serving as a reconstruction hub, and working-age people are concentrated there. That signals a process distinct from “residents returning” — namely, “people who work there beginning to live there.” Second, Tomioka’s 19.5% office-sector employment share is the highest in Futaba District, exceeding even the area around Iwaki Station (15.4%). It likely reflects the clustering of wide-area functions such as the Futaba Medical Center and of reconstruction-related office operations, making it the thickest receptacle for weekday business demand. Third, the figure of 13 residents around Futaba Station reflects the fact that its evacuation order was lifted last, in August 2022; resumption of residency is only now entering its main phase. The same method of extracting meshes nationwide where both resident population and employment are growing is also used to screen development sites in Dual-Growth Mesh 2040: 17 Prime Hotel Development Sites in Japan.
Because the employment data is based on the 2021 Economic Census, employees at research hubs and industrial parks opened since then are not reflected. It is reasonable to assume actual conditions are stronger than these figures suggest.
Price Positioning — Rates Cluster Below ¥8,000
With demand and supply mapped, the next step is the price distribution. According to MetroEngines Research data, the estimated settled ADR (trailing 12-month average) of the 27 facilities and 2,265 rooms with observable OTA prices in Futaba District is distinctly weighted to the low end.
The band below ¥8,000 holds 24 facilities and 1,872 rooms — 83% of distributed inventory. The ¥6,000-7,999 range alone is packed with 10 facilities and 1,015 rooms. This pricing is optimized for the long consecutive stays generated by decommissioning work, and its ability to fill rooms is proven. Above ¥10,000, by contrast, there are only 2 facilities with 298 rooms: J-Village Hotel in Naraha (200 rooms, ¥10,100) and FUTATABI FUTABA FUKUSHIMA, which opened in Futaba in June 2026 (98 rooms, ¥10,300).
Dense Where the market is full
¥3,000-¥8,000 x 20-250 rooms
24 facilities, 1,872 rooms. A consecutive-stay price band optimized for resident decommissioning demand, with proven ability to fill. A range where new entrants struggle to differentiate.
Opportunity 1 Business and research stays
¥10,000-¥16,000 x 50-120 rooms
Only 2 facilities today. As travel by F-REI-affiliated researchers and joint-research partners expands, there is upside in a mid-scale band equipped with meeting rooms and private workspace.
Opportunity 2 Experiential stays and MICE
Above ¥16,000 x 40-100 rooms
A range a retreat-format property entered for the first time only in June 2026. Against demand that bundles memorial tourism with corporate training, supply is still taking shape.
Tracking the past 13 months by municipality reveals differences in how prices move as well.
Naraha runs at ¥6,900-¥8,300, roughly in line with the Fukushima Prefecture average (¥7,100-¥8,000), while Futaba has stepped up from ¥5,300 in June 2025 to ¥7,900 in June 2026. Futaba’s increase includes an upward pull from a new opening entering the sample that month, so it cannot be equated with rate increases at individual facilities — but the standard level for the area has clearly moved up a notch. Hirono, by contrast, ranges from ¥3,700 to ¥5,200, reflecting the town’s preponderance of large contract-based inventory. Note also that Futaba, Naraha, and Okuma cover only 1-2 facilities each, so a single property’s movement can swing the area figure substantially. Across Fukushima Prefecture as a whole, the ADR hierarchy separates into distinct tiers, with Aizu, Urabandai, Iwaki, and Koriyama each occupying different levels and carrying different headroom.
Supply Pipeline — Start From the Premise That Confirmed Supply Is Near Zero
What about future supply? Extracting building-plan data for Fukushima Prefecture from MLIT’s Building Activity Statistics Survey, the only plan registered as a lodging facility is a 60-room project in Fukushima City (scheduled for completion in December 2027); no plans in core Hamadori can be confirmed at this point.
The caveat here is structural: this data is based on building confirmation applications, which are typically filed one to two years before opening. Projects opening from 2028 onward have therefore not yet been filed, and this count must be read as a floor on the currently confirmed pipeline. Filings will be added over time, so both project and room counts are expected to rise, and the reading that “supply dries up after 2028” does not hold. Likewise, opening data based on confirmed OTA listings only appears a few months before opening, so recent and forward months will grow as listings appear.
What can still be said is that, over at least the next two to three years, there is currently no observable sign of large-scale new supply entering core Hamadori. The June 2026 opening of a 98-room retreat-format hotel in Futaba is for now the area’s largest supply event. That property sits on a roughly 23,000 sqm site with about 7,000 sqm of floor area, and offers four banquet and conference rooms of up to roughly 430 sqm, a spa and sauna, a fitness facility, a restaurant, and a library. Located in the Nakano district reconstruction industrial park in Futaba, it is reached by shuttle bus from Futaba Station on the JR Joban Line. Its listed price (all-plan average) of around ¥42,000 forms a price band that had never existed in Futaba District, making it a bellwether for the ceiling of demand in the area.
Development Scenarios — Converting Existing Stock Works Better Than Building New
Building on the data so far, we model the earnings structure of a lodging project in core Hamadori under three patterns. The model has to incorporate prevailing construction costs. Based on MLIT’s Construction Starts Statistics for 2025, unit construction costs for hotel use run at ¥2.405 million per tsubo for steel-frame and ¥2.026 million per tsubo for reinforced concrete. On top of that, Turner & Townsend’s construction cost forecast projects increases of 5.3% in 2026, 5.0% in 2027, and 4.5% annually from 2028, so inflation during the construction period must be factored in.
| Item | A. New-build business hotel | B. Existing-stock conversion Recommended | C. New-build retreat / MICE |
|---|---|---|---|
| Rooms | 100 | 80 | 60 |
| Area per room / guest-room share of floor area | 18 sqm / 68% | Existing structure reused | 30 sqm / 55% |
| Assumed gross floor area | approx. 2,650 sqm | — | approx. 3,270 sqm |
| Construction / renovation unit cost | ¥2.0M per tsubo | ¥8.0M per room | ¥2.6M per tsubo |
| Land acquisition (assumed) | 2,500 sqm x ¥21,700 | — | 3,500 sqm x ¥26,800 |
| Total investment | ¥1.66bn | ¥640M | ¥2.67bn |
| Assumed ADR (tax-exclusive equivalent) | ¥7,000 | ¥9,500 | ¥18,000 |
| Assumed occupancy (full-year basis) | 78% | 70% | 60% |
| Annual revenue | ¥199M | ¥194M | ¥237M |
| GOP margin / GOP | 50% / ¥100M | 45% / ¥87M | 30% / ¥71M |
| Investment yield | 6.0% | 13.7% | 2.7% |
| Simple payback period | 16.6 years | 7.3 years | 37.6 years |
| After construction inflation (2028 opening case, +7.2%) | ¥1.77bn / 5.6% | — | ¥2.85bn / 2.5% |
The conclusion is clear. Against current ADR levels — with the area’s core band at ¥6,000-¥8,000 — building new at construction costs above ¥2 million per tsubo leaves earnings tight. Conversely, acquiring and renovating the relatively young stock built intensively between 2016 and 2020, adding meeting rooms, workspace, and a shared lounge, and repositioning into the business and research stay band (around ¥10,000) wins on capital efficiency. The model puts that at a 13.7% yield with 7.3-year payback — more than double the return of the new-build business hotel (6.0%).
A full-specification new build like Scenario C should not be judged on standalone profitability alone. Fukushima Prefecture maintains various corporate-siting support programs under the Fukushima Innovation Coast Framework, and part of the initial investment may qualify for subsidy. Eligibility and subsidy rates vary by project content and timing, so individual consultation with the prefecture’s Commerce, Industry and Labor Department and with the Fukushima Innovation Coast Framework Promotion Organization is a prerequisite — but a comprehensive scheme that includes a role as a community exchange hub is the realistic answer.
Sensitivity Analysis and Risk Factors
| Scenario | Base case | ADR −10% | Occupancy −5pt | Both |
|---|---|---|---|---|
| A. New-build business hotel, GOP | ¥100M | ¥90M | ¥93M | ¥84M |
| A. Investment yield | 6.0% | 5.4% | 5.6% | 5.1% |
| B. Existing-stock conversion, GOP | ¥87M | ¥79M | ¥81M | ¥73M |
| B. Investment yield | 13.7% | 12.3% | 12.7% | 11.4% |
| Assumed ADR \ assumed occupancy (full-year basis) | 60% | 65% | 70% | 75% | 80% |
|---|---|---|---|---|---|
| ¥8,500 | 10.5% | 11.3% | 12.2% | 13.1% | 14.0% |
| ¥9,000 | 11.1% | 12.0% | 12.9% | 13.9% | 14.8% |
| ¥9,500 | 11.7% | 12.7% | 13.7% Base | 14.6% | 15.6% |
| ¥10,000 | 12.3% | 13.3% | 14.4% | 15.4% | 16.4% |
| ¥10,500 | 12.9% | 14.0% | 15.1% | 16.2% | 17.2% |
The existing-stock conversion holds an 11.4% yield even when ADR and occupancy deteriorate simultaneously, showing strong downside resilience. Initial investment coming in at roughly 40% of a new build is what drives that directly.
Three variables warrant attention. First, the risk of the decommissioning schedule being revised. Experts have questioned the feasibility of the 2051 completion target; if the schedule extends, the demand period lengthens, though worker numbers will rise and fall by work phase. Second, a shift from contracted to distributed inventory. Some 2,169 rooms currently operate on a contract-centered basis, and if corporate contracts contract, part of that could flow into the general distribution market and loosen supply-demand in the low-rate band. Put the other way, positioning in a separate price band is less exposed to this variable than entering at the low end. Third, demographics. The 2040 projection for the target meshes is 26.8% below 2020, which changes the premise for any business model whose main customers are local residents. All three demand layers originate outside the area, and how that is built into the design will be the dividing line.
Conclusion — How to Fill the Thin Core
In core Hamadori’s lodging market, the sources of demand (the power station, F-REI, and the memorial facilities) and the center of gravity of supply (Hirono, Naraha, Tomioka) are geographically misaligned. Futaba, Okuma, and Namie together hold 684 rooms — just 15% of Futaba District — leaving the area nearest the demand the thinnest. That layout stems from the differing timing of evacuation-order lifting and from the fact that development ran ahead on the southern side before those lifts, and it will not correct itself through market forces alone.
The land market, however, has already begun to respond. That Namie’s land prices were alone in Futaba District in turning positive can be read as the market pricing in a concrete siting decision in F-REI. Tomioka’s 19.5% office-sector employment share and Okawara’s 86.5% working-age share likewise support the view that Hamadori is steadily taking shape as a place to work.
From an investment standpoint, the target is a repositioning of price bands. The band below ¥8,000 concentrates 83% of distributed inventory and is already functioning. The headroom lies one step above, in the ¥10,000-¥16,000 business and research stay band, where only 2 facilities exist today. Acquiring and renovating the young stock built between 2016 and 2020 and moving it into that band wins on capital efficiency in the model as well. With the new-supply pipeline thin, now is precisely the moment when there is the most room to raise the value of existing stock.
Note on data handling: The room and facility counts in this article are aggregated from facilities whose operation could be confirmed on OTAs within the scope tracked by MetroEngines Research, and do not constitute a complete census. Ryokan, minshuku, and simple lodging houses not listed on OTAs, as well as company dormitories and temporary accommodation, are excluded. Estimated settled ADR is an estimate based on published prices and differs from each facility’s actual transacted rates or accounting figures. Building-plan data is based on confirmation applications as of the survey date, and project and room counts are expected to increase as further applications are filed.
Related Reading
- Dual-Growth Mesh 2040: 17 Prime Hotel Development Sites in Japan
- Construction +41% & Labor Crunch Erase Japan’s 2027-2029 Hotel Supply
- Nankai Trough 80% Era: Pacific Coast Hotel Investment — Disaster Risk x ADR x Risk-Adjusted Yield
- Hotel vs Condo Land Rivalry: ADR-Implied Feasible Land Price Map
- Wakura Onsen Noto Recovery Hotel Investment 2026: Hokuriku Polarization Deep Dive
- Exit Risk Prefecture Map: Tohoku & Chugoku Mid-Size Ryokans Face H2 2026 Loan Pressure
- Regional Bank-Led Small-Scale Continuous Hotel Funds — Capital Supply vs. Large REIT Acquisitions
- All articles in Investment & Development
- All articles in Market Trends
- All articles in Area & Property Analysis
References and Sources
Data sources
Supply and price = estimated settled rates derived by MetroEngines Research & Consulting from OTA published prices, plus facility and room count aggregation (8 Futaba District municipalities, N=63 facilities and 4,434 rooms; price observation N=27 facilities and 2,265 rooms; July 2025-June 2026). Land prices, building regulations, and disaster hazard zones = MLIT Real Estate Information Library (Published Land Prices, as of January 1, 2025). Resident population = MLIT National Land Numerical Information (projected population by 250 m mesh, FY2024 NIPSSR-based estimate, 2020 Census basis). Employment = Economic Census for Business Activity, Ministry of Internal Affairs and Communications and Ministry of Economy, Trade and Industry (2021). Supply pipeline = MLIT Building Activity Statistics Survey (confirmation-application basis); construction costs = Construction Starts Statistics (2025 actuals).
Model assumptions
Development scenario earnings are calculated with the simple formulas “annual revenue = rooms x 365 days x assumed occupancy (full-year basis) x assumed ADR (tax-exclusive equivalent),” “GOP = annual revenue x GOP margin,” and “investment yield = GOP ÷ total investment.” All occupancy figures are on a full-year basis (assumptions informed by actual conditions from July 2025 to June 2026). Scenario A = 100 rooms, ADR ¥7,000, occupancy 78% (full-year basis, referencing actual conditions from July 2025 to June 2026), GOP margin 50%, total investment ¥1.66bn; Scenario B = 80 rooms, ADR ¥9,500, occupancy 70% (full-year basis, same reference), GOP margin 45%, total investment ¥640M; Scenario C = 60 rooms, ADR ¥18,000, occupancy 60% (full-year basis, same reference), GOP margin 30%, total investment ¥2.67bn. Construction inflation applies +7.2% for the 2028 opening case, based on the Turner & Townsend forecast (+5.3% in 2026, +5.0% in 2027). The two-axis sensitivity table is an arithmetic expansion of the Scenario B assumptions above across ADR ¥8,500-¥10,500 and occupancy 60-80%, and contains no new measured values. Interest, taxes, depreciation, FF&E replacement costs, and pre-opening expenses are excluded from the model.
Limitations and caveats
Facility and room counts are aggregated from facilities whose operation could be confirmed on OTAs and do not constitute a complete census; ryokan, minshuku, and simple lodging houses not listed on OTAs, along with company dormitories and temporary accommodation, are excluded. Estimated settled ADR is an estimate derived from published prices and differs from each facility’s actual transacted rates or accounting figures. Among the municipality-level ADRs, Futaba, Okuma, and Naraha cover only 1-2 facilities each, so a single property’s movement can swing the area figure substantially. Employment data is as of 2021 and does not reflect employees at research hubs and industrial parks opened since. The supply pipeline is on a confirmation-application basis, so projects opening from 2028 onward include unfiled cases and must be read as a floor. The investment model is simplified; an actual investment decision requires a project-specific feasibility study.
Market data
- MetroEngines Research & Consulting — Estimated settled ADR based on OTA published prices, plus facility and room count aggregation (Futaba District N=63 facilities; price observation N=27 facilities)
Government statistics and public data
- MLIT Real Estate Information Library — Published Land Prices (2025), disaster hazard zones, station passenger counts
- MLIT National Land Numerical Information — Projected population by 250 m mesh (FY2024 NIPSSR-based estimate)
- Ministry of Internal Affairs and Communications and Ministry of Economy, Trade and Industry, “Economic Census for Business Activity” (2021) / boundaries = 2020 Census small areas (e-Stat Statistical GIS)
- MLIT, “Building Activity Statistics Survey” (building plan data)
- MLIT, “Construction Starts Statistics” (2025 actual construction costs for hotel use)
- Ministry of the Environment, “Progress on Specified Reconstruction and Revitalization Base Areas and Specified Return and Residence Areas (April 7, 2026)”
- Ministry of Economy, Trade and Industry, “Notices on Evacuation Orders to Date”
- Ministry of Economy, Trade and Industry, “About the Fukushima Innovation Coast Framework”
- Fukushima Prefecture, “Fukushima Industrial Reconstruction Corporate Siting Subsidy” / Fukushima Innovation Coast Framework Promotion Organization, “Support Programs”
Corporate and research institution disclosures
- Fukushima Institute for Research, Education and Innovation (F-REI), “Facility Development Status” / “Organization Information”
- Namie Town, “Recent Developments at the Fukushima Institute for Research, Education and Innovation (F-REI)”
- Tokyo Electric Power Company Holdings, “Roadmap Toward Decommissioning” / “Status of Each Fukushima Daiichi Unit”
- Daiwa LifeNext, “Retreat-Format Hotel ‘FUTATABI FUTABA FUKUSHIMA’ Opens in Futaba, Fukushima” (2026)
- Great East Japan Earthquake and Nuclear Disaster Memorial Museum official site
Press coverage
- Fukushima Minyu Shimbun, “Futaba Memorial Museum Draws 92,601 Visitors in FY2025, Second-Highest on Record” (April 18, 2026)
- Fukushima Minpo, “First Evacuation Lifting Policy for Specified Return and Residence Areas: Three Districts in Futaba, Fukushima, Within FY2026”
- Fukushima TV, “‘There Is No Need to Lower the 2051 Flag’: The Chief Officer on 15 Years Toward Completing Decommissioning” (reported March 2026; the online article is no longer available)
- Nagasaki University, “Great East Japan Earthquake and Nuclear Disaster Memorial Museum Reaches 400,000 Visitors” (August 2025)