

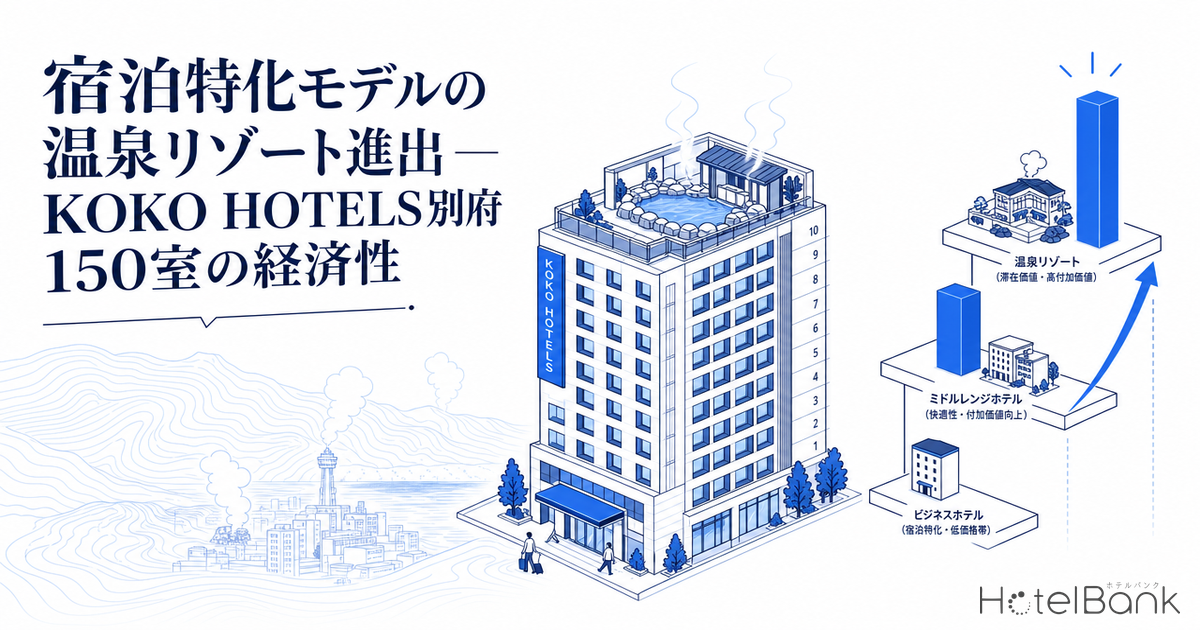
An operating platform that has consolidated limited-service business hotels nationwide is stepping into the onsen-resort tier. KOKO HOTELS (operated by Polaris Holdings, TSE Standard 3010) is a flagship of the limited-service consolidation model, running 76 hotels and 10,810 rooms as of the end of October 2025. As the first property under its new brand “kokonoyu,” that platform broke ground in November 2025 on a hotel a 3-minute walk from the west exit of Beppu Station — 150 rooms, with a natural hot-spring public bath and open-air bath on the 10th-floor rooftop — targeting a summer 2027 opening (developers: Tokyo Tatemono and Misawa Homes; operator: Fino Hotels). This article quantifies the ADR hierarchy between the limited-service tier and the onsen-resort tier using public pricing data for Beppu, and reads the per-room capex, the upside in average spend, and the management-fee structure of this onsen-resort expansion from an investor’s viewpoint.
Metric Definitions Used in This Article
- ADR (average daily rate): The average of published selling prices on OTAs and similar channels. This differs from actual transaction prices. Per-room rate for double occupancy (tax included), averaged across all plans (from room-only to meal-inclusive plans).
- Per-room capex: Construction investment per guest room. A reference figure estimated as total floor area × construction cost per tsubo ÷ number of rooms.
- Data sources: MetroEngine Research & Consulting; the Ministry of Land, Infrastructure, Transport and Tourism “Building Construction Starts Statistics”; company press releases.
To state the conclusion up front: in Beppu there is roughly a 2.5× price gap between the limited-service tier (business-hotel ADR of about ¥15,300) and the onsen-resort tier (a weighted average of about ¥38,000 for resort hotels and ryokan). kokonoyu Beppu is designed to occupy the middle ground between these two tiers — a “limited-service consolidation model equipped with an onsen experience.” It preserves the construction efficiency of the limited-service format (about 50 m² of gross floor area per room) while structurally moving toward the average-spend range of the onsen-resort tier. This is where the upside worth watching lies, from the perspective of operator growth combined with development.
- — There is a roughly 2.5× price gap between Beppu’s limited-service tier (business-hotel ADR ~¥15,300 / N=21) and its onsen-resort tier (resort + ryokan ~¥38,000).
- — kokonoyu Beppu holds limited-service efficiency at ~49.8 m² of gross floor area per room while keeping per-room capex to ~¥41M (inflation-adjusted) — clearly below the per-tsubo cost of building a new ryokan.
- — In the average-spend scenarios, ADR ¥22,000 at 80% occupancy yields room revenue of ¥960M/year, and approaching the resort tier (ADR ¥28,000) reaches roughly ¥1.23B/year.
- — Beppu has deep underlying demand — year-round occupancy in the 70s (%), seasonal peaks in the 80s, and foreign visitors up +60.5% (2024) — a market where the stable occupancy of limited-service and the high spend of onsen can coexist.
- — The split between development/ownership (Tokyo Tatemono, Misawa Homes) and operations (Fino Hotels / Polaris) creates a structure where performance-linked fees channel higher average spend directly into operator growth.
Beppu’s ADR Hierarchy — The Gap Between the Limited-Service and Onsen-Resort Tiers
First, let us organize Beppu’s ADR by category from public pricing data. The category-level ADR for Beppu compiled by MetroEngine Research as of April 2026 (double occupancy, all-plan average, tax included) reveals a clear tiered structure. At the bottom, guesthouses and minshuku sit around ¥11,000, followed by business hotels at ¥15,300 (N=21), hostels at ¥18,800, and city hotels at ¥23,100; entering the onsen-resort tier, the figures jump to ¥38,000 for resort hotels (N=16), ¥39,300 for ryokan (N=77), and ¥50,900 for cottages (N=3).
What stands out is the size of the leap from the business-hotel tier (¥15,300) to the ryokan/resort tier (the ¥38,000 range). Within the same onsen destination of Beppu, whether the offering takes the form of a business hotel or an onsen resort widens the published price by roughly 2.5×. Seen from a limited-service operating platform, this tiered gap means the potential to “raise the average-spend range with the same consolidated operating know-how, simply by building the onsen value-add into the physical property.” kokonoyu Beppu’s design — placing a natural hot-spring public bath with open-air bath on the 10th-floor rooftop and a breakfast restaurant on the second floor — is precisely a structure built to capture this upside in spend.
Beppu’s Overall ADR Momentum — The Underlying Strength of Onsen Demand
Next, let us examine Beppu’s overall ADR trend using a year-over-year overlay. Beppu’s ADR shows clear seasonality, forming peaks in summer (July–August) and autumn (September–December). In August 2025 it rose to ¥32,800, and in April 2026 it stood at ¥29,100 (+5.8% year-on-year, N=77), running above the prior-year level. The recovery in inbound demand underpins this strength: Beppu’s foreign visitors reached 452,000 in 2024 (+60.5% year-on-year) and tourism spending surged to ¥11.34 billion (+68.1%).
Beppu’s occupancy is said to run in the 70s (%) year-round and reach the 80s during the tourist season, with inbound guests accounting for more than 40%. In other words, Beppu is a rare market where the stable occupancy of the limited-service format and the high spend of an onsen resort can coexist. Near-distance East Asian visitors are abundant — South Korea (149,000), Hong Kong (92,000), China (53,000), and Taiwan (51,000) — and the highly accessible location at Beppu Station’s west exit is well suited to capturing this segment.
Location Analysis — 3-Minute Walk from Beppu Station West Exit, a Station Catchment of ~10,000 People/Day
| Beppu Station daily avg. boardings/alightings | ~10,000 people |
| Station-area posted land price | ~¥67,600/m² |
| Beppu annual visitors (2024) | 7.076M |
| of which overnight guests | 2.565M |
| Occupancy (city avg., year-round) | 70s (%) |
Beppu Station has an average of about 10,000 boardings and alightings per day, and the station-area posted land price is around ¥67,600/m² — the highest in Beppu. Against a deep demand base of 7.076 million visitors and 2.565 million overnight guests, a location a 3-minute walk from the station west exit can capture both inbound travelers and domestic individual guests arriving by rail. Whereas ryokan and cottages in the onsen-resort tier are often located in the suburbs or on hillsides, a limited-service property with an onsen public bath located right by the station can take a position distinct from existing supply by offering locational convenience and an onsen experience at the same time.
Per-Room Capex Estimate — Building an Onsen Resort with Limited-Service Construction Efficiency
Dividing kokonoyu Beppu’s gross floor area of about 7,475 m² (about 2,261 tsubo) by 150 rooms gives about 49.8 m² (about 15.1 tsubo) of gross floor area per room. This is an efficient allocation for an onsen resort — a figure where limited-service construction know-how pays off. For construction cost per tsubo, we estimate based on the Ministry of Land, Infrastructure, Transport and Tourism’s “Building Construction Starts Statistics,” treating the property as a middle-to-upper-middle tier equipped with a rooftop natural hot-spring public bath and a breakfast restaurant. Below is a two-stage capex estimate.
| Estimate stage | Cost/tsubo | Total construction cost | Per-room capex | vs. standard business hotel |
|---|---|---|---|---|
| Stage 1: Middle-tier low end (2025 actuals basis) | ¥2.40M/tsubo | ~¥5.43B | ~¥36.2M | ~1.27× |
| Stage 1: Upper-middle (2025 actuals basis) | ¥2.60M/tsubo | ~¥5.88B | ~¥39.2M | ~1.37× |
| Stage 2: Inflation-adjusted (+5% annual compounding over the construction period) | ¥2.73M/tsubo → | ~¥6.17B | ~¥41.1M | ~1.44× |
Compared with a standard limited-service business hotel (about 13 tsubo GFA per room at ¥2.20M/tsubo, giving per-room capex of about ¥28.6M), kokonoyu Beppu’s per-room capex is estimated at about 1.4× (~¥41M) on an inflation-adjusted basis, owing to the added onsen infrastructure (rooftop public bath, hot-water supply equipment) and the larger room area. What matters is that this is clearly lower than the per-tsubo cost of building a new ryokan. Capturing onsen-resort-tier average spend while holding construction cost to an efficiency close to that of a limited-service hotel — this differential is the very source of the economic rationale for a limited-service consolidation model expanding into the onsen tier. It is also worth noting that recent surges in construction costs tend to suppress new supply overall, which can act as an upside factor by easing competition with existing supply. In this construction-cost surge, the break-even between new builds and renovations is also shifting.
Average-Spend Upside Scenarios — Room to Capture the Middle Ground Between the Two Tiers
We estimate kokonoyu Beppu’s revenue potential by overlaying it on Beppu’s actual ADR hierarchy. Rather than the room-only focus of a limited-service hotel, incorporating a rooftop onsen public bath, a breakfast restaurant, and experiences that make use of local ingredients creates room to lift average spend from the business-hotel tier (¥15,300) as a starting point, through the city-hotel tier (¥23,100), toward the resort-hotel tier (¥38,000). Below is the sensitivity of room revenue under three average-spend scenarios.
| Scenario | Assumed ADR | OCC 75% | OCC 80% | Position |
|---|---|---|---|---|
| A. Limited-service baseline | ¥18,000 | ¥740M | ¥790M | Hostel–city tier |
| B. Onsen-equipped consolidation assumed range | ¥22,000 | ¥900M | ¥960M | Near city-wide ADR |
| C. Resort upside | ¥28,000 | ¥1.15B | ¥1.23B | Approaching resort tier |
Under Scenario B (ADR ¥22,000, near the city-wide ADR) at 80% occupancy, room revenue is on the order of ¥960M per year; if it rises to Scenario C (approaching the resort tier), it reaches roughly ¥1.2B per year. Against total construction cost of about ¥6.17B (inflation-adjusted), room revenue running in the ¥900M–1.2B range, plus ancillary revenue from the onsen, breakfast, and retail, points to the potential for the onsen value-add to lift the standard limited-service yield. The closer average spend moves from the city average toward the resort tier, the more the efficient capex structure of 50 m² of gross floor area per room works as leverage on yield. For a view that back-calculates onsen-destination properties from ADR × OCC × target yield, our analysis reverse-engineering the buyout ceiling for onsen ryokan is also a useful reference.
Management-Fee Structure — A Division of Labor Between Owner Capital and Operator Growth
kokonoyu Beppu’s scheme illustrates the typical division of roles in the limited-service consolidation model. Tokyo Tatemono and Misawa Homes handle development and ownership, while Fino Hotels, a Polaris subsidiary, handles operations. Polaris Holdings’ hotel operating business combines three contract forms — management contracts (MC), lease agreements, and leasing — and its management fees are performance-linked, structured to align the incentives of operator and owner.
Owner side (Tokyo Tatemono, Misawa Homes)
Holds development investment on the order of ¥6.2 billion, enjoying the asset value of the land and building plus lease-in income. Even amid rising construction costs, the scarcity of a station-adjacent, onsen-equipped property supports the asset’s competitiveness.
Operator side (Fino Hotels / Polaris)
Provides operating know-how and brand on an asset-light basis. With performance-linked fees, higher average spend translates directly into fee growth. The purchasing, staffing, and OTA operating capabilities honed across 76 hotels of consolidated operations are extended horizontally into the onsen tier.
Direction of growth
kokonoyu is the first property under a new brand. Adding an onsen-resort tier to the four sub-brands — Standard / Premier / STAY / Residence — expands the platform’s spend range and its scope for new openings.
The key point of this division of labor is that the operator can advance into the higher-spend tier without bearing large capex. Bringing the consolidated operating know-how refined in the limited-service format — standardized operations, OTA sales capabilities, efficient staff allocation — into the onsen-resort tier lets performance-linked fees grow by capturing the upside in average spend. For the owner side, too, per-room capex of about ¥41M is clearly lower than building a new ryokan, and the scarcity of a station-adjacent, onsen-equipped property secures asset competitiveness amid rising construction costs. The potential of this scheme lies precisely in the way both parties’ incentives align toward higher average spend. Notably, the same Misawa Homes × Polaris structure is also advancing a new “KOKO HOTEL” in Naha, with a 2027 opening planned in Maejima, Naha.
Oita’s Supply Environment — Reading the Pipeline in Context
Let us place kokonoyu Beppu’s positioning in context against Oita Prefecture’s overall supply pipeline. Within the scope tracked by MetroEngine Research (based on confirmed OTA listings), nationwide new openings in 2026 total 807 properties (33 rooms on average), and Oita does not rank among the top 15 prefectures. This suggests that existing supply is thick in onsen destinations such as Beppu and Yufuin, and that new large-scale supply is relatively limited. At the same time, a large project like kokonoyu Beppu — 150 rooms, onsen-equipped, station-adjacent — can take a clearly differentiated position within such a mature market.
*New-opening data is based on confirmed OTA listings, and because listings appear several months before opening, the months from the second half of 2026 onward may increase with future listings. Supply from 2027 onward cannot be stated definitively and should be treated as an observed value at the current point in time. kokonoyu Beppu (planned to open in summer 2027) is a confirmed pipeline project with construction already underway, and is not yet reflected in the confirmed-OTA-listing tally above.
Note on the estimates in this article: The figures in this article for per-room capex, room revenue, and yield are simplified estimates based on the publicly disclosed gross floor area and room count, the construction cost per tsubo from the MLIT “Building Construction Starts Statistics,” and Beppu’s actual ADR hierarchy. Actual construction costs, operating conditions, average spend, and occupancy will vary with the operator’s management policy and market conditions, and these estimates do not guarantee any investment outcome. Actual investment consideration requires a detailed feasibility study.
Conclusion — The Potential of the Limited-Service Consolidation Model’s Onsen-Resort Expansion
Beppu’s public pricing data clearly shows a roughly 2.5× price gap between the limited-service tier (business-hotel ADR of about ¥15,300) and the onsen-resort tier (resort + ryokan of about ¥38,000). kokonoyu Beppu takes a position in the middle ground between these two tiers — “station-adjacent × onsen-equipped × limited-service consolidated operations” — holding per-room capex to about ¥41M (inflation-adjusted) through efficient construction of about 50 m² of gross floor area per room, while retaining room to lift average spend from near the city-average ADR toward the resort tier.
From the standpoint of operator growth, the performance-linked management-fee structure channels higher average spend directly into fee growth. If the consolidated operating know-how refined across 76 hotels and 10,810 rooms can be extended horizontally into the onsen-resort tier, the platform’s spend range and its scope for new openings will expand. Beppu — a mature onsen market combining year-round occupancy in the 70s (%), seasonal peaks in the 80s, and a surge in inbound demand (foreign visitors +60.5%) — is a reasonable choice as the first site to test this expansion model. For hotel investors, PE firms, regional banks, and operators, a limited-service consolidation model’s move into the onsen-resort tier merits attention as a case study demonstrating the potential of a new development format that reconciles construction efficiency with high average spend.
Further Reading
References & Sources
■ Data Sources
Beppu’s category-level ADR and monthly ADR trend are from MetroEngine Research & Consulting’s tally of OTA public pricing data (double occupancy, all-plan average, tax included, as of April 2026). New-opening data is based on confirmed OTA listings (2026, N=807 properties). Construction cost per tsubo is based on the MLIT “Building Construction Starts Statistics,” and location and tourism indicators are based on the Beppu Tourism Statistics Handbook and JR Kyushu’s station-level boarding figures.
■ Estimate Assumptions
Per-room capex = gross floor area (about 2,261 tsubo) × construction cost per tsubo ÷ 150 rooms. Cost per tsubo is in two stages: Stage 1 (¥2.40M–2.60M / 2025 actuals basis) and Stage 2 (inflation-adjusted at +5% annual compounding up to the midpoint between the November 2025 groundbreaking and the May 2027 completion, ¥2.73M). Room revenue = 150 rooms × assumed ADR × OCC × 365 days. The assumed ADRs (¥18,000 / ¥22,000 / ¥28,000) are three scenarios based on Beppu’s actual ADR hierarchy, with OCC assumed at the city-average range of 75% / 80%.
■ Limitations & Caveats
ADR is the average of OTA published prices and differs from actual transaction prices. Per-room capex, room revenue, and yield are simplified estimates based on the publicly disclosed gross floor area and room count and the cost-per-tsubo basis; actual construction costs, operating conditions, average spend, and occupancy will vary with the operator’s management policy and market conditions. These estimates do not guarantee any investment outcome, and actual investment consideration requires a detailed feasibility study.
■ Market Data
- MetroEngine Research & Consulting — Beppu category-level ADR and monthly ADR trend (OTA public pricing data, double occupancy, all-plan average, tax included); nationwide new-opening data (based on confirmed OTA listings, 2026, N=807 properties)
■ Government Statistics & Public Data
- e-Stat “Building Construction Starts Statistics” (basis for construction cost per tsubo)
- Beppu City “2024 Beppu Tourism Statistics Handbook”
- JR Kyushu “Station-Level Boarding Figures”
■ News & Press Releases
- Tokyo Tatemono “Groundbreaking on the natural hot-spring hotel ‘kokonoyu Beppu’ — the first property under KOKO HOTELS’ new brand, planned to open in summer 2027” (November 2025)
- Tokyo Tatemono news release (November 13, 2025)
- Travel Watch “‘kokonoyu Beppu’ to open in summer 2027”
- Polaris Holdings Inc. (securities code 3010) official site / IR information
- KOKO HOTELS official site