

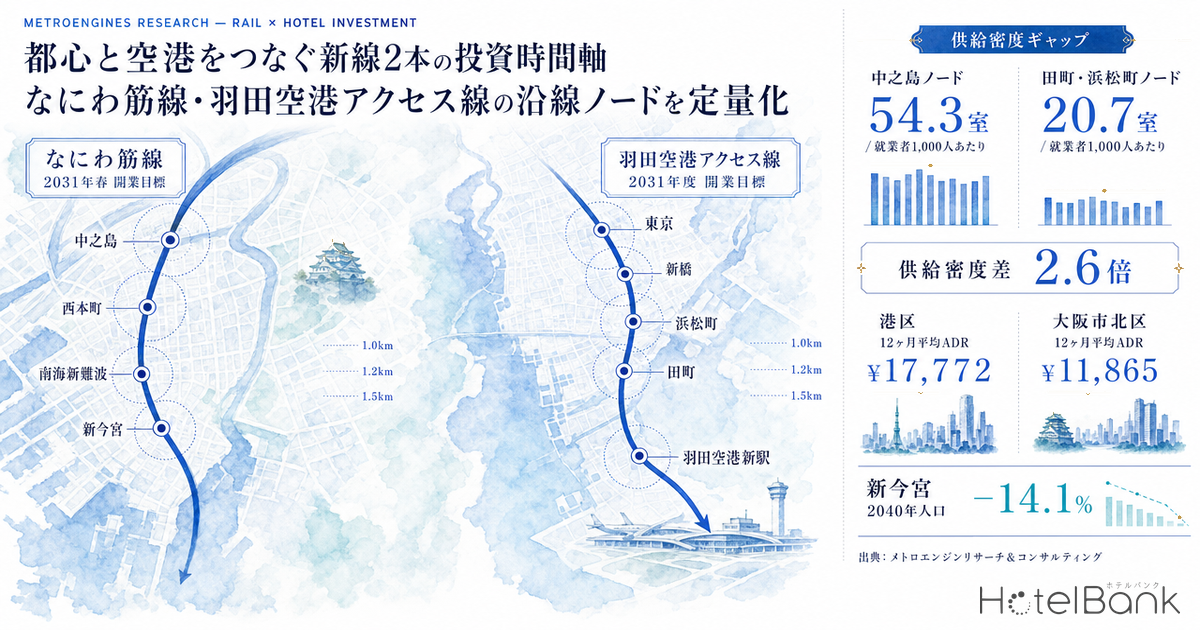
A new railway line is one of the hardest variables to handle in a hotel investment decision. The effect only materialises about ten years after construction starts, and in the meantime acquisition prices, construction costs and interest rates all move. Infrastructure renewal is nonetheless built into the investment time horizon, because once an opening date is fixed, demand flows are rewritten irreversibly.
This article takes two “intra-urban” lines that connect an existing city centre with an airport — the Naniwasuji Line in Osaka and the Haneda Airport Access Line in Tokyo — and quantifies, side by side, the current rate levels, employment scale, supply density and future population of the nodes along each corridor. We do not assert what the opening effect itself will be. Instead we present the leading indicators investors can observe before opening, and the difference in demand segments that could be captured afterwards, as a sensitivity range.
Metric Definitions Used in This Article
- ADR (average daily rate): an estimated settled rate (tax-exclusive equivalent) derived by applying a segment-specific adjustment coefficient to the lowest publicly listed plan level on OTAs (double occupancy, per-room rate, tax-included). Cross-checked against property-level disclosures by listed hotel REITs, the median error is roughly 7%. It is an estimate and differs from each property’s actual transacted rates or accounting figures. Area-level ADR is the median of the properties covered (the level of a typical property in that area).
- Listed price: the average across all plans on OTAs (double occupancy, per-room rate, tax-included). Because its basis differs from ADR, the two are labelled distinctly throughout this article.
- Employment data (establishments, workers, office-sector share): aggregated within a 1,000 m radius of each node’s centre point. Source: Ministry of Internal Affairs and Communications / Ministry of Economy, Trade and Industry, “Economic Census for Business Activity (2021)”; boundaries from the 2020 Population Census small-area units.
- Future population: 250 m mesh aggregation within a 1,500 m radius of each node’s centre point. Source: Ministry of Land, Infrastructure, Transport and Tourism, National Land Numerical Information (projected population by 250 m mesh). This is resident population — it does not represent daytime or through traffic.
- Data source: MetroEngines Research & Consulting
- — The two lines are different kinds of investment event. The Naniwasuji Line creates three new stations; the Haneda Airport Access Line adds no intermediate stations and only shortens travel time. The former opens up land-use conversion potential; the latter makes the repricing of existing stock the main battleground.
- — Tamachi–Hamamatsucho has 20.7 rooms per 1,000 workers, or 38% of Nakanoshima’s 54.3. Against 227,995 workers and a 35.9% office-sector share, hotel inventory is just 4,729 rooms — leaving room to enter.
- — The three Osaka-side wards converge on an estimated settled ADR of ¥11,300–¥12,100 (12-month average, August 2025–July 2026). The arrival of new stations could be the first thing to break that convergence.
- — Acquisition price per room runs ¥42–76 million on the Tokyo side and ¥13–30 million on the Osaka side. Because acquisition years are spread across 1996–2025, it is safer to reference only deals from the past three years.
- — Even ADR +10% combined with occupancy +3pt lifts room revenue by only +14.0% (200 rooms, room revenue only). As the Naniwasuji Line — whose project cost estimate roughly doubled — illustrates, the cost side can move by more than the revenue side.
Two lines, two different investment events — “new station creation” versus “reweighting existing nodes”
Start with the difference in character between the two projects. That difference largely determines which assets along each corridor benefit from repricing.
The Naniwasuji Line is a roughly 7.2 km new line running from Osaka Station (the Umekita underground station) to JR Namba Station and Nankai Shin-Imamiya Station, with three new stations along the way: the provisionally named Nakanoshima, Nishi-Hommachi and Nankai Shin-Namba stations. The developer is Kansai Rapid Railway, a third-sector company funded by Osaka Prefecture and Osaka City together with JR West and Nankai Electric Railway, operating on a vertical-separation model that splits infrastructure ownership from passenger operations. The target opening is spring 2031.
The Haneda Airport Access Line (Higashi-Yamate route), by contrast, branches from Tokyo Station toward the existing Tokaido freight line near Tamachi Station and runs to a new station at Haneda Airport. JR East states that it is not currently studying intermediate stations, so this line creates almost no new stations. What changes instead is the relative weight of existing nodes — Tokyo, Shimbashi, Hamamatsucho, Tamachi — once they are directly connected to the airport.
Put differently, the Naniwasuji Line creates new nodes in blocks that had no station at all, while the Haneda Airport Access Line only shortens travel time in blocks that are already densely developed. In the first case the land-use conversion potential itself can be the investment target; in the second, repricing of existing stock is the main battleground. Conflating the two makes it easy to misjudge whether an acquisition cost is justified.
| Item | Naniwasuji Line | Haneda Airport Access Line (Higashi-Yamate route) |
|---|---|---|
| Target opening | Spring 2031 (Osaka Prefecture / Osaka City announcement; unchanged as of April 2026) | FY2031 = fiscal year ending March 2032 (JR East FY03/2026 results and FY03/2027 management strategy briefing materials; verified 2026-08-08) |
| Developer | Kansai Rapid Railway (funded by Osaka Prefecture/City, JR West and Nankai); vertical-separation model | East Japan Railway Company (JR East) |
| Alignment / length | Osaka Station (Umekita underground station) – JR Namba Station / Nankai Shin-Imamiya Station, approx. 7.2 km | Tokyo Station – new Haneda Airport station, approx. 12.4 km (branching near Tamachi Station) |
| New stations | 3 stations: provisionally named Nakanoshima / Nishi-Hommachi / Nankai Shin-Namba | New Haneda Airport station only. Intermediate stations are not currently under study. |
| Total project cost | Originally approx. ¥330 billion → approx. ¥650 billion (Kansai Rapid Railway estimate, 28 April 2026; driven by inflation, removal of underground obstructions and ground treatment) | Originally approx. ¥300 billion → approx. ¥280 billion (cost reduction at the survey and design stage) |
| Investment structure | New-station creation — land-use conversion potential emerges | Reweighting of existing nodes — repricing of existing stock is the main battleground |
What stands out is that the cost trajectories run in opposite directions. The Naniwasuji Line has roughly doubled on inflation and underground obstruction countermeasures, while the Haneda Airport Access Line has been trimmed by about ¥20 billion through design-stage cost reduction. A cost increase does not automatically mean a delayed opening — Osaka Prefecture and City held the spring 2031 target as of April 2026 — but for investment purposes it is best not to abandon the premise that the opening year is a planning figure, not confirmed information. A pro forma pinned to a single opening year can see its internal rate of return shift materially on a one-year slip.
Where the corridor nodes stand today — a 1.5x estimated settled ADR gap between Osaka and Tokyo
Next, check the rate band each corridor node currently sits in. Before discussing an opening effect, you need to know the height of the base on which that effect would be layered.
Averaging estimated settled ADR by ward over the most recent 12 months (August 2025–July 2026, confirmed months only), Minato-ku on the Tokyo side is ¥17,800 versus ¥11,900 around Nakanoshima (Kita-ku) on the Osaka side — a gap of roughly 1.5x. Even along “a new line connecting a city centre with an airport,” the starting rate levels differ substantially.
| Node / ward | 12-month avg ADR | 2025/8 | 2026/7 | 2026/10 (projected) | N (properties) |
|---|---|---|---|---|---|
| Tamachi–Hamamatsucho node (Minato-ku, Tokyo) | ¥17,772 | ¥15,168 | ¥15,138 | ¥23,155 | 132 |
| Chuo-ku, Tokyo (reference) | ¥19,290 | ¥16,684 | ¥15,745 | ¥22,662 | 152 |
| Shinagawa-ku, Tokyo (reference) | ¥12,992 | ¥12,322 | ¥11,535 | ¥17,081 | 35 |
| Ota-ku, Tokyo (reference — Haneda side) | ¥12,264 | ¥10,810 | ¥10,642 | ¥15,224 | 58 |
| Nakanoshima node (Fukushima-ku, Osaka) | ¥13,667 | ¥16,864 | ¥12,881 | ¥14,990 | 6 |
| Nakanoshima node (Kita-ku, Osaka) | ¥11,865 | ¥14,610 | ¥9,796 | ¥11,819 | 74 |
| Nankai Shin-Namba node (Naniwa-ku, Osaka) | ¥12,059 | ¥15,070 | ¥9,606 | ¥11,723 | 53 |
| Nishi-Hommachi node (Nishi-ku, Osaka) | ¥11,284 | ¥15,077 | ¥8,894 | ¥11,671 | 28 |
| Chuo-ku, Osaka (reference) | ¥12,776 | ¥15,735 | ¥9,791 | ¥13,847 | 194 |
| Shin-Imamiya node (Nishinari-ku, Osaka) | ¥4,045 | ¥4,490 | ¥4,745 | ¥7,919 | 32 |
Three structural features emerge from this table. First, the Tokyo side is essentially flat between August 2025 and July 2026 (Minato-ku ¥15,168 → ¥15,138), whereas the Osaka side falls sharply over the same period (Kita-ku ¥14,610 → ¥9,796). Summer 2025 in Osaka was lifted by the Expo period, so the 2026 level is closer to an underlying, non-event figure. When modelling an opening effect, taking 2026 rather than 2025 as the baseline is the conservative choice — and separating the fading Expo premium from the underlying trend requires reading the monthly series rather than a single annual average.
Second, the three Osaka-side corridor wards (Kita-ku, Naniwa-ku, Nishi-ku) converge on a 12-month average of ¥11,300–¥12,100 — almost the same level. In the blocks where new stations will be built, virtually no rate differentiation exists today. Conversely, the arrival of new stations could be the first thing to break that convergence.
Third, the Shin-Imamiya node (Nishinari-ku) stands out at ¥4,045, roughly a third of the other wards. That figure cannot be explained by property quality alone; it reflects a segment mix weighted toward budget lodging houses and small-scale inns. From an investor’s standpoint, this level implies the possibility of a relatively low acquisition cost. The node already has Nankai Shin-Imamiya Station, the southern terminus of the Naniwasuji Line, so the new connection could add access value toward Kansai International Airport.
The supply density gap — Tamachi–Hamamatsucho has under 40% of Nakanoshima’s rooms per worker
Rate levels alone do not measure investment headroom. At the same rate, a location where supply is thin relative to the depth of demand absorbs an opening event very differently from one where supply is thick. Here we match employment scale within a 1,000 m radius of each node against hotel inventory within a 1.2 km radius.
The result is unambiguous. The Tamachi–Hamamatsucho node has 227,995 workers — 78% of Nakanoshima’s 290,936 — yet hotel inventory of only 4,729 rooms, 30% of Nakanoshima’s 15,788. Converted to rooms per 1,000 workers, Nakanoshima’s 54.3 compares with Tamachi–Hamamatsucho’s 20.7, a gap of roughly 2.6x. And the office-sector share of workers is higher in Tamachi–Hamamatsucho (35.9% versus 30.3%).
This gap does not prove that Tamachi–Hamamatsucho is undersupplied: many of the node’s users may simply stay in Shinagawa, Shimbashi or Ginza, outside walking distance. That said, if the Haneda Airport Access Line shortens travel time to the airport, this district strengthens its character as “the central-Tokyo office district closest to the airport.” Thin inventory in a location where business demand and airport transit demand overlap suggests that room to enter remains, whether through new development or conversion.
In addition, the Tamachi–Hamamatsucho node averages a modest 105 rooms per property, and 22 of its 45 properties have fewer than 50 rooms. Only three exceed 300 rooms. A supply structure in which large full-service formats are scarce is an environment where an operator able to exploit economies of scale can differentiate. Nakanoshima, by contrast, averages 195 rooms with 19 properties above 300 rooms — large-format dominated, and hard to enter on the same terms. In Nakanoshima, a realistic route is to differentiate on concept or room specification rather than scale.
Resident population in 2040 — how many people will live there ten years after opening
A new line’s effects run for ten or twenty years after opening. Investment decisions therefore need to build population dynamics beyond the opening date into the time horizon. We compared projected population for 2025 and 2040 using 250 m mesh aggregation within a 1,500 m radius of each node centre.
| Node | 2025 population | 2040 population | Change | Working-age share (2025) | Aging rate (2025) |
|---|---|---|---|---|---|
| Tamachi–Hamamatsucho node | 109,466 | 122,973 | +12.3% | 71.1% | 14.9% |
| Nakanoshima node | 98,650 | 104,150 | +5.6% | 72.2% | 15.3% |
| Umekita (north of Osaka Station) node | 88,831 | 91,777 | +3.3% | 73.5% | 16.6% |
| Shin-Imamiya node | 119,328 | 102,466 | −14.1% | 62.5% | 30.9% |
Here the nodes diverge in character. Tamachi–Hamamatsucho gains +12.3% in resident population to 2040 and has a high working-age share of 71.1%, largely because major redevelopment in the Shibaura and Kaigan areas is embedded in the projection. Improved airport access and rising resident population point in the same direction, so the demand case is comparatively solid. A companion analysis overlaying resident population and employment across the whole bay area on the same 250 m mesh projection is available in Tokyo Bay 2040: Dual-Growth Zones for Hotel Investment.
Nakanoshima (+5.6%) and Umekita (+3.3%) grow only modestly, but neither is in decline. Working-age shares of 72–74% mean both are assumed to retain their character as central business districts through 2040.
The Shin-Imamiya node, on the other hand, contracts by −14.1% to 2040, and its aging rate is already 30.9% in 2025 — nearly double the other nodes. This means it is a location where resident population cannot serve as the demand rationale. Any lodging-demand argument here must rest on through traffic instead: accessibility toward Kansai International Airport and proximity to Osaka’s Minami district. Strengthening exactly that through traffic is what the Naniwasuji Line delivers, so shrinking resident population and rising demand are not contradictory. From a staff-recruitment-catchment perspective, however, the decline in working-age population needs to be built into plans as an upside risk to operating costs.
Acquisition cost benchmarks — per-room acquisition prices disclosed by listed REITs along the corridors
Discussing investment headroom requires a reference point for what a property in the district actually costs. Listed hotel REITs disclose acquisition dates and prices property by property — one of the few public sources for gauging acquisition costs along a corridor. Below, disclosed properties located along or near the two lines are converted to acquisition price per room.
| Property | REIT owner | Rooms | Acquisition price | Per room | Acquired |
|---|---|---|---|---|---|
| Haneda Airport Access Line corridor / nearby (Minato-ku, Shinagawa-ku, Ota-ku, Tokyo) | |||||
| HOTEL MYSTAYS Hamamatsucho (ホテルマイステイズ浜松町) | Invincible | 105 | ¥7,959 mn | ¥75.8 mn | Mar 2016 |
| HOTEL MYSTAYS Premier Hamamatsucho (ホテルマイステイズプレミア浜松町) | Invincible | 120 | ¥8,000 mn | ¥66.7 mn | May 2017 |
| HOTEL MYSTAYS Gotanda Station (ホテルマイステイズ五反田駅前) | Invincible | 384 | ¥26,523 mn | ¥69.1 mn | Mar 2016 |
| HOTEL MYSTAYS Premier Omori (ホテルマイステイズプレミア大森) | Invincible | 232 | ¥9,781 mn | ¥42.2 mn | Oct 2017 |
| HOTEL MYSTAYS Haneda (ホテルマイステイズ羽田) | Invincible | 174 | ¥7,801 mn | ¥44.8 mn | Jul 2015 |
| Naniwasuji Line southern nodes / nearby (Osaka — Namba and Shinsaibashi area) | |||||
| Candeo Hotels Osaka Namba (カンデオホテルズ大阪なんば) | Japan Hotel REIT | 496 | ¥14,320 mn | ¥28.9 mn | May 2017 |
| Holiday Inn Osaka Namba (ホリデイ・イン大阪難波) | Japan Hotel REIT | 314 | ¥27,000 mn | ¥86.0 mn | Aug 2008 |
| Namba Oriental Hotel (なんばオリエンタルホテル) | Japan Hotel REIT | 267 | ¥15,000 mn | ¥56.2 mn | Mar 1996 |
| APA Hotel Namba-Kita Shinsaibashi-Ekimae (アパホテル〈なんば北心斎橋駅前〉) | Japan Hotel & Residential | 162 | ¥4,850 mn | ¥29.9 mn | Dec 2025 |
| APA Hotel Namba-Minami Daikokucho-Ekimae (アパホテル〈なんば南大国町駅前〉) | Japan Hotel & Residential | 118 | ¥1,581 mn | ¥13.4 mn | Dec 2024 |
| HOTEL MYSTAYS Premier Dojima (ホテルマイステイズプレミア堂島) | Invincible | 141 | ¥3,845 mn | ¥27.3 mn | Jul 2014 |
The contrast shows limited-service properties on the Osaka side clearing at ¥13–30 million per room, while comparable properties in Tokyo’s Minato-ku and Shinagawa-ku sit at ¥42–76 million — a 2–3x gap. The two most recent deals in particular, both by Japan Hotel & Residential REIT in the Namba area (acquired December 2024 and December 2025), came in at ¥13.4 million and ¥29.9 million per room, indicating that an acquisition-cost advantage still remains.
One caveat matters, though: these are amounts at the time of acquisition, and the acquisition years span nearly 30 years, from 1996 to 2025. Even within the same “Namba area,” Holiday Inn Osaka Namba, acquired in 2008, is ¥86.0 million per room — above the Tokyo side. Comparing across periods without aligning them makes it easy to misread a phase difference in the land price cycle as a difference in location. In practice, it is safer to reference only deals from the past three years.
The fact that the two Hamamatsucho properties (acquired 2016 and 2017) were secured at ¥66.7–75.8 million per room is a valuable reference point for how the area was valued before construction on the Haneda Airport Access Line began. In the 2026 published land prices, the average for Minato-ku, Tokyo rose 15.0% year on year and commercial land in Osaka’s Kita-ku rose 13.96% — both double-digit gains. We have entered a period in which acquisition-cost assumptions cannot be carried over from reference deals unchanged.
Don’t assert the opening effect — express it as a range
How much a new line will lift rates or occupancy cannot be pinned to a single number in advance. Five years remain until opening, and both supply and demand will move in the meantime. Rather than assert, we assume a 200-room asset and show, as a sensitivity, how room revenue changes when ADR and occupancy move. The baseline ADR is the Tamachi–Hamamatsucho node’s trailing 12-month average of ¥17,772; occupancy is set at 82% to match the most recent disclosure level from a listed hotel REIT (Invincible Investment Corporation, June 2026, 101 domestic hotels, 82.7%).
| Scenario | Assumed ADR | Assumed occupancy | Room revenue (annual) | vs baseline |
|---|---|---|---|---|
| Baseline (current level sustained) | ¥17,772 | 82% | ¥1,064 mn | — |
| ADR only +5% | ¥18,661 | 82% | ¥1,117 mn | +5.0% |
| ADR only +10% | ¥19,549 | 82% | ¥1,170 mn | +10.0% |
| Occupancy only +3pt | ¥17,772 | 85% | ¥1,103 mn | +3.7% |
| ADR +5% × occupancy +3pt | ¥18,661 | 85% | ¥1,158 mn | +8.8% |
| ADR +10% × occupancy +3pt | ¥19,549 | 85% | ¥1,213 mn | +14.0% |
| Assumed ADR \ assumed occupancy | 76% | 79% | 82% | 85% | 88% |
|---|---|---|---|---|---|
| ¥16,884 (-5%) | 937 -11.9% | 974 -8.5% | 1,011 -5.0% | 1,048 -1.5% | 1,085 +2.0% |
| ¥17,772 (baseline) | 986 -7.3% | 1,025 -3.7% | 1,064 +0.0% | 1,103 +3.7% | 1,142 +7.3% |
| ¥18,661 (+5%) | 1,035 -2.7% | 1,076 +1.2% | 1,117 +5.0% | 1,158 +8.8% | 1,199 +12.7% |
| ¥19,549 (+10%) | 1,085 +2.0% | 1,127 +6.0% | 1,170 +10.0% | 1,213 +14.0% | 1,256 +18.0% |
| ¥20,438 (+15%) | 1,134 +6.6% | 1,179 +10.8% | 1,223 +15.0% | 1,268 +19.2% | 1,313 +23.4% |
On two axes, room revenue exceeds +20% versus baseline only in the bottom-right corner where ADR +15% coincides with 88% occupancy. Swing the other way to ADR −5% and 76% occupancy and it sinks to roughly −12%. A pro forma that builds in the opening event can be judged on whether it falls inside this band of roughly ±15%.
On the sensitivity view, even capturing ADR +10% and occupancy +3pt simultaneously lifts room revenue by only +14.0%. When building a pro forma that incorporates the opening event, keeping that magnitude as the ceiling is realistic. Put the other way, a new line changes the investment decision only when acquisition cost or construction cost moves by a similar 10–15%. As the Naniwasuji Line — whose project cost roughly doubled — shows, it is entirely possible for the cost side to move more than the revenue side. For the ADR level at which a project clears when worked backwards from acquisition and construction costs, see Policy Rate 1.00%: Break-Even ADR Across Japan’s 8 Hotel Markets, which runs the calculation market by market.
One more distinction is worth holding onto: the two lines differ in how the opening effect is captured. Along the Naniwasuji Line, where new stations appear, the property attribute “walking minutes from the station” is itself rewritten between before and after opening. Around the new Nakanoshima, Nishi-Hommachi and Nankai Shin-Namba stations, blocks currently rated as far from a station will become a five-minute walk. That change in attributes can flow into ADR as a repricing of existing stock.
Along the Haneda Airport Access Line, by contrast, distance from the station does not change — only the time to the airport does. Tokyo Station to Haneda Airport is expected to fall from about 30 minutes today to about 18 minutes, a saving of roughly 12 minutes. Whether those 12 minutes convert into rate depends on the share of guests who are airport users. In a location like the Tamachi–Hamamatsucho node, with an office-sector worker share as high as 35.9%, business demand and airport transit demand overlap readily, so the conversion rate is likely to be relatively high. This is a hypothesis, however, and can only be verified by measurement after opening.
How to frame the investment time horizon
Tamachi–Hamamatsucho — thin supply density
4,729 hotel rooms against 227,995 workers and a 35.9% office-sector share. At 20.7 rooms per 1,000 workers, it sits at 38% of Nakanoshima. Population is projected to rise +12.3% by 2040. With only three large full-service properties, room to differentiate on scale remains.
Nakanoshima and Nishi-Hommachi — attribute change from new stations
Estimated settled ADR across the three corridor wards converges on ¥11,300–¥12,100, with almost no rate spread today. New stations rewrite the property attribute “walking minutes from the station.” Repricing of existing stock becomes the main battleground.
Shin-Imamiya — low acquisition cost and through demand
An estimated settled ADR of ¥4,045 reflects the share of budget lodging houses and small inns; 193 of 280 properties have fewer than 50 rooms. Resident population falls −14.1% by 2040, but the demand rationale belongs with through traffic. Recent deals price at ¥13–30 million per room.
The three nodes each demand a different investment hypothesis. Tamachi–Hamamatsucho starts from a present-tense fact — inventory is thin relative to the depth of demand — with the new line positioned as a tailwind reinforcing it. Nakanoshima and Nishi-Hommachi start from a future-tense fact — new stations will be built — making the five years to opening a period for securing land and preparing land-use conversion. For Shin-Imamiya, the present-tense advantage of low acquisition cost turns into the question of how far strengthened through traffic can be converted into rate.
Common to all three is that the opening year is a planning figure, not confirmed information. The Naniwasuji Line held its spring 2031 target even after its project cost estimate roughly doubled in April 2026, and construction on the Haneda Airport Access Line is progressing toward a FY2031 (fiscal year ending March 2032) target. Both are planning figures based on published materials, so an investment decision is best tested against multiple scenarios that allow ±1–2 years on the opening date.
On that basis, there are leading indicators observable without waiting for opening: estimated settled ADR at the corridor nodes, employment scale, supply density, and recent acquisition deals. Every figure shown here can be tracked at fixed intervals, and observing which indicator moves first as opening approaches allows the hypothesis to be validated in stages. Treating infrastructure renewal as a variable in the investment time horizon means not waiting for the opening date, but designing the five years before it as an observation period.
Conclusion
Building an intra-urban rail line into an investment time horizon starts by separating two cases: does the line create new stations, or does it merely change the weight of existing nodes? The Naniwasuji Line creates three new stations; the Haneda Airport Access Line adds no intermediate stations and only shortens travel time. In the first case land-use conversion potential is the battleground; in the second, repricing of existing stock.
Quantifying where things stand today, the thinness of supply density at the Tamachi–Hamamatsucho node (20.7 rooms per 1,000 workers, 38% of Nakanoshima) emerges as the clearest structural feature. On rate levels, the three Osaka-side corridor wards converge on ¥11,300–¥12,100, and the arrival of new stations could be the first thing to break that convergence. The Shin-Imamiya node sees resident population shrink −14.1% by 2040, yet recent deals at ¥13–30 million per room preserve its acquisition-cost advantage.
The opening effect itself cannot be asserted. Even capturing ADR +10% and occupancy +3pt together lifts room revenue by only +14.0%, and as the Naniwasuji Line’s roughly doubled project cost shows, the cost side may move by more. The task is to design for a range around the opening year and track leading indicators at fixed intervals.
⚠ Note on ADR for future dates: ADR figures for August 2026 onward in this article are estimates based on selling prices published on OTAs at the time of the survey, and will change as the check-in date approaches. Target opening years and total project costs for the new lines are planning figures published by each project operator, not confirmed values. Please check the latest published materials before making an investment decision.
Related Reading
- Hotel Development Capacity 2026: Zoning, FAR & Land Price in 5 Markets
- Policy Rate 1.00%: Break-Even ADR Across Japan’s 8 Hotel Markets
- Construction +41% & Labor Crunch Erase Japan’s 2027-2029 Hotel Supply
- Fukui’s 3 Hotel Clusters: 2.5x ADR Gap and the Upper-Mid Whitespace
- Tokyo Bay 2040: Dual-Growth Zones for Hotel Investment (+23.8%)
- Tokyo Station Supertall Luxury Hotel Pipeline: Tokyo-Shinagawa-Nagoya
References and Sources
■ Data sources
Estimated settled ADR is a monthly ward-level aggregation (August 2025–December 2026; confirmed months run through July 2026, with property counts noted in the tables above). Hotel inventory and room counts cover a 1.2 km radius from each node centre; REIT ownership comes from a master covering all 7 REITs and 302 domestic properties (synced as of 3 August 2026). Employment data is an Economic Census aggregation within a 1,000 m radius; future population is a 250 m mesh aggregation within a 1,500 m radius (Nakanoshima 99 meshes, Tamachi 94, Shin-Imamiya 106, Umekita 97).
■ Modelling assumptions
The sensitivity analysis is a simple calculation for 200 rooms over 365 days, room revenue only, excluding food and beverage, other revenue, operating expenses, taxes and seasonality. Baseline ADR is the Tamachi–Hamamatsucho node’s trailing 12-month average of ¥17,772; baseline occupancy of 82% (as of June 2026, on a listed hotel REIT disclosure basis) is set to match the most recent disclosure from a listed hotel REIT (Invincible Investment Corporation, June 2026, 101 domestic hotels, 82.7%). Acquisition price per room is simply acquisition price ÷ rooms, and all figures are amounts at the time of acquisition.
■ Limitations and caveats
Target opening years and total project costs are planning figures published by each project operator, not confirmed values. Estimated settled ADR is an estimate based on published selling prices; cross-checked against property-level disclosures by listed REITs, the median error is roughly 7%. Monthly values from August 2026 onward are projections based on listed levels at the time of the survey and will change. Note that Fukushima-ku has only N=6 properties and therefore swings widely. Future population is on a resident basis and excludes daytime and through population. This article does not estimate the opening effect of the new lines itself; the sensitivity analysis is a mechanical calculation of “if it were to move within that range.”
■ Market data
- MetroEngines Research & Consulting — estimated settled ADR (ward-level monthly, August 2025–December 2026), room-count master (properties and room counts within a 1.2 km radius), REIT ownership master (all 7 REITs, 302 domestic properties, synced as of 3 August 2026)
■ Government statistics and public data
- Ministry of Internal Affairs and Communications / Ministry of Economy, Trade and Industry, “Economic Census for Business Activity (2021)”; boundaries from the 2020 Population Census small-area units (e-Stat Statistical GIS) — establishments, workers, office-sector share
- MLIT National Land Numerical Information, “Projected population by 250 m mesh (R6 estimate)” — 2025 and 2040 projected population, age structure
- Osaka City, “About the Naniwasuji Line” (transport policy) (in Japanese)
■ Published materials from railway operators and developers
- West Japan Railway Company, “Toward the opening of the Naniwasuji Line” project page (in Japanese; verified 8 August 2026)
- East Japan Railway Company, “Briefing on FY03/2026 results and FY03/2027 management strategy” materials — Haneda Airport Access Line opening outlook (FY ending March 2032) and assumed investment (approx. ¥280 billion) (verified 8 August 2026)
- Naniwasuji Line (alignment, length and new stations) (in Japanese)
- Haneda Airport Access Line (route and length) (in Japanese)
■ REITs and real estate
- Invincible Investment Corporation portfolio list / June 2026 monthly operating results (101 domestic hotels), occupancy 82.7% (as of June 2026, 101 domestic hotels)
- Japan Hotel REIT Investment Corporation portfolio list
- Japan Hotel & Residential REIT Investment Corporation portfolio list (properties acquired December 2024 and December 2025)
- Published and benchmark land prices for Kita-ku, Osaka (2026) / 2026 published land prices: residential and commercial trends in Tokyo
■ News
- “Osaka’s new Naniwasuji Line: total project cost estimated to double to ¥650 billion” (Nikkei, 28 April 2026) (in Japanese)
- “Naniwasuji Line: Osaka Prefecture and City hold to ‘2031 opening’ amid uncertainty from doubled project cost” (Nikkei, 30 April 2026) (in Japanese)
- “JR’s Haneda Airport Access Line on track for FY2031 opening; project cost cut from ¥300 billion to ¥280 billion” (Norimono News) (in Japanese)
- “Haneda Airport Access Line to open in FY2031: JR East, 18 minutes from Tokyo Station” (Nikkei) (in Japanese)