

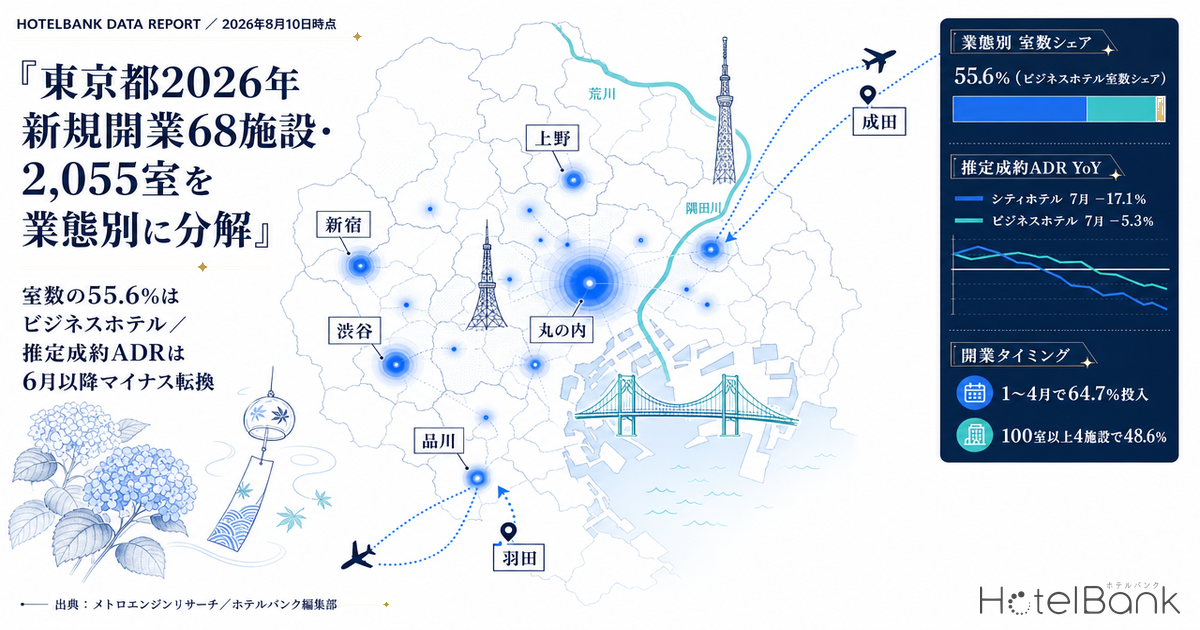
Tokyo has 68 lodging properties with a confirmed 2026 opening date, totalling 2,055 rooms. By property count, rental villas (20 properties) and hostels (19) lead the list — but the centre of gravity in room count sits somewhere else entirely. Business hotels account for 13 properties and 1,142 rooms (55.6% of the total), and city hotels for 2 properties and 316 rooms (15.4%). Together these two categories are only 22.1% of the property count, yet they hold 70.9% of the rooms. On the price side, meanwhile, Tokyo’s estimated settled ADR for business hotels was down 4.7% YoY in June 2026 and down 5.3% in July, while city hotels were down 12.8% in June and 17.1% in July — a sign reversal from the positive trend of the first half. Before jumping to a direct link between added supply and softening rates, we first break the question down on a room-count basis: which price band received how many rooms, and when.
Scope: properties opening in Tokyo in 2026, N=68 properties (2,055 rooms). Estimated settled ADR covers Tokyo business hotels N=902–924 properties and city hotels N=105–108 properties. Estimated OCC and booking curves cover Tokyo business hotels N=808–873 properties and city hotels N=98–100 properties. Price figures in this article are estimated settled ADR (the transaction price level estimated from OTA and other sales data, on a pre-tax-equivalent basis); occupancy is an estimate based on OTA-listed inventory. Definitions for both appear at the end of the article. Data as of August 10, 2026.
- — Of the 68 properties and 2,055 rooms, 55.6% of the rooms are concentrated in 13 business hotels. Rental villas, the largest group by property count at 20, account for just 1.7% of rooms.
- — Four properties of 100+ rooms deliver 999 rooms (48.6%). There are 36 properties with 9 rooms or fewer, but together they add only 87 rooms (4.2%). Supply should be read in rooms and size bands, not property counts.
- — 64.7% of the year’s rooms were already delivered between January and April. The cumulative total through end-July is about 62% of the same period last year, so new inventory is not stacking up in the second half.
- — Estimated settled ADR flipped sign in June. On confirmed figures, YoY change was −4.7% in June and −5.3% in July for business hotels, and −12.8% in June and −17.1% in July for city hotels.
- — New rooms equal roughly 1% of observed market rooms (about 0.9% for business hotels, about 1.0% for city hotels). With estimated OCC in July 2026 at 93.2% for business hotels and 92.6% for city hotels, supply alone cannot explain the swing in rates.
Counting properties will mislead you — Tokyo’s 2026 openings broken down by category
Line up the 68 properties with a confirmed 2026 opening date in Tokyo by category, and the distribution by property count is almost the inverse of the distribution by rooms. By property count the leaders are rental villas (20), hostels (19) and business hotels (13). Sort by rooms instead and the order becomes business hotels 1,142 rooms, hostels 423, city hotels 316, and rental villas 34. Rental villas average 1.7 rooms per property and hostels 22.3, against 87.8 for business hotels. A discussion pitched at the level of “the number of properties went up” is of almost no use when designing a competitive set for revenue management.
Cut the data by size band and the asymmetry is sharper still. Properties with 9 rooms or fewer number 36 — more than half the total — yet contribute 87 rooms, or 4.2% of the whole. Conversely, only 4 projects have 100 rooms or more, but they supply 999 rooms, 48.6% of the total. In other words, Tokyo’s new supply in 2026 is structurally explained by a handful of large projects plus a dozen or so mid-sized business hotels. The largest single project is a 342-room business hotel scheduled to open in August 2026 — one property equal to 16.6% of the year’s new rooms.
Source: MetroEngines Research (based on confirmed OTA listings, N=68 properties); compiled by the HotelBank Editorial Team
| Category | Properties | Rooms | Room share | Avg. rooms per property |
|---|---|---|---|---|
| Business hotel | 13 | 1,142 | 55.6% | 87.8 |
| Hostel | 19 | 423 | 20.6% | 22.3 |
| City hotel | 2 | 316 | 15.4% | 158.0 |
| Other / unclassified | 5 | 89 | 4.3% | 17.8 |
| Rental villa | 20 | 34 | 1.7% | 1.7 |
| Resort hotel | 2 | 25 | 1.2% | 12.5 |
| Ryokan | 2 | 11 | 0.5% | 5.5 |
| Minshuku (family-run inn) | 2 | 10 | 0.5% | 5.0 |
| Guest house | 3 | 5 | 0.2% | 1.7 |
| Total | 68 | 2,055 | 100% | 30.2 |
Source: MetroEngines Research; compiled by the HotelBank Editorial Team (based on confirmed OTA listings. Tokyo, 2026 openings, N=68 properties. “Other / unclassified” combines 3 properties with no category assigned, 1 dormitory and 1 cottage)
What matters here is sizing the “thickness” of the supply pressure against the market it enters. As of July 2026, Tokyo’s observed base was 861 business hotels with 125,487 rooms and 100 city hotels with 32,712 rooms. Measured against those denominators, the 2026 new room count is about 0.9% for business hotels and about 1.0% for city hotels. That works out to roughly a 1% annual increase in market-wide room inventory — not, on its own, a scale that moves market rates by double digits. That said, if the new rooms cluster in a particular station catchment or a particular price band, local competitive pressure will run far stronger than the market-wide average. The 1% figure is not a reason to relax; it is a starting point for triage — a signal that rate movements macro conditions cannot account for have their cause either at your own property or in the submarket.
Openings skew to the first half — 2026’s increment is just over 60% of last year’s
Viewed by opening month, 2026’s new supply is clearly weighted toward the first half. January through April alone delivered 1,329 rooms, or 64.7% of the year. The second quarter onward thins out — 124 rooms in May, 39 in June, 103 in July — before a large 342-room project lands in August. Openings with a confirmed date in the final months of the year (September to December) total only 118 rooms. In practice, then, most of Tokyo’s 2026 opening cohort is already several months past opening and moving through the occupancy ramp-up phase. Building second-half pricing on the assumption that a wave of new inventory is still to come may not match what is actually happening.
Compared year over year, the increment itself is shrinking. Tokyo’s new openings ran to 85 properties and 3,711 rooms in 2024, 113 properties and 5,088 rooms in 2025, and 68 properties and 2,055 rooms in 2026. On a cumulative basis through end-July, 2024 stood at 2,580 rooms and 2025 at 2,579, against 1,595 rooms in 2026 — about 62% of the same period last year. In 2025 the second half carried a peak, with 1,011 rooms concentrated in October alone; no comparable second-half peak is visible in 2026. On a room-count basis, the supply cycle looks to be past the peak of the last two years and entering a slowdown.
This chart is compiled from confirmed OTA listings. Only a portion of properties are listed on OTAs before opening and many are listed only after opening, so property and room counts for the most recent months and years may rise as further listings appear. The figures for the second half of 2026 in particular should be read as a lower bound at this point in time. We recommend reading them alongside the building-permit-based construction pipeline (Ministry of Land, Infrastructure, Transport and Tourism, “Statistical Survey on Building Construction”).
Source: MetroEngines Research (based on confirmed OTA listings); compiled by the HotelBank Editorial Team
For revenue management purposes, this shape reads as a calendar of when the competitive set turned over. Properties that opened between January and April are coming out of the post-opening capture phase and starting to walk rates back up. For the large August opening, the period of most aggressive post-opening selling is still ahead. Even within the same “2026 new supply”, the timing of the price impact on the market shifts by several months depending on the opening month.
Rates: positive in H1, sign reversal in June and July, with city hotels falling hardest
The supply picture has to be set next to the level at which rooms are actually transacting. Looking at Tokyo’s estimated settled ADR (YoY, comparing confirmed months against confirmed months), both business and city hotels were positive from January through April 2026. Business hotels ran +5.1% in January (¥12,600), +2.9% in March (¥15,700) and +3.9% in April (¥17,800); city hotels +8.3% in January (¥26,400) and +5.8% in March (¥30,300). From May the picture changes. City hotels came in at −3.8% in May, −12.8% in June (¥22,200) and −17.1% in July (¥22,400). Business hotels held +5.7% through May, then turned modestly negative at −4.7% in June (¥11,900) and −5.3% in July (¥12,300). The same pattern — both categories dropping below the prior year in June — has also been observed in Kansai, and we break it down in Kyoto Hotel ADR Falls YoY in June 2026: City −14.6%, Business −9.8%.
| Month | Business 2025 | Business 2026 | YoY | City 2025 | City 2026 | YoY |
|---|---|---|---|---|---|---|
| January | 11,940 | 12,550 | +5.1% | 24,400 | 26,419 | +8.3% |
| February | 13,253 | 13,307 | +0.4% | 24,644 | 25,629 | +4.0% |
| March | 15,226 | 15,670 | +2.9% | 28,615 | 30,282 | +5.8% |
| April | 17,138 | 17,802 | +3.9% | 31,076 | 31,241 | +0.5% |
| May | 14,085 | 14,890 | +5.7% | 27,344 | 26,298 | −3.8% |
| June | 12,474 | 11,890 | −4.7% | 25,441 | 22,195 | −12.8% |
| July | 12,990 | 12,306 | −5.3% | 27,055 | 22,434 | −17.1% |
Source: MetroEngines Research; compiled by the HotelBank Editorial Team (estimated settled ADR, pre-tax equivalent, in yen. All YoY comparisons are confirmed month against confirmed month. N=902–924 business hotels, 105–108 city hotels)
Source: MetroEngines Research; compiled by the HotelBank Editorial Team
For reference, estimated settled ADR from August 2026 onward is an estimate based on current selling conditions, observed at ¥12,100 in August, ¥14,400 in September and ¥18,100 in October for business hotels, and ¥21,100, ¥23,700 and ¥30,500 respectively for city hotels. Because these are not confirmed figures and may move with subsequent selling, it is reasonable to wait for month-end confirmation before comparing them directly against confirmed months.
The point to watch is that trying to explain this rate movement through new supply alone does not hold up. First, the supply increment is about 1% of market-wide room count, an order of magnitude away from city hotels’ −17.1%. Second, new city hotel openings in 2026 amount to just 2 properties and 316 rooms — the category with the steepest decline received the fewest new rooms. Third, demand has not fallen. Tokyo’s estimated OCC (based on OTA-listed inventory) for July 2026 averaged 93.2% for business hotels and 92.6% for city hotels, both high. The reading more consistent with the data is not that rates are falling because rooms are not selling, but that within the same pace of sales, the price band at which rooms transact has shifted.
Advance booking depth differs by category — the current picture in booking curves
One further link between supply mix and price position is the difference in booking-curve shape. Taking recent stay dates in Tokyo and lining up estimated OCC at three points — 45 days out, 30 days out, and the latest observation — city hotels consistently start their curve from a higher position than business hotels. On Saturdays, city hotels sat at 78.5–82.4% at 45 days out against 69.8–74.3% for business hotels. On weekdays (Tuesdays) it was 72.2–75.6% for city hotels against 61.5–66.4% for business hotels, a gap of roughly 8 to 12 points between the two categories.
The build-up from 45 days out to the latest observation, however, is larger for business hotels: +6.9 to +12.2 points on Saturdays and +6.1 to +13.2 points on weekdays, against +5.2 to +7.2 points (Saturdays) and +3.5 to +7.2 points (weekdays) for city hotels. Business hotels lean relatively more on late capture; city hotels fill early and then accumulate gradually. Even within the same “Tokyo lodging demand”, the moment at which a pricing decision should be made differs by category.
| Stay date | Business 45 days out | 30 days out | Latest obs. | City 45 days out | 30 days out | Latest obs. |
|---|---|---|---|---|---|---|
| Sat, August 22 | 70.7% | 76.1% | 82.9% | 80.9% | 83.5% | 88.1% |
| Sat, August 29 | 74.3% | 79.4% | 83.3% | 82.4% | 84.8% | 87.7% |
| Sat, September 5 | 69.8% | 75.6% | 76.7% | 78.5% | 82.9% | 83.7% |
| Tue, August 25 | 66.4% | 71.8% | 79.6% | 75.5% | 78.1% | 82.7% |
| Tue, September 1 | 61.5% | 65.8% | 69.6% | 72.2% | 73.8% | 76.3% |
| Tue, September 8 | 63.5% | 69.6% | 69.6% | 75.6% | 79.1% | 79.1% |
Source: MetroEngines Research; compiled by the HotelBank Editorial Team (estimated OCC, based on OTA-listed inventory. Observed property counts: 808–864 business hotels, 98–100 city hotels. “Latest observation” corresponds to 30, 23, 20, 16 and 13 days before the stay date for September 8, September 1, August 29, August 25 and August 22 respectively, and 27 days before for September 5)
For revenue managers running business and city hotels in Tokyo — implications and an action plan
1. Rebuild the competitive set on rooms, not property counts. By property count, 2026’s openings are led by 20 rental villas and 19 hostels; by rooms, 1,142 business hotel rooms and 316 city hotel rooms make up 70.9% of the total. Twenty additional rental villas averaging 1.7 rooms each exert almost no competitive pressure on your sellable room base. When reviewing the competitive set, the deciding question should be how many rooms entered the same price band, not how many properties opened.
2. Do not turn rate softening into a supply-increase story on its own. New rooms equal about 0.9% of observed market rooms for business hotels and about 1.0% for city hotels. Yet confirmed YoY figures show city hotels swinging to −12.8% in June and −17.1% in July — the magnitudes do not line up. And the category with the steepest decline received only 2 properties and 316 rooms of new supply. If your own rates are softening in the same way, there is room to examine your own mix first — guest segment composition, distribution channels, length of stay — before concluding it is a supply effect.
3. Design pricing on the premise that demand has not fallen. Estimated OCC in July 2026 averaged 93.2% for business hotels and 92.6% for city hotels. If the transacting price band is falling amid high occupancy, the share captured in lower price bands may be rising. It is worth checking day by day whether you are cutting uniformly rather than separating the dates that need a value signal from those that do not.
4. Match the timing of rate changes to your category’s curve shape. At 45 days out, estimated OCC for city hotels runs roughly 8 to 12 points above business hotels, while the build-up from 45 days out to the latest observation is larger for business hotels (+6.9 to +12.2 points on Saturdays). Designing to capture demand that firms up early is not the same as designing to capture the late build-up. A good starting point is to compare your own curve against these two market shapes.
With that in mind, here are moves organised by time horizon. None of them guarantees a result; they are presented as options worth considering in light of your own situation.
| Horizon | Move | Decision trigger (tied to figures in this article) | Objective |
|---|---|---|---|
| Today – this week | Place your own June and July achieved rates alongside the market’s confirmed figures (business ¥11,890 / ¥12,306; city ¥22,195 / ¥22,434) and check where you sit | Your decline is larger than the market’s YoY (business −4.7% / −5.3%; city −12.8% / −17.1%) | Separate market factors from property-specific ones |
| Today – this week | Take stock of your competitive set on a room-count basis and classify 2026 openings nearby by size band | Your competitive set includes many properties of 9 rooms or fewer (36 properties, 87 rooms market-wide) | Remove competitors that are not materially competitive |
| Within two weeks | Compare your pace at the 30-days-out cross-section against market levels (business 65.8–79.4%, city 73.8–84.8%), splitting weekdays from Saturdays | At 30 days out you sit clearly below market level and the scope for late build-up is unclear | Avoid pulling last-minute discounting forward |
| Within two weeks | Break the minimum rate down by date and day of week, and replace it with a design that holds separate levels for weekdays and Saturdays | Market levels at 45 days out separate clearly between Saturdays (business 69.8–74.3%) and weekdays (61.5–66.4%), yet you operate a single floor | Avoid leaving revenue on the table on high-demand dates |
| Looking to next month | Redesign your price position at the 45-days-out cross-section by segment, and document the intended split between early-confirmed and late business | You cannot yet tell whether your curve is the business-hotel type (+6.1 to +13.2 points from 45 days out to latest) or the city-hotel type (+3.5 to +7.2 points) | Settle on a pattern for revision timing |
| Looking to next month | Rebuild the autumn price calendar around the seasonal shape (market estimates of ¥18,110 for business hotels and ¥30,533 for city hotels in October) | Your autumn settings still carry summer levels across unchanged | Capture the seasonal peak in full |
Source: MetroEngines Research; compiled by the HotelBank Editorial Team (October levels are estimates based on current selling conditions and may change)
Conclusion — three yardsticks for reading supply
Breaking Tokyo’s 2026 openings down by rooms brings three things into view. First, the centre of gravity in rooms. Of the 68 properties, 70.9% of the rooms sit with 15 business and city hotels, and 4 properties of 100 rooms or more alone account for 48.6%. Supply should be discussed in rooms, and further in size bands, not property counts. Second, the timing of delivery. January through April delivered 64.7% of the year, and the cumulative total through end-July is about 62% of the same period last year. The increment itself is smaller than in the past two years, and new inventory is not stacking up in the second half. Third, the comparison of scale. New rooms equal about 0.9% of observed market rooms for business hotels and about 1.0% for city hotels — city hotels’ −17.1% swing in rates cannot be explained by supply alone.
These three yardsticks carry over directly to reading supply news in the years ahead. When you see a headline counting properties, convert it to rooms, check the distribution of opening months, and work out the ratio against market-wide room count. Once you have taken those three steps, compare your own price position and booking pace against the market’s curve. Added supply and rate movements are happening in the same market at the same time, but one is not necessarily the cause of the other.
About the Data
| Definition of estimated OCC | Occupancy on an OTA-listed-inventory basis = 100 − 100 × rooms remaining on OTA listings ÷ total rooms. It is an estimate based on how listed inventory is being absorbed on OTAs, and is defined differently from actual room occupancy (it reads higher). This article uses it for Tokyo in July 2026 (monthly average) and for stay dates from August 22 to September 8, 2026. |
| Booking curve | Based on observations from 45 days before the stay date up to the most recent observation. |
| Definition of estimated settled ADR | The transaction price level (pre-tax equivalent) estimated from OTA and other sales data (lowest-plan level × category-specific coefficients, ensembled across multiple channels). Past months are confirmed figures; the current and future months are estimates based on current selling conditions. Median error against published operating results is 6.6%. YoY changes are calculated only between confirmed months. |
| Nature of the new-openings data | Openings are compiled from confirmed OTA listings. Only a portion of properties are listed on OTAs before opening and many are listed after opening, so property and room counts for recent and future months are a lower bound that may rise. |
| Breakdown of N | New openings = 68 properties (2,055 rooms) with a confirmed 2026 opening date in Tokyo. Comparison years: 2024, 85 properties and 3,711 rooms; 2025, 113 properties and 5,088 rooms. Estimated settled ADR = Tokyo business hotels N=902–924 properties, city hotels N=105–108 properties (varying by month). Estimated OCC (July 2026) = business hotels 825–873 properties / 125,487 rooms, city hotels 98–100 properties / 32,712 rooms. Booking curves = business hotels 808–864 properties, city hotels 98–100 properties. |
| Data as of | Data as of August 10, 2026. Selling conditions and inventory change daily, so the figures in this article are a snapshot at the time of retrieval. |
■ Data sources
Property and room counts for new openings come from MetroEngines Research’s compilation based on confirmed OTA listings (Tokyo, openings 2024–2026). Estimated settled ADR comes from the same firm’s monthly aggregation by prefecture and category (double-occupancy basis; business hotels / city hotels). Estimated OCC and booking curves come from the same firm’s daily observation of OTA-listed inventory (Tokyo, by category). The construction pipeline is cited for reference from the Ministry of Land, Infrastructure, Transport and Tourism, “Statistical Survey on Building Construction”.
■ Calculation assumptions
All YoY comparisons are between confirmed months; estimates for the current month onward are excluded from the comparison (levels from August 2026 are noted separately in the body as reference values). Room share, size-band classification and the distribution of opening months use the 68 properties and 2,055 rooms with a confirmed opening date as the denominator. The ratio to existing stock (about 0.9% for business hotels, about 1.0% for city hotels) uses OTA-listed inventory for the same categories as of July 2026 (business hotels 861 properties / 125,487 rooms; city hotels 100 properties / 32,712 rooms) as the denominator. Booking curves use only observations from 45 days before the stay date onward; cross-sections earlier than 45 days out are not covered.
■ Limitations and caveats
(1) Because new openings are compiled from confirmed OTA listings, they carry a listing lag — only a portion of properties are listed before opening and many are listed afterwards — so the more recent the month or year, the more the figures understate, and they should be read as a lower bound. (2) Estimated OCC is the absorption rate of OTA-listed inventory and is defined differently from actual room occupancy (it reads higher). Observed property counts by stay date range from 808 to 864 for business hotels and 98 to 100 for city hotels. (3) Estimated settled ADR has a median error of 6.6% against published operating results. The number of properties covered varies by month (business hotels 902–924, city hotels 105–108). (4) This article places changes in supply composition alongside movements in rates over the same period; it does not establish a causal relationship between them. (5) Figures are a snapshot as of August 10, 2026 and may move afterwards as inventory and selling conditions change.
Related Reading
- Kyoto Hotel ADR Falls YoY in June 2026: City −14.6%, Business −9.8%
- Chiba Settled ADR: H1 2026 Beats Last Year, July Turns −8.2%
- Policy Rate 1.00%: Break-Even ADR Across Japan’s 8 Hotel Markets
- Median 39.2% of Rooms Online — Allocation Across 12,941 Hotels
- Kanagawa Hotel Market 2026: Four Tiers and a ¥15,400 Autumn ADR Gap