

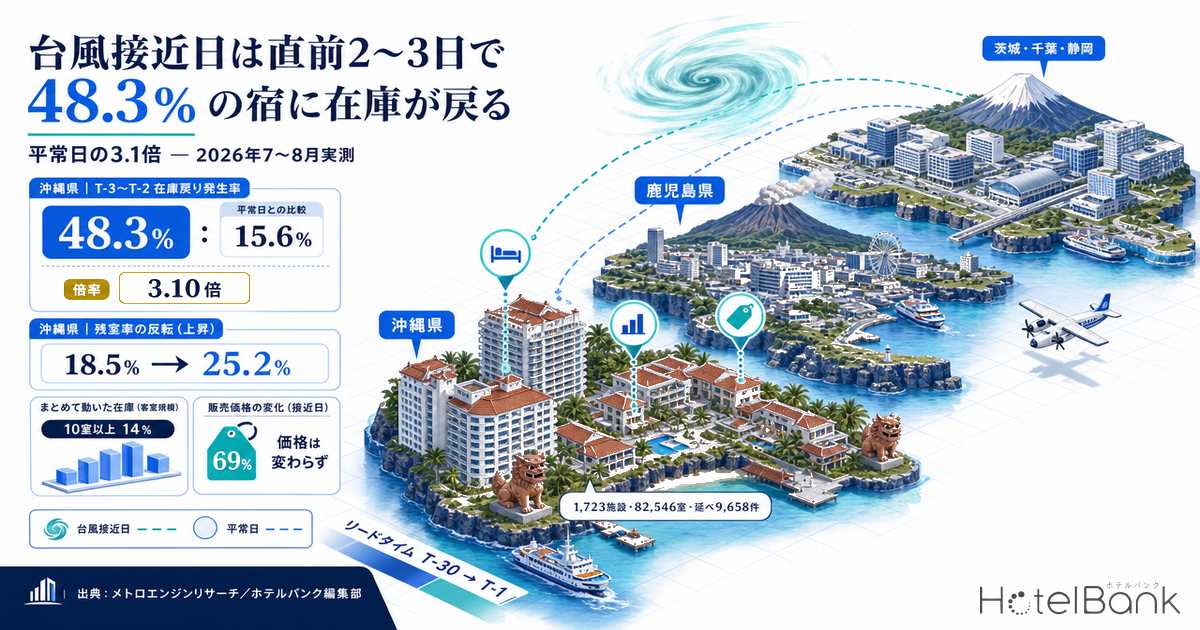
On stay dates where a typhoon is approaching, room inventory that had once drained away turns around and starts increasing again just before check-in. Operators know the phenomenon anecdotally, but few have the numbers on which lead time, how many properties, and how many rooms. This article measures that directly: for Typhoons No. 9 (Bavi), No. 13 (Dolphin) and No. 15 (Chan-hom), which approached or made landfall in Japan in July and August 2026, we tracked remaining-inventory movement by lead time across 1,723 properties (82,546 rooms) and 9,658 property-stay-date observations in Okinawa, Kagoshima, Ibaraki, Chiba, Shizuoka, Kochi and Miyazaki.
HotelBank has previously published Typhoon-Heavy Aug–Sep 2026: ‘Indoor-Complete’ Hotels Defend Occupancy, but that article dealt with the quality of demand — which property types can hold occupancy through typhoon season. This article is not about that. It isolates one inventory-side phenomenon only: after a typhoon becomes a certainty, how already-sold inventory comes back over time. The goal is not to judge whether demand is strong or weak, but to measure where in the booking curve resale opportunity appears, and at what scale.
Metric Definitions Used in This Article
- LT (lead time): days remaining until the stay date (check-in date). We write “T-7” to mean seven days before the stay date.
- Remaining inventory: the number of sellable rooms each property publishes on OTAs and similar channels (room basis). Observations are taken once daily, on a one-night, two-guests-per-room basis.
- Return: an observation point is counted as a “return” when remaining inventory is higher than at the immediately preceding observation, and that preceding figure was below the maximum observed during the tracking window. In other words, we count only observation points where inventory turned upward after having declined; inventory that has risen consistently since the start of sales is excluded.
- Return incidence rate: among property × stay-date pairs with observations in the target lead-time band, the share for which at least one return was observed in that band.
- Return volume: the total number of rooms returned within that band. Also reported as a ratio to total room count.
- Population condition: only properties whose maximum publicly listed room count during the tracking window reached at least 30% of total rooms are included. At properties that expose only a small allotment to OTAs, movement in remaining inventory does not represent the property’s overall supply-demand picture.
- Data source: MetroEngines Research. Meteorological dates are from the Japan Meteorological Agency’s “Typhoon Position Table, Reiwa 8 (2026)” and other sources (see the source list at the end of this article).
- — On typhoon-approach stay dates in Okinawa, 48.3% of properties showed a return of remaining inventory in the final two to three days (T-3 to T-2). That is 3.10x the 15.6% recorded on normal days.
- — The direction reverses even at the area-aggregate level. Okinawa’s remaining-inventory rate bottomed at 18.5% at T-7 and climbed back to 25.2% at T-3, a 6.7-point rebound.
- — The lead time at which the return peak forms differs by typhoon. Typhoon No. 13, whose track firmed up early, saw returns build from T-7; Typhoon No. 15, which took an unusual track, concentrated its returns in T-3 to T-1.
- — Inventory comes back in blocks. On typhoon-approach stay dates, blocks of 10 or more rooms accounted for 14% of returns — seven times the 2% seen on normal days.
- — 69% of returned inventory was relisted with no price change. There is substantial design headroom in how last-minute inventory is repriced.
The typhoons and stay dates covered — three events in July–August 2026
Start by fixing the meteorological facts. Based on the Japan Meteorological Agency’s “Typhoon Position Table, Reiwa 8 (2026)” and contemporaneous reporting, three typhoons materially affected Japanese lodging demand in July and August 2026. All are past events whose stay dates have already elapsed; this article makes no forecast about future dates.
| Typhoon | Main impact dates | Meteorological course | Stay dates treated as typhoon-approach dates |
|---|---|---|---|
| Typhoon No. 9 (Bavi) | July 11, 2026 | Passed near Tarama Island in the Miyako Islands around 09:00 on July 11 at 945 hPa, large and strong, then moved into the East China Sea | Fri July 10 and Sat July 11 / Okinawa |
| Typhoon No. 13 (Dolphin) | August 6–8, 2026 | Closest approach north of the Daito Islands at 945 hPa on the night of August 6 (around 21:00–22:00); passed near Nakijin on Okinawa Island at 935 hPa around 15:00 on August 7. Storm-force winds on Okinawa Island lasted roughly 40 hours, with the storm warning lifted at 13:57 on August 8 | Thu August 6 – Sat August 8 / Okinawa and Kagoshima |
| Typhoon No. 15 (Chan-hom) | August 11–12, 2026 | Made landfall in southern Ibaraki around 20:00 on August 11 — the first landfall in Ibaraki since records began in 1951. Crossed Honshu and exited into the Sea of Japan from Tsuruga Bay around 06:00 on August 12 | Tue August 11 and Wed August 12 / Ibaraki, Chiba and Shizuoka |
Source: Compiled by the HotelBank Editorial Team from the Japan Meteorological Agency’s “Typhoon Position Table, Reiwa 8 (2026)”, Japan Weather Association (tenki.jp), Weathernews and Ryukyu Shimpo (all accessed August 25, 2026)
Comparison normal days were drawn from the same prefecture, same day of the week, within one to three weeks before or after. Matching the day of week matters because booking-curve shape varies sharply by weekday. For Typhoon No. 13 in Okinawa (Thu 8/6, Fri 8/7, Sat 8/8) we used the Thursdays, Fridays and Saturdays between July 23 and August 1; for Typhoon No. 15 (Tue 8/11, Wed 8/12) we used the Tuesdays and Wednesdays of August 4–5 and August 18–19. The Obon period (August 13–16) has a distinctive demand structure and was excluded from both the typhoon and the normal-day sets.
In Okinawa, the T-3 to T-2 return rate ran 3.1x normal days — 48.3% versus 15.6%
The headline first. Comparing the three days directly hit by Typhoon No. 13 in Okinawa (August 6–8; 296 properties, 779 property-stay-dates) against six normal days in the same prefecture (302 properties, 1,415 property-stay-dates), the gap widens as lead time shortens.
| Lead-time band | Typhoon No. 13 dates return incidence |
Normal days return incidence |
Ratio | Median return volume (typhoon / normal, % of total rooms) |
|---|---|---|---|---|
| T-30 to T-15 | 58.7% | 52.1% | 1.13x | 5.6% / 6.2% |
| T-14 to T-8 | 51.8% | 42.0% | 1.23x | 5.0% / 4.3% |
| T-7 to T-4 | 54.2% | 24.4% | 2.22x | 8.8% / 3.1% |
| T-3 to T-2 | 48.3% | 15.6% | 3.10x | 10.5% / 2.8% |
| T-1 | 14.0% | 4.5% | 3.11x | 5.3% / 1.7% |
Source: Compiled by the HotelBank Editorial Team from MetroEngines Research / Okinawa; properties whose OTA-listed allotment reached at least 30% of total rooms only. Typhoon No. 13 dates N=296 properties (779 property-stay-dates); normal days N=302 properties (1,415 property-stay-dates)
Between T-30 and T-8 the two series stay within 10 points of each other. But from T-7 onward the normal-day return rate falls to 24.4% while typhoon-approach dates hold high at 54.2%. The gap is widest at T-3 to T-2: 48.3% against 15.6%, a ratio of 3.10x. Median return volume also diverges — 10.5% of total rooms versus 2.8%, roughly 3.8x — so the difference is not only in how often returns happen but in how large each one is.
There is a second, more intuitive measure: the share of properties whose remaining inventory at T-2 was simply higher than at T-7. On Typhoon No. 13 approach dates that was 47.6% — nearly one property in two had more rooms open two days out than a week out. The same measure on normal days is just 10.1%.
Source: Compiled by the HotelBank Editorial Team from MetroEngines Research / Okinawa; five typhoon-approach dates (Typhoons No. 9 and No. 13) N=333 properties (1,286 property-stay-dates), six normal days N=304 properties (1,417 property-stay-dates)
Viewed daily, the return incidence rate on typhoon-approach dates rises gradually from T-14, peaks at 31.2% on T-3, and then collapses quickly. Normal days simply track flat in a 7–10% band over the same stretch, forming no discernible peak. The exogenous shock of a typhoon carves a clear spike into the tail end of the booking curve, and nowhere else.
The area-wide remaining-inventory rate reverses — Okinawa runs from 18.5% at T-7 to 25.2% at T-3
What happens when you aggregate the whole area rather than looking at individual properties? Summing remaining inventory across covered properties and dividing by total rooms gives an “area remaining-inventory rate”; plotted by lead time, the contrast between normal days and typhoon-approach dates is sharper still.
Source: Compiled by the HotelBank Editorial Team from MetroEngines Research / Okinawa: typhoon-approach dates N=333 properties, normal days N=304 properties. Kagoshima: Typhoon No. 13 approach dates N=171 properties, normal days N=184 properties. All limited to properties whose OTA-listed allotment reached at least 30% of total rooms
On normal days the area remaining-inventory rate declines monotonically — from 29.6% (T-30) to 12.5% (T-1) in Okinawa, and from 38.7% to 19.5% in Kagoshima. A textbook booking curve. On typhoon-approach dates the direction changes midway. Okinawa bottoms at 18.5% at T-7, reverses, and builds back 6.7 points to 25.2% by T-3. Kagoshima does the same, bottoming at 26.3% at T-11 and recovering 5.8 points to 32.1% at T-3.
What matters here is that the reversal occurs at the level of the area aggregate. If it were a one- or two-room swing at individual properties, observation noise would be a reasonable suspicion. But when totals covering roughly 16,000 rooms in Okinawa and 7,900 rooms in Kagoshima are pushed back by several percentage points, a substantial volume of rooms has genuinely returned to sellable status across the market.
Where the return peak forms differs by typhoon — it tracks the moment the forecast firms up
Lining up the three typhoons, the lead time at which returns peak is not the same.
Source: Compiled by the HotelBank Editorial Team from MetroEngines Research / Okinawa: Typhoon No. 13 N=296 properties, normal days N=302 properties. Kagoshima: Typhoon No. 13 N=171 properties, normal days N=183 properties. Ibaraki, Chiba and Shizuoka: Typhoon No. 15 N=782 properties, normal days N=981 properties
| Segment | T-14 to T-8 | T-7 to T-4 | T-3 to T-2 | T-1 | Properties with net inventory gain T-7 → T-2 |
|---|---|---|---|---|---|
| Okinawa — Typhoon No. 13 | 51.8% | 54.2% | 48.3% | 14.0% | 47.6% |
| Okinawa — normal days | 42.0% | 24.4% | 15.6% | 4.5% | 10.1% |
| Okinawa — Typhoon No. 9 | 38.9% | 44.1% | 36.7% | 12.5% | 37.7% |
| Kagoshima — Typhoon No. 13 | 54.1% | 49.7% | 29.1% | 7.3% | 35.0% |
| Kagoshima — normal days | 31.8% | 24.2% | 23.6% | 9.3% | 18.5% |
| Ibaraki, Chiba, Shizuoka — Typhoon No. 15 | 45.7% | 30.6% | 18.9% | 10.1% | 12.3% |
| Ibaraki, Chiba, Shizuoka — normal days | 39.5% | 27.3% | 12.9% | 4.8% | 9.9% |
Source: Compiled by the HotelBank Editorial Team from MetroEngines Research / properties whose OTA-listed allotment reached at least 30% of total rooms only; same-day (T-0) observations excluded
Typhoon No. 13 in Okinawa builds a long, high plateau from T-7 through T-2. The same typhoon in Kagoshima peaks at 30.1% at T-8 and eases back to 29.1% by T-3 to T-2. Ibaraki, Chiba and Shizuoka, where Typhoon No. 15 made landfall, differ from normal days by only 3.3 points at T-7 to T-4 — yet the gap opens right at the end: 18.9% against 12.9% at T-3 to T-2, and 10.1% against 4.8% at T-1.
Map that difference onto the character of each storm and it reads clearly. Typhoon No. 13 formed on July 27 and did not pass the Daito Islands until August 6 — more than ten days during which a track toward the Nansei Islands was signalled early. Travellers could decide to change plans early, and returns build from T-7. Typhoon No. 15, by contrast, travelled westward from the sea east of Japan — the reverse of the usual direction — and its landfall in Ibaraki was the first there since records began in 1951. When a track firms up late, the decision to move an itinerary is pushed back by the same amount. The lead time at which the return peak forms appears to be tied closely to the point at which the typhoon’s track was communicated with confidence.
The practical implication is straightforward. Rather than assuming uniformly that “inventory comes back from T-3 when a typhoon hits”, it fits reality better to take the day the track information firmed up as the starting point, and expect the resale peak two to four days after that. In practice that means preparing well in advance for Nansei Islands tracks, where forecasts settle early, and staying ready right up to the day before for Honshu-crossing tracks, where the path is harder to read.
Inventory comes back in blocks — 10-plus-room releases account for 14%
Look at the size of each individual return and inventory on typhoon-approach dates comes back in a completely different shape from normal days.
Source: Compiled by the HotelBank Editorial Team from MetroEngines Research / return events observed between T-7 and T-1. Okinawa: typhoon-approach dates N=1,951 events, normal days N=710 events. Ibaraki, Chiba and Shizuoka: Typhoon No. 15 N=1,016 events, normal days N=1,696 events
On normal days in Okinawa, 77% of returns are small — one or two rooms. Cancellations trickle in day by day and inventory trickles back: an entirely ordinary cycle. On typhoon-approach dates the one-to-two-room share falls to 55%, and in its place five-to-nine-room returns take 15% and 10-plus-room returns take 14%. Since blocks of 10 or more make up just 2% on normal days, that is a seven-fold increase in frequency. Among the observed cases: a 205-room property where 48 rooms returned to sellable status at T-9 and 51 more at T-10, and a roughly 220-room property where 83 rooms came back at once at T-3.
For Typhoon No. 15 in Ibaraki, Chiba and Shizuoka, the size mix barely differs from normal days (10-plus-room returns at 4% versus 4%). The storm took about ten hours from landfall to exit, so the impact was confined to a single night — it never escalated into group or multi-night block cancellations. Even within the category “typhoon”, the granularity of returning inventory differs entirely between a long-stalling Nansei Islands event and a Honshu-crossing one.
On interpreting a “return”: an increase in remaining inventory on an OTA can arise in three ways — (1) a booking is cancelled and the room returns to sellable inventory, (2) the property reopens inventory it had temporarily withheld from sale, or (3) the property releases additional inventory it had originally been metering out to OTAs. Public data cannot distinguish between them. This article treats only the observed fact that “remaining inventory turned upward”, and does not attribute the cause exclusively to cancellations. In particular, cases where five or more rooms return at once may include a property reopening or releasing inventory of its own accord.
69% of returned inventory is relisted without touching the price
At what price does returning inventory come back to market? We compared the lowest listed rate at the moment a return was observed against the rate at the immediately preceding observation.
| Segment (returns observed T-7 to T-1) | Observations | Price lowered | Unchanged | Price raised | Median change |
|---|---|---|---|---|---|
| Okinawa — typhoon-approach dates | 1,951 | 24% | 69% | 7% | ±0.0% |
| Okinawa — normal days | 710 | 23% | 69% | 8% | ±0.0% |
| Ibaraki, Chiba, Shizuoka — Typhoon No. 15 | 1,016 | 28% | 59% | 13% | ±0.0% |
| Ibaraki, Chiba, Shizuoka — normal days | 1,696 | 23% | 68% | 9% | ±0.0% |
Source: Compiled by the HotelBank Editorial Team from MetroEngines Research / lowest listed rate (two guests per room, per-room rate, tax included) compared against the immediately preceding observation. Changes within ±1% are treated as unchanged
In Okinawa, on both typhoon-approach dates and normal days, roughly 70% of inventory is relisted at an unchanged price. Even in the middle of an unmistakable demand shock, pricing behaviour looks no different from an ordinary week. Only Typhoon No. 15 in Ibaraki, Chiba and Shizuoka shows the unchanged share falling to 59%, with movement in both directions rising — 28% lowered and 13% raised — and even there, a majority still leaves the price alone.
This is where the revenue opportunity sits. T-3 to T-2 on a typhoon-approach date is the moment when inventory that was never in the original sales plan comes back — and comes back in a block on the order of 10% of total rooms. The price at which that inventory is returned to market is exactly the kind of decision where planning ahead converts speed directly into results. Even within the single category “return”, the right resale price is completely different for a stay date under an active storm warning versus a post-typhoon stay date after the warning has been lifted. As set out in Revenue Management vs Dynamic Pricing: 19,365 Hotels, Median 4 Moves, automating price moves and designing which conditions call for which price are two separate things. Typhoon resale pricing belongs firmly to the second — it is something to design in advance.
The effect spills into prefectures off the track — Kochi and Miyazaki hit 50.4% at T-7 to T-4
Typhoon No. 13 passed over Okinawa Island and exited into the East China Sea; Kochi and Miyazaki lay outside the central track of the storm-force wind area. Yet in those two prefectures too, stay dates of August 6–8 recorded a T-7 to T-4 return incidence rate of 50.4% — 20.2 points above the 30.2% on the same prefectures’ normal days (July 30 – August 1).
That gap cannot be explained by the presence or absence of storm-force winds alone. During Typhoon No. 13, flight and ferry cancellations were widespread, centred on services to and from the Nansei Islands, and transport and logistics on Okinawa Island came to a halt. Once part of an itinerary becomes impossible, the accommodation nights attached to it move in sympathy, even outside the wind field. When sizing up a typhoon’s impact, looking only at the storm-force wind area on the track map is not enough. Prefectures that share a transport network with the affected area will see inventory return even without a direct hit.
One caveat: in those same two prefectures, T-3 to T-2 came in at 28.3% against 32.7% on normal days — below the normal-day level. The spillover concentrates in the T-7 to T-4 band and does not persist to the final days. That is the opposite of Okinawa, on the central track, which stayed elevated right through the end.
Sizing the resale opportunity — 2.0 to 5.1 rooms per 100, with volume the stronger lever
Everything above is observed fact. To set an operational posture, though, it helps to convert that fact into how many rooms it means for your own property. What follows uses only the return incidence rates and median return volumes measured in this article; no new observations or external forecasts are added. We assume a single property with 100 total rooms and estimate the rooms available for resale at T-3 to T-2 on a typhoon-approach date.
| Scenario (corresponding observed event) | Return incidence (observed) | Median return volume (assumption) | Expected resale rooms / 100 rooms |
|---|---|---|---|
| Pessimistic: Honshu-crossing type (Ibaraki, Chiba, Shizuoka / Typhoon No. 15) | 18.9% | 10.5% | 2.0 rooms |
| Mid-case: Nansei Islands, smaller event (Okinawa / Typhoon No. 9) | 36.7% | 10.5% | 3.9 rooms |
| Optimistic: Nansei Islands, long-stalling type (Okinawa / Typhoon No. 13) | 48.3% | 10.5% | 5.1 rooms |
Source: Compiled by the HotelBank Editorial Team from MetroEngines Research / incidence rates are the observed T-3 to T-2 figures from Table 3. Median return volume uses the observed Okinawa / Typhoon No. 13 T-3 to T-2 value of 10.5% as a common assumption across all scenarios (median return volumes for the other events were not calculated for this article). Applying the same conversion to Okinawa normal days (incidence 15.6%, return volume 2.8%) yields just 0.4 rooms
The same calculation on normal days gives 0.4 rooms per 100. Whatever the typhoon type, the final band before a typhoon-approach stay date produces 4.5 to 11.6 times the resale volume of a normal day (the ratio of incidence × volume). That said, since the conversion is nothing more than the product of two observed values, it is worth knowing which of the two does the work.
| Return incidence \ Median return volume | 3% | 5% | 8% | 10.5% (observed) | 13% |
|---|---|---|---|---|---|
| 20% | 0.6 | 1.0 | 1.6 | 2.1 | 2.6 |
| 30% | 0.9 | 1.5 | 2.4 | 3.1 | 3.9 |
| 40% | 1.2 | 2.0 | 3.2 | 4.2 | 5.2 |
| 48.3% (observed) | 1.4 | 2.4 | 3.9 | 5.1 | 6.3 |
| 55% | 1.7 | 2.8 | 4.4 | 5.8 | 7.2 |
Source: Compiled by the HotelBank Editorial Team / the shaded cell is the observed Okinawa / Typhoon No. 13 T-3 to T-2 value (incidence 48.3% × return volume 10.5%). Each cell is incidence × return volume × 100 rooms
Read the table across and, holding incidence at 48.3%, moving return volume from 3% to 13% swings expected rooms from 1.4 to 6.3 — a factor of 4.5. Read it down and, holding return volume at 10.5%, moving incidence from 20% to 55% takes expected rooms from 2.1 to 5.8, a factor of only 2.8. What drives the scale of resale is less “at how many properties it happens” than “how many rooms come back at each one”. The observed data says the same: the typhoon-versus-normal gap was 3.1x on incidence but 3.8x on median return volume — the latter is the wider of the two.
In practical terms, that makes it more valuable to identify the properties — and the dates — with large return volumes first. Blocks of 10 or more rooms accounted for 14% of returns on typhoon-approach dates, seven times the 2% on normal days. Within a single property, the days with a high share of group and multi-night business are the days most likely to produce large returns. The first thing to check once a typhoon approach comes into view is your own property’s group and multi-night mix for that date.
What this means for revenue practice — three things to design in advance
Pre-define resale pricing for last-minute inventory by scenario
At T-3 to T-2 on a typhoon-approach date, roughly half of properties in Okinawa get back inventory on the order of 10% of total rooms. Working out the price from scratch in the moment costs time, and every hour of delay shrinks the opportunity. In the observed data, about 70% of returned inventory was relisted at an unchanged price — a clear sign of unused design headroom. At minimum, set pricing policy in advance for three cases: a stay date under an active storm warning, a post-typhoon stay date after the warning has been lifted, and a stay date where transport is disrupted but conditions around the property are normal. The post-typhoon date in particular tends to absorb rescheduled itineraries, so real demand returns — and a mechanical discount is not necessarily the right answer.
Expect the return peak at “the day the track firmed up, plus two to four days”
For an event like Typhoon No. 13, where the track was signalled early, returns built from T-7; for one like Typhoon No. 15, where the track stayed hard to read until the last moment, returns concentrated in T-3 to T-1. Rather than fixing a calendar lead time, it fits reality better to set the resale posture from the day forecast confidence improved. In practice that means preparing well ahead for Nansei Islands tracks and keeping the window open until the day before for tracks approaching Honshu.
Design cancellation policy and date-change offers around block returns
On typhoon-approach dates, blocks of 10 or more rooms return seven times as often as on normal days. That calls for different moves than the one-or-two-rooms-at-a-time pattern of an ordinary week. If you start from the assumption that a large number of rooms will open at once, it becomes well worth preparing date-change offers in advance. When a date change lands, the inventory on that stay date still returns — but the revenue is simply moved to another date. Typhoon-approach dates are usually flanked by post-typhoon demand-recovery dates, and having an alternative date of your own to offer is the decisive difference from an ordinary cancellation.
On the question of supply-side capacity, see also 43% of Chiba’s 75,065 Rooms Sit in 25 Disaster-Relief Municipalities, which addresses lodging demand during a disaster directly.
Method and caveats
Method: the population covers properties located in Okinawa, Kagoshima, Ibaraki, Chiba, Shizuoka, Kochi and Miyazaki, registered as operating, for which at least 20 observation points were available within a 90-day lead-time window for the target stay dates in July–August 2026. We used remaining inventory observed on a one-night, two-guests-per-room basis, and included only properties whose maximum publicly listed room count during the window reached at least 30% of total rooms (1,723 properties, 82,546 rooms, 9,658 property-stay-dates). Records where the maximum publicly listed room count exceeded total rooms were excluded, since the property master’s room count and the definition of listed inventory may not align.
Caveats: (1) Observations on the stay date itself (T-0) systematically show zero remaining inventory at almost every covered property and do not represent actual same-day selling, so they were excluded from every calculation. Analysis is limited to T-1 and earlier. (2) Remaining inventory is sellable inventory published on OTAs and differs from a property’s total real inventory; direct, group and travel-agency inventory is not included. (3) On typhoon-approach dates, some properties show a sharp drop in remaining inventory at T-2 to T-1, but this is not necessarily a sell-out — it may result from the property temporarily suspending sales for nearby dates. Suspending sales is a reversible action a property can undo at any time, and this article does not treat it as inventory disappearing. (4) This article makes no judgement whatsoever about operating status (closure or suspension of business). Facts about operating status should be taken from each property’s own official announcements.
Conclusion
Measuring remaining-inventory movement across 1,723 properties and 9,658 property-stay-dates for Typhoons No. 9, No. 13 and No. 15 in July–August 2026 confirms four things. First, on stay dates where a typhoon approached, the return incidence rate in the final two to three days (T-3 to T-2) reached 48.3% in Okinawa — 3.1 times the 15.6% on normal days. Second, the area-aggregate remaining-inventory rate reversed upward in Okinawa, from 18.5% at T-7 to 25.2% at T-3, meaning a substantial volume of rooms across the market returned to sellable status. Third, the lead time at which the return peak forms varies by typhoon: returns built from T-7 for Typhoon No. 13, whose track firmed up early, and concentrated in T-3 to T-1 for Typhoon No. 15, whose unusual track stayed unclear until the last moment.
And fourth, roughly 70% of returned inventory was relisted without any price change. A typhoon is an exogenous factor no one can avoid — but when, how much and at what granularity inventory comes back is well within the range of what can be anticipated. And if it can be anticipated, how that inventory is handled becomes a matter of design. Last-minute inventory in typhoon season is better understood not as a situation to be managed after the fact, but as a resale opportunity you can prepare for in advance.
Further reading
- Typhoon-Heavy Aug–Sep 2026: ‘Indoor-Complete’ Hotels Defend Occupancy
- Nagasaki Early Sep Booking Curves: 9/12 OCC 82.7%, Ryokan 24.2pt Gap
- Wakayama Silver Week Peaks Midway: Ryokan 93.7% Sun, 82.9% Sat
- Revenue Management vs Dynamic Pricing: 19,365 Hotels, Median 4 Moves
- 43% of Chiba’s 75,065 Rooms Sit in 25 Disaster-Relief Municipalities
- Chiba Floods: Narita 2.29x, Urayasu 2.40x, Disaster-Hit Chuo 0.83x
- Okinawa 176 Resorts: Obon vs Early Sep, 3.0pt Gap at 30 Days Out
- Booking Curves Across 47 Prefectures: +4.1pt Median Pickup from T-45
References and Sources
■ Data source
Publicly listed remaining-inventory data by property and stay date, collected by MetroEngines Research (Okinawa, Kagoshima, Ibaraki, Chiba, Shizuoka, Kochi and Miyazaki / one night, two guests per room / lead time within 90 days, at least 20 observation points / 1,723 properties, 82,546 rooms, 9,658 property × stay-date observations). Typhoon dates and tracks are from the Japan Meteorological Agency’s “Typhoon Position Table, Reiwa 8 (2026)” and other published materials (all accessed August 25, 2026).
■ Estimation assumptions
The expected resale rooms in Tables 5 and 6 multiply the observed return incidence rate by the observed median return volume (as a share of total rooms) and convert to a single property of 100 total rooms; no external forecasts or new observations are added. Median return volume uses the observed Okinawa / Typhoon No. 13 T-3 to T-2 value of 10.5% as a common assumption across all scenarios (median return volumes for the other events were not calculated for this article). The population condition is a maximum publicly listed room count during the tracking window of at least 30% and no more than 100% of total rooms. Comparison normal days were drawn from the same prefecture, same day of the week, within one to three weeks before or after, and the Obon period (August 13–16) was excluded from both the typhoon-approach and normal-day sets.
■ Limitations and caveats
Remaining inventory is sellable inventory published on OTAs and excludes direct, group and travel-agency inventory. An increase in remaining inventory is not limited to booking cancellations — it also covers a property reopening or additionally releasing inventory — so this article treats a “return” purely as an observed fact and does not identify its cause. Observations on the stay date itself (T-0) systematically show zero remaining inventory at almost every covered property and are excluded from all calculations. Coverage is limited to three events in July–August 2026; a typhoon of different scale, track or season would produce a different distribution of returns. Not to be used to forecast future dates.
■ Meteorological data (typhoon dates and tracks)
- Japan Meteorological Agency, “Typhoon Position Table, Reiwa 8 (2026)” (accessed August 25, 2026)
- Japan Meteorological Agency, “Number of Typhoon Landfalls (confirmed figures through 2025 and preliminary figures for 2026)” (accessed August 25, 2026)
- Japan Weather Association, tenki.jp, “[Breaking] Typhoon No. 15 has made landfall in southern Ibaraki — the first landfall in Ibaraki on record” (August 11, 2026)
- Weathernews, “Typhoon No. 15 (Chan-hom) makes landfall in southern Ibaraki — first landfall in Ibaraki on record” (August 11, 2026)
- Japan Weather Association, tenki.jp, “Typhoon No. 13 to make its closest approach to Okinawa Island tomorrow, the 7th — effects through the weekend” (August 6, 2026)
- Ryukyu Shimpo, “[Typhoon No. 13] Okinawa Island enters the storm-force wind area; closest approach imminent” (August 7, 2026)
- Ryukyu Shimpo, “[Typhoon No. 13] A long 40 hours of storm-force winds on Okinawa Island — transport and logistics halted, effects felt across the region” (August 2026)
■ Lodging inventory data
- MetroEngines Research — remaining-inventory movement by property and stay date (lead time within 90 days, one night and two guests per room, covering 1,723 properties, 82,546 rooms and 9,658 property × stay-date observations)