

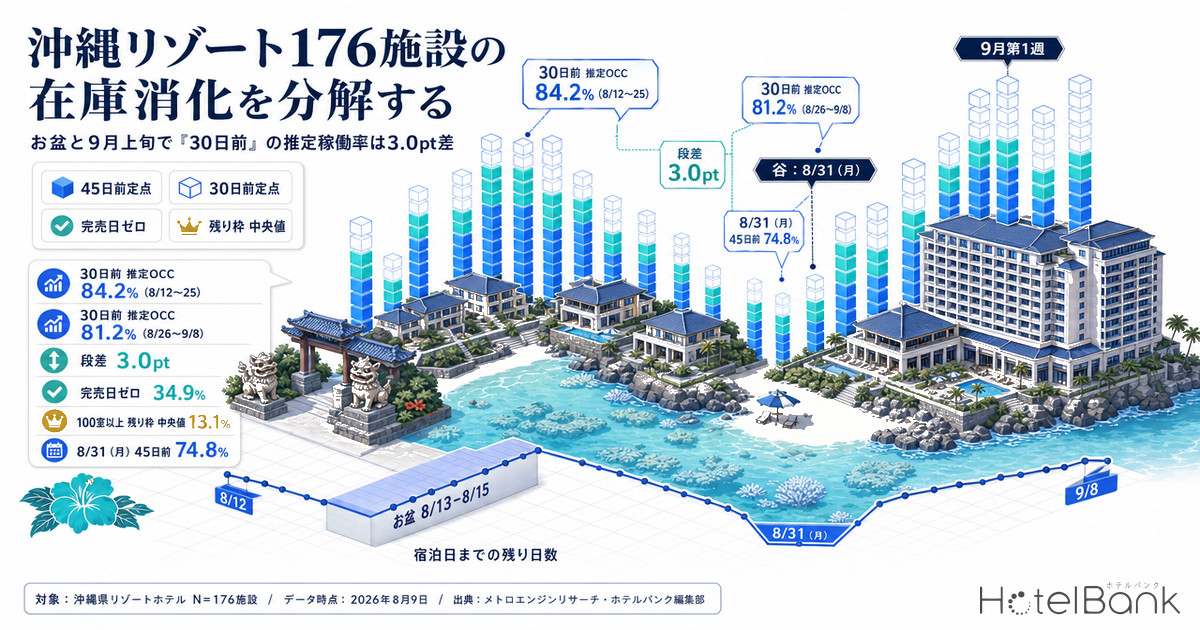
We broke down inventory absorption property by property for 176 resort hotels in Okinawa, covering stays from August 12 to August 25, 2026. When every stay date is aligned on the same yardstick — 30 days before arrival — the estimated occupancy (based on OTA-listed inventory) for this period averages 84.2%. By contrast, stays from August 26 to September 8 come in at 81.2%, a 3.0pt step down. At the property level, 34.9% of hotels never once ran out of listed inventory across the 14 days, while 5.7% ran out on eight or more days. Even within the same prefecture and the same property type, absorption patterns diverge sharply. Break it down by size and hotels with 100 rooms or more post zero sellout days at a rate of 56.2% (n=32) — they are the hardest to sell out — yet their median remaining inventory is the lowest at 13.1%. Sellout frequency and the pace at which inventory drains are two different metrics, and conflating them will cause you to misread where your own property stands.
Scope: Okinawa resort hotels, N=176 properties (inventory absorption analysis for stays August 12–25, 2026). The booking curve draws on 209–242 observed properties. This article does not address price metrics; occupancy is an estimate based on OTA-listed inventory. Definitions appear at the end of the article. Data as of August 9, 2026.
- — 3.0pt Aligned at the same 30-days-out checkpoint, estimated occupancy is 84.2% for stays August 12–25 and 81.2% for August 26–September 8. That is virtually unchanged from the 2.9pt gap at 45 days out — the difference was set early.
- — 34.9% The share of properties that never ran out of listed inventory across the 14 days from August 12 to 25 (N=175 properties). For August 26–September 8 that rises to 64.0%, showing how much the absorption pattern swings between periods.
- — 56.2% and 13.1% Properties with 100 rooms or more record the highest share of zero sellout days at 56.2%, yet the lowest median remaining inventory at 13.1%. Sellout frequency and inventory drawdown are separate metrics; conflating them leads to misreading your own position.
- — 2.3pt The day-of-week spread in estimated occupancy for July 2026 (Saturday 93.5%, Thursday/Sunday 91.2%). Building the calendar around blocks of holiday dates such as Obon fits this market better than assuming a weekend premium.
Obon week versus early September — a 3.0pt step at the same 30-days-out mark
When comparing pace across stay dates, the easiest mistake to make is to line up nothing but “how full are we right now.” August 13 and September 5 have different numbers of days left, so putting their latest readings side by side tells you nothing. So we extracted the same days-to-arrival cross-section for every stay date and aligned everything on two fixed checkpoints: 45 days out and 30 days out.
Source: MetroEngines Research; compiled by the HotelBank Editorial Team
At the 45-days-out cross-section, the 14 days from August 12 to 25 average 81.1%, and the 14 days from August 26 to September 8 average 78.2%. The gap at that point is 2.9pt, and at 30 days out it is essentially unchanged at 84.2% versus 81.2% — 3.0pt. In other words, the gap between the two periods did not open up at the last minute; its shape was already fixed 45 days out. That reflects the stay-oriented nature of Okinawa resort demand, which builds from an early stage. How the pickup from September onward splits by property type is tracked category by category in Okinawa Late-Summer Booking Curve 2026.
By date, Thursday August 13 rose from 83.0% at 45 days out to 92.2% at the latest reading (5 days left), or +9.2pt; Friday August 14 went from 81.1% to 91.4% (+10.3pt); and Saturday August 15 from 79.7% to 90.2% (+10.5pt) — the three Obon days showed the strongest pickup. The trough is Monday August 31, at 74.8% 45 days out and 77.6% 30 days out, the only date among the 28 covered that starts from the low-to-mid 70s. The straightforward read is that weekdays in the last week of August form a stretch where demand steps down as the month turns.
| Period | Est. OCC, 45 days out | Est. OCC, 30 days out | Median remaining inventory | Properties with zero sellout days | Properties sold out 4+ days |
|---|---|---|---|---|---|
| Aug 12–Aug 25 (14 days) | 81.1% | 84.2% | 16.9% | 34.9% | 21.1% |
| Aug 26–Sep 8 (14 days) | 78.2% | 81.2% | 28.6% | 64.0% | 13.4% |
| Difference | +2.9pt | +3.0pt | −11.7pt | −29.1pt | +7.7pt |
Estimated OCC is based on 209–242 observed properties; property-level metrics use N=175 for Aug 12–25 and N=186 for Aug 26–Sep 8. Source: MetroEngines Research; compiled by the HotelBank Editorial Team
The drop-off in property-level metrics is far larger than the 3pt seen at the fixed checkpoints. Median remaining inventory is 16.9% versus 28.6%, a gap of 11.7pt, and the share of properties that never exhausted inventory over the 14 days is 34.9% versus 64.0%, a gap of 29.1pt. Put differently: behind a 3pt move in market-wide estimated occupancy, the pace at which individual properties draw down inventory differs by nearly a factor of two.
Absorption patterns at the property level — 34.9% never sold out, 5.7% sold out on 8+ days
The scope is drawn from 479 resort hotels in Okinawa: 247 showed observable inventory movement during the period, and 176 of those had listed inventory reaching at least 30% of registered rooms. Of these, one property whose average remaining inventory exceeded 100% was excluded as an outlier because its registered room count and observed inventory are inconsistent, leaving 175 properties for the distribution. To avoid mistaking a temporary delisting for a sellout, days on which inventory ran out are judged only from observations made seven or more days before the stay date.
Source: MetroEngines Research; compiled by the HotelBank Editorial Team
Ranking the 175 properties by the number of days inventory ran out across the 14 days from August 12 to 25: zero days accounts for 34.9% (61 properties), 1–3 days for 44.0% (77 properties), 4–7 days for 15.4% (27 properties), and 8 days or more for 5.7% (10 properties). Even in a period when market-wide estimated occupancy climbs toward 90%, one property in three kept rooms available throughout the 14 days. For August 26–September 8 the distribution shifts sharply to the left: zero days rises to 64.0% (119 properties) and 8 days or more falls to just 2.7% (5 properties).
This “pattern” is strongly tied to property size. Small properties with 1–29 rooms (n=91) post zero sellout days only 16.5% of the time and averaged 2.98 sold-out days out of 14. Properties with 100 rooms or more (n=32), by contrast, post zero sellout days 56.2% of the time, averaging 1.06 days. Yet median remaining inventory is 19.3% for the small tier versus 13.1% for the 100-plus tier — lower at the larger properties. The fewer the rooms, the more easily a move of one or two rooms tips a property into a full house, so whether a sellout occurs is largely a function of scale. If you want to benchmark your own absorption pace against the market, remaining inventory is a more honest yardstick than sellout days. The same framework — taking properties apart one by one to identify absorption patterns — is applied in Tokyo Aug 14: 434 Hotels, Front-Loaded 10.8% vs Late-Surge 9.4%.
| Size (registered rooms) | Properties | Median remaining inventory | Zero sellout days | Sold out 4+ days | Avg. sellout days |
|---|---|---|---|---|---|
| 1–29 rooms | 91 | 19.3% | 16.5% | 28.6% | 2.98 days |
| 30–99 rooms | 52 | 18.0% | 53.8% | 15.4% | 1.52 days |
| 100 rooms or more | 32 | 13.1% | 56.2% | 9.4% | 1.06 days |
Stays August 12–25, 2026; N=175 properties. Source: MetroEngines Research; compiled by the HotelBank Editorial Team
The distribution of remaining inventory itself is wide. Across the 175 properties, the first quartile is 11.1%, the median 16.9%, and the third quartile 30.0% — nearly a threefold gap between the top and bottom quarters. The fact that prefecture-wide estimated occupancy approaches 90% is merely what that dispersion looks like after it has been flattened into an average.
Reading the booking curve at three checkpoints: 45 days out, 30 days out, and now
The difference in character between the two periods becomes even clearer when booking curves for individual stay dates are overlaid. The chart below plots estimated occupancy from 45 days out to the latest reading for three dates: Thursday August 13 during Obon, Saturday August 22 the following week, and Saturday September 5. For how to translate these three checkpoints directly into daily operations, Okayama Booking Curves: 3 Checkpoints lays out the framework based on observed data.
Source: MetroEngines Research; compiled by the HotelBank Editorial Team
August 13 runs 83.0% at 45 days out, 86.9% at 30 days out, and 92.2% at the latest reading (5 days left). August 22 runs 81.4%, 84.4%, and 87.8% (14 days left). September 5 runs 79.5%, 83.6%, and 84.1% (28 days left). All three added 3.0–4.1pt between 45 and 30 days out, so there is no meaningful difference in slope. What separates them is the height of the starting point: August 13 and September 5 were 3.5pt apart at 45 days out. The read here is that the outcome is decided by level, not by the shape of the curve.
The share of properties with no confirmable listed inventory (estimated sellout rate) lines up in the same order. At the latest reading, August 13 at 33.9%, August 12 at 30.3%, and August 14 at 27.8% occupy the top three days, while August 23 onward hovers around 12% and early September runs 7–12%. With Sunday August 16 at 15.6% as the dividing line, demand steps down once Obon ends.
As a recent benchmark, estimated occupancy for Okinawa resort hotels in July 2026 averaged 91.7% for the month (229–245 properties observed per day). By day of week, Saturday is highest at 93.5% and Thursday and Sunday lowest at 91.2%. That spread is just 2.3pt — there is none of the pronounced weekday-weekend peak-and-trough pattern seen in urban business demand. The character of resort demand, with longer stays and less concentration on weekends, shows up directly in the numbers. In the August 12–25 absorption data as well, the highest sellout rates fall on Obon weekdays rather than Saturdays, so this is best treated as a market where calendar dates outrank days of the week.
For revenue managers running Okinawa resort hotels — implications and an action plan
1. Benchmark your own pace against the market at the same days-to-arrival. The market checkpoints are 81.1% at 45 days out and 84.2% at 30 days out (Aug 12–25), and 78.2% and 81.2% respectively (Aug 26–Sep 8). Comparing only the latest values across different dates makes the difference in days remaining look like a performance gap. Record your own booking position per stay date as “x% at 45 days out” and “x% at 30 days out,” and align it with these two checkpoints.
2. Measure your position by remaining inventory, not sellout days. Among properties with 100 rooms or more, 56.2% — a majority — record zero sellout days, yet their median remaining inventory is the lowest at 13.1%. The larger the property, the more “not selling out” is structural rather than evidence of slow absorption. Matching your own figures for the same date range against the market medians of 16.9% (Aug 12–25) and 28.6% (Aug 26–Sep 8) gives a reading much closer to reality.
3. There is a case for treating late-August weekdays as a standalone trough. Monday August 31 had the weakest start of the 28 dates covered, at 74.8% 45 days out and 77.6% 30 days out. Rather than lumping it into the same operating calendar as Obon, there is room to separate it from the first weekend of September (September 5 was at 83.6% 30 days out) and design inventory and conditions for it as an independent segment.
4. Build the calendar around calendar dates rather than days of the week. The day-of-week spread in estimated occupancy for July 2026 was only 2.3pt (Saturday 93.5%, Thursday/Sunday 91.2%), and for August 12–25 the highest sellout rates again fell on Obon weekdays. Designing inventory and minimum-stay rules around blocks of holiday dates — consecutive holidays, Obon — fits this market better than a weekday/weekend split.
| Time horizon | Move | Decision trigger (figures from this article) | Objective |
|---|---|---|---|
| Today–this week | Take stock of remaining inventory for the rest of Obon (Aug 12–16) on a day-by-day basis | The latest sellout rate falls 18.3pt in three days, from 33.9% on Aug 13 to 15.6% on Aug 16 | Handle remaining rooms differently on the strongest demand days versus the fading ones |
| Today–this week | Re-tabulate your own remaining inventory using the same method as the market median | Market remaining inventory for Aug 12–25 is 16.9% at the median and 30.0% at the third quartile | Determine whether you sit in the top 25% or the bottom, with size effects stripped out |
| Within two weeks | Review daily inventory allocation for Aug 26–Sep 8 date by date instead of applying one rule across the month | Estimated OCC at 30 days out is 77.6% for Monday Aug 31 versus 83.6% for Saturday Sep 5 — a 6.0pt gap | Avoid sitting on inventory on trough days while holding rooms back on peak days |
| Within two weeks | Institutionalize recording your own pace at 45 and 30 days out for every stay date | The market added 3.0–4.1pt from 45 to 30 days out on all three dates examined | Avoid the days-remaining illusion created by comparing only the latest values |
| Looking to next month | Redesign early-September selling conditions starting from the 45-days-out level | Aug 26–Sep 8 sits at 78.2% at 45 days out, 2.9pt below the 81.1% for Aug 12–25 | Recognize the gap in starting point early and avoid last-minute course correction |
| Looking to next month | Restructure calendar segments around calendar dates rather than days of the week | The day-of-week spread in July 2026 was 2.3pt (Saturday 93.5%, Thursday/Sunday 91.2%) | Align a design premised on a weekend premium with how this market actually behaves |
Source: MetroEngines Research; compiled by the HotelBank Editorial Team
Conclusion — three yardsticks
This analysis distills the reading of Okinawa resort inventory into three yardsticks. First, align on fixed checkpoints. Line the data up at the same days-to-arrival — 45 days out and 30 days out — and the gap between August 12–25 and August 26–September 8 is a stable 2.9pt and 3.0pt, clearly distinct from the apparent gap you see when looking only at the latest values. Second, separate sellouts from remaining inventory. The share of properties with zero sellout days swings in opposite directions by size — 16.5% for 1–29 rooms versus 56.2% for 100 rooms or more — yet the median remaining inventory reverses the order at 19.3% versus 13.1%. Third, put calendar dates first. The day-of-week spread in July 2026 was only 2.3pt, and the highest August sellout rates fell on Obon weekdays. Simply carrying these three points into your own pace-tracking sheet makes market comparison considerably easier to read.
About the data
| Item | Detail |
|---|---|
| Definition of estimated OCC | Occupancy on an OTA-listed-inventory basis = 100 − 100 × rooms remaining on OTAs ÷ total rooms. It is an estimate based on how listed OTA inventory is absorbed, and its definition differs from actual room occupancy (it reads higher). This article labels it “estimated OCC (OTA-listed inventory basis).” |
| Booking curve | Based on observations from 45 days before the stay date through the latest reading. Cross-sections with extremely few observed properties (fewer than 150) were excluded. Scope is stays from August 12 to September 8, 2026, with 209–242 properties observed. |
| Sellout rate | The estimated share of properties whose listed inventory cannot be confirmed on OTAs and similar channels. At the property level, days on which inventory ran out are judged only from observations made seven or more days before the stay date and within 45 days out, to avoid confusing a sellout with a temporary delisting. |
| Breakdown of N | Stays August 12–25, 2026: 479 Okinawa resort hotels → 247 with observable inventory movement → 176 with listed inventory reaching at least 30% of registered rooms → 175 after excluding one outlier whose average remaining inventory exceeded 100%. Stays August 26–September 8, 2026: 478 → 245 → 190 → 186 after excluding four outliers. Data was retrieved split by municipality, and we confirmed the returned record counts did not hit the cap. For July 2026, 229–245 properties were observed per day. |
| Data date | Data as of August 9, 2026 (latest observation August 8, 2026). Because selling conditions and inventory change daily, the figures in this article are a snapshot at the time of retrieval. |
Source: MetroEngines Research; compiled by the HotelBank Editorial Team
■ Data source
We accumulated daily observations of publicly listed OTA inventory and registered room counts, and aggregated Okinawa resort hotels split by municipality. The scope covers inventory absorption for stays from August 12 to September 8, 2026, plus actual results for July 2026. The latest observation is August 8, 2026. Property names are not disclosed; only distributions and summary statistics are presented.
■ Calculation assumptions
For each stay date we aligned cross-sections by days remaining and compared three fixed checkpoints: 45 days out, 30 days out, and the latest reading. Property-level aggregation is limited to properties whose listed inventory reached at least 30% of registered rooms, and properties whose average remaining inventory exceeded 100% were excluded as inconsistencies between registered rooms and observed inventory. Days on which inventory ran out are judged only from observations made seven or more days before the stay date and within 45 days out, to avoid confusing a sellout with a temporary delisting.
■ Limitations and caveats
Occupancy is an estimate on an OTA-listed-inventory basis; its definition differs from actual room occupancy and it reads higher. Inventory not offered on OTAs, and temporary delistings, cannot be captured. Because the number of observed properties varies from 209 to 242 across cross-sections, small day-to-day movements include shifts in the underlying sample. Prices and rates are outside the scope of this article. The figures are a snapshot at the time of retrieval and will change with subsequent selling conditions.
Related reading
- Okinawa Late-Summer Booking Curve 2026: Sep 5 Beats Obon, City +4.7pt
- Okinawa Resort Obon 2026 Booking Pace — 67-Room Property Hits LT70 Sellout
- Obon T-7: Kyushu’s 31.7pt Gap — Fukuoka 73.0%, Kagoshima 41.3%
- Tokyo Aug 14: 434 Hotels, Front-Loaded 10.8% vs Late-Surge 9.4%
- Okayama Booking Curves: 3 Checkpoints, Aug 8 Late-Surges +11.8pt
- Nagano Late-Summer Booking Curve 2026: Ryokan -11.8pt at 45 Days Out
- Hyogo Booking Curves: 3.6x Pickup Gap, Ryokan Sellout Rate 28.4%