

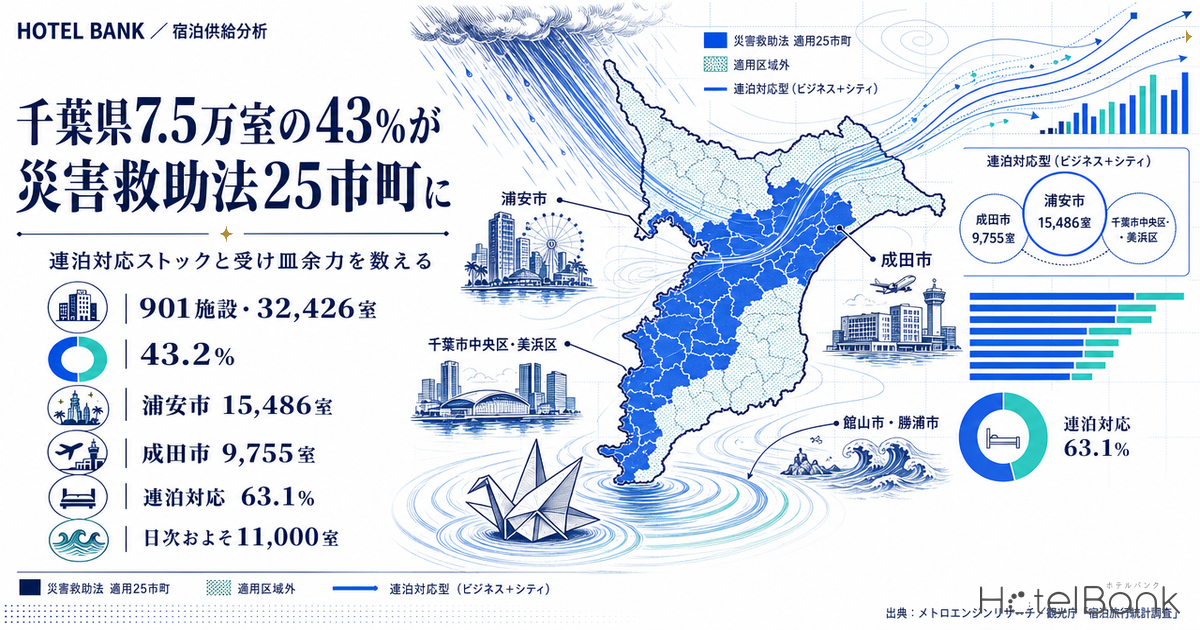
Following the record heavy rainfall that began on August 13, 2026, the Disaster Relief Act was applied to 25 municipalities in Chiba (Chiba City plus 24 other cities and towns). Our thoughts are with everyone affected. Rather than tallying the scale of the damage, this article quantifies how far Chiba’s accommodation supply can absorb the “somewhere to stay” demand that will arise through the emergency and recovery phases ahead. The conclusion first: the 25 municipalities under the Disaster Relief Act hold 901 properties and 32,426 rooms — 43.2% of the prefecture’s room stock — yet Urayasu and Narita alone, both outside the designated area, concentrate 25,241 rooms (33.6% of the prefecture). The center of gravity of supply lies outside the affected zone.
- — The 25 Chiba municipalities designated under the Disaster Relief Act hold 901 properties and 32,426 rooms — 43.2% of the prefecture’s 75,065 rooms.
- — Yet the center of gravity of supply sits outside the designated area. Urayasu (15,486 rooms) and Narita (9,755 rooms) alone account for 33.6% of the prefecture.
- — Room stock inside the designated area skews urban: extended-stay-capable properties (business + city hotels) make up 63.1%, or 20,455 rooms — well matched to recovery-phase demand.
- — Daily vacant-room headroom implied by occupancy rates by property type comes to roughly 5,500 rooms across the 25 designated municipalities (sensitivity range 3,500–7,600 rooms), and around 11,000 rooms prefecture-wide.
- — After the 2019 Boso Peninsula Typhoon, business hotel occupancy ran +4.0 pt year on year on a September–December average. Demand peaked not immediately after the disaster but one to three months later, and held for more than three months.
Metric Definitions and Data Standards Used in This Article
- Room-count basis: All room and property counts in this article are built up at the municipal level from individual-property records held by MetroEngines Research (Chiba total: 2,308 properties / 75,065 rooms). The same data platform also holds a separately maintained prefecture-level aggregate, but because the underlying population differs, the two are not mixed in this article.
- Coverage: These are tallies within MetroEngines Research’s coverage, not a complete census. Because the starting point is properties with a listing history on OTAs and similar channels, unlisted small ryokan, minshuku and simple accommodations are excluded. There is also a structural effect whereby vacation rentals, whole-house rentals and single-room properties inflate the property count (for example, Tateyama has 208 properties but only 1,960 rooms — an average of 9.4 rooms per property). Property counts and room counts must always be read together.
- OCC (occupancy rate / Japan Tourism Agency basis): Room occupancy rate by prefecture and accommodation type from the Japan Tourism Agency’s “Overnight Travel Statistics Survey.” Used for long-run trends and comparisons across property types.
- OCC (occupancy rate / our estimate): The share of sold rooms against total rooms in an area (an estimate based on OTA sales inventory). Used only to gauge recent supply-demand conditions at the municipal level; never calculated for individual properties.
- ADR (average daily rate): An estimated settled rate (tax-exclusive equivalent) derived by applying property-type correction coefficients to the lowest publicly listed plan level on OTAs (per room, double occupancy, tax-inclusive). Cross-checked against property-level results disclosed by listed hotel REITs, the median error is approximately 7%. These are estimates and differ from each property’s actual transacted prices and accounting figures. Area-level ADR is the median across the properties covered (the level of a typical property in that area).
- Data sources: MetroEngines Research; Japan Tourism Agency, “Overnight Travel Statistics Survey”
43% of the Prefecture’s Rooms Sit in the 25 Designated Municipalities — But the Center of Gravity Is Outside
The municipalities designated by Chiba Prefecture comprise Chiba City (which carries out relief itself in place of the prefecture) plus Ichikawa, Funabashi, Tateyama, Matsudo, Mobara, Sakura, Togane, Narashino, Kashiwa, Ichihara, Yachiyo, Abiko, Kamagaya, Yotsukaido, Yachimata, Inzai, Shiroi, Oamishirasato, Shirako and Nagara — 20 municipalities in all — with Tomisato, Sanmu, Shisui and Kujukuri added subsequently, for a total of 25.
Building up the accommodation properties located in these 25 municipalities from MetroEngines Research data gives 901 properties and 32,426 rooms. Against the prefecture as a whole (2,308 properties / 75,065 rooms), that is 39.0% of properties and 43.2% of rooms. On the numbers alone, “just over 40% of the prefecture falls inside the affected area” — but the geographic center of gravity of supply lies outside it.
The largest stock outside the designated area is Urayasu, with 53 properties and 15,486 rooms — 20.6% of the entire prefecture on its own. Narita follows with 71 properties and 9,755 rooms (13.0%). These two cities together account for 124 properties and 25,241 rooms, or 33.6% of the prefecture’s rooms. In other words, one in three rooms in Chiba sits in a city that has not been designated under the Disaster Relief Act. Both cities either border the affected municipalities or lie roughly 30 minutes to an hour away by car, putting them in a position to function as hinterland absorbing stay demand through the emergency and recovery phases.
Source: MetroEngines Research; compiled by the HotelBank Editorial Team (top 18 municipalities by room count out of 2,308 properties / 75,065 rooms in Chiba)
At the municipal level, the top ranks are held by Urayasu and Narita — both outside the designated area — alongside the urban cores inside it: Chiba City’s Chuo Ward (84 properties / 6,959 rooms) and Mihama Ward (19 properties / 4,865 rooms). By contrast, cities in the southern Boso Peninsula such as Minamiboso (277 properties / 2,651 rooms), Kamogawa (136 properties / 2,496 rooms) and Tateyama (208 properties / 1,960 rooms) have high property counts but small average scale. Minamiboso averages 9.6 rooms per property and Tateyama 9.4, with vacation rentals, minshuku and small ryokan making up the bulk. Looking only at property counts makes southern Boso appear to be the center of supply; recounting by rooms changes the picture entirely.
Source: MetroEngines Research; compiled by the HotelBank Editorial Team (circle size = room count; blue = the 25 municipalities designated under the Disaster Relief Act, gray = outside the designated area)
Rooms in the Designated Area Are Urban — Extended-Stay-Capable Stock Is 63%
Measuring absorption capacity requires looking not just at room counts but at the mix of property types. Stays generated in the recovery phase center on work-purpose extended stays — construction, infrastructure restoration, damage assessment, administrative support — plus medium-term stays by residents unable to return home. The formats that fit this demand are business and city hotels, which are room-only by default and can handle single occupancy and consecutive nights. Ryokan and resort hotels built around two meals a day are, by contrast, a poor fit for long stays on both rate and operational grounds.
Source: MetroEngines Research; compiled by the HotelBank Editorial Team (2,308 properties / 75,065 rooms in Chiba)
Broken down by property type, of the 32,426 rooms in the 25 designated municipalities, business hotels account for 157 properties and 13,701 rooms and city hotels for 32 properties and 6,754 rooms — 189 properties and 20,455 rooms combined, or 63.1% of rooms inside the designated area. The fact that supply in the affected zone skews urban and business-oriented is good news for absorption capacity: extended-stay inventory sits thickly close to where the demand actually arises.
The 42,639 rooms outside the designated area have a markedly different composition: city hotels at 31 properties / 10,683 rooms, resort hotels at 63 properties / 8,742 rooms, business hotels at 90 properties / 8,248 rooms, deluxe hotels at 8 properties / 3,862 rooms, and ryokan at 228 properties / 3,824 rooms. It breaks into three clusters — the large theme-park-adjacent hotels of Urayasu, the airport hotels of Narita, and the coastal resorts and ryokan of the Boso Peninsula. Business and city hotels outside the designated area total 121 properties and 18,931 rooms, which is substantial depth in its own right.
Prefecture-wide, extended-stay-capable stock (business + city) comes to 310 properties and 39,386 rooms, or 52.5% of Chiba’s rooms. Adding capsule hotels brings a further 17 properties and 1,444 rooms inside the designated area alone. In sheer numbers, the vessel prepared for recovery-phase stay demand is by no means thin.
Where the Absorption Stock Sits — About 10,000 Rooms in Chiba City’s Chuo and Mihama Wards
Ranking extended-stay-capable rooms (business + city) by municipality within the 25 designated areas, the concentration in the top two is striking.
| Municipality (Disaster Relief Act designated) | Extended-stay-capable properties | Extended-stay-capable rooms | Total rooms in municipality | Extended-stay share |
|---|---|---|---|---|
| Chiba City, Chuo Ward | 49 | 5,783 | 6,959 | 83.1% |
| Chiba City, Mihama Ward | 13 | 4,157 | 4,865 | 85.4% |
| Kashiwa | 17 | 2,100 | 2,704 | 77.7% |
| Ichihara | 19 | 1,658 | 2,616 | 63.4% |
| Funabashi | 17 | 1,279 | 2,587 | 49.4% |
| Inzai | 6 | 981 | 999 | 98.2% |
| Ichikawa | 9 | 976 | 1,481 | 65.9% |
| Matsudo | 10 | 597 | 1,047 | 57.0% |
| Sakura | 5 | 412 | 460 | 89.6% |
| Mobara | 9 | 409 | 532 | 76.9% |
| Tateyama | 7 | 377 | 1,960 | 19.2% |
| Yachiyo | 4 | 372 | 473 | 78.6% |
| Other 18 municipalities | 24 | 1,354 | 5,743 | 23.6% |
| 25 designated municipalities, total | 189 | 20,455 | 32,426 | 63.1% |
Source: MetroEngines Research; compiled by the HotelBank Editorial Team (extended-stay-capable = business hotels + city hotels; N=901 properties / 32,426 rooms)
Chuo Ward and Mihama Ward (Makuhari New City) alone hold 9,940 rooms — 48.6% of the extended-stay-capable stock inside the designated area. Kashiwa follows with 2,100 rooms, then Ichihara with 1,658 and Funabashi with 1,279. Inzai is worth noting: of its 8 properties and 999 rooms, 981 (98.2%) are extended-stay-capable. Backed by clusters of logistics facilities and data centers, business-demand hotels are concentrated there, giving it an unusually work-specialized composition relative to its room scale.
Tateyama, on the other hand, has 1,960 rooms citywide but only 7 properties and 377 rooms (19.2%) that are extended-stay-capable. The same holds for coastal areas such as Kujukuri, Shirako and Sanmu, where ryokan, minshuku and vacation rentals dominate, leaving them structurally thin as absorption capacity for work-purpose medium-to-long stays. For affected coastal municipalities, it is more realistic to plan around coordination with inland business-format stock in Chiba City, Ichihara and Mobara than to try to contain absorption within their own boundaries.
Where the Headroom Is — Estimating Absorption Capacity from Occupancy by Property Type
Having stock and actually having it vacant are two different things. Room occupancy rates by accommodation type for Chiba from the Japan Tourism Agency’s “Overnight Travel Statistics Survey” (May 2026, the latest published month) show sharply divergent levels across property types.
| Accommodation type | Chiba room occupancy (May 2026) |
Vacancy rate | Rooms in the 25 designated municipalities | Approx. daily vacant rooms |
|---|---|---|---|---|
| Business hotels | 76.0% | 24.0% | 13,701 | approx. 3,300 rooms |
| City hotels | 67.0% | 33.0% | 6,754 | approx. 2,200 rooms |
| Resort hotels | 85.2% | 14.8% | 1,657 | approx. 250 rooms |
| Ryokan | 40.3% | 59.7% | 1,752 | approx. 1,050 rooms |
| Simple accommodations | 29.4% | 70.6% | — | — |
| Company / organization lodging houses | 15.6% | 84.4% | — | — |
| Chiba, all types | 67.4% | 32.6% | 32,426 | — |
Source: Japan Tourism Agency, “Overnight Travel Statistics Survey” (May 2026, second preliminary release); room counts from MetroEngines Research; compiled by the HotelBank Editorial Team
One caveat matters here: the occupancy rates are prefecture-wide averages, while the room counts are our own build-up for the 25 designated municipalities. Multiplying two figures with different underlying populations yields an approximation, not a precise vacancy count. It should be read as a way to grasp orders of magnitude.
On that basis, the extended-stay-capable stock (business + city) in the 25 designated municipalities alone implies roughly 5,500 vacant rooms per day. Applying the same vacancy rates to the 18,931 rooms of the same types outside the designated area adds about 5,500 more, putting prefecture-wide extended-stay-capable vacancy on the order of 11,000 rooms per day. That is a level capable of absorbing several thousand recovery workers and support staff for the months before emergency temporary housing construction gets fully under way.
By property type, the largest headroom sits with company and organization lodging houses at 15.6% occupancy (Japan Tourism Agency, “Overnight Travel Statistics Survey,” May 2026, Chiba) and simple accommodations at 29.4%. Both tend to carry low room rates and offer self-catering and shared facilities, giving them a natural affinity with long stays. Ryokan also have considerable headroom at a 59.7% vacancy rate, and if their two-meals-included product design can be reworked into room-only or breakfast-only formats, they become a significant resource. The scope for that reworking is borne out by the 2019 record discussed below.
Looking at recent municipal-level supply and demand through our own estimated occupancy, the clearest headroom inside the designated area is in Chiba City’s Mihama Ward. Aggregating the days observed between May and July 2026, city hotels in Mihama (7 properties / 3,509 rooms) show estimated occupancy of 66.7% (4 observation days), and the ward overall 69.6% (4 observation days, 12 properties) — clearly below Chuo Ward’s 94.8% (10 observation days, 32 properties) and Urayasu’s 98.2% (14 observation days, 35 properties). Outside the designated area, business hotels in Narita (11 properties / 2,906 rooms) at 80.9% (5 observation days) have relatively more room than other major business-format areas in the prefecture. City hotels in Kashiwa came in at 80.7% (6 observation days, 4 properties). None of these are definitive given the small number of observation days, but Makuhari New City and Narita emerge as the candidates where sizeable room blocks would be easiest to secure.
Absorption Capacity Under Alternative Occupancy Assumptions — A Two-Axis Sensitivity
The approximation above is a point estimate that fixes occupancy at the May 2026 prefecture average, and it will swing with the season and with post-disaster demand itself. The table below shows how far absorption capacity moves when those assumptions are varied, expressed as daily vacant rooms against the extended-stay-capable stock of the 25 designated municipalities (business 13,701 rooms; city 6,754 rooms).
| Business occupancy \ City occupancy | 57% | 62% | 67% | 72% | 77% |
|---|---|---|---|---|---|
| 66% | 7,600 rooms | 7,200 rooms | 6,900 rooms | 6,500 rooms | 6,200 rooms |
| 71% | 6,900 rooms | 6,500 rooms | 6,200 rooms | 5,900 rooms | 5,500 rooms |
| 76% | 6,200 rooms | 5,900 rooms | 5,500 rooms | 5,200 rooms | 4,800 rooms |
| 81% | 5,500 rooms | 5,200 rooms | 4,800 rooms | 4,500 rooms | 4,200 rooms |
| 86% | 4,800 rooms | 4,500 rooms | 4,100 rooms | 3,800 rooms | 3,500 rooms |
Source: MetroEngines Research (room stock) and Japan Tourism Agency, “Overnight Travel Statistics Survey” (mid-case occupancy assumption = May 2026); estimated by the HotelBank Editorial Team. The shaded cell is the mid case used in the text.
Against roughly 5,500 rooms in the mid case (business 76%, city 67%), a 5 pt rise in both occupancy rates narrows it to about 4,800 rooms, and a 10 pt rise to about 4,100. Conversely, a 5–10 pt decline to off-season levels widens it to roughly 6,200–6,900 rooms. Across the full grid the range runs from about 3,500 rooms to about 7,600 rooms, so the plausible absorption capacity is best treated as this band rather than as the single point of “5,500 rooms.” Applying the same assumption range to the prefecture’s 39,386 extended-stay-capable rooms gives roughly 7,100 to 15,000 rooms per day.
There are two practical implications. First, even on the pessimistic side (occupancy running high), the 25 designated municipalities alone retain roughly 3,500 rooms per day, so a few hundred support staff and recovery workers can be absorbed within the designated area. Second, beyond that scale — or where a single property is blocked for consecutive stays of a month or more — even the mid case ties up a substantial share of in-area inventory, making combined use of out-of-area stock including Urayasu and Narita a prerequisite.
The 2019 Record — Recovery Demand Went to Business Hotels, and Lasted More Than Three Months
On September 9, 2019, the landfall of the Boso Peninsula Typhoon (Typhoon No. 15, Faxai) left Chiba with power outages lasting up to about two weeks and widespread housing damage. How accommodation demand moved at that time is the most instructive record available for anticipating the recovery phase now.
Tracking the year-on-year change in room occupancy by accommodation type for Chiba in the Japan Tourism Agency’s “Overnight Travel Statistics Survey” reveals sharply different movements by property type.
Source: Japan Tourism Agency, “Overnight Travel Statistics Survey”; compiled by the HotelBank Editorial Team (Chiba, monthly 2019 room occupancy versus the same month of 2018)
From January through August, before landfall, the year-on-year change in Chiba’s business hotel occupancy averaged +0.7 pt — essentially flat. Then came +3.9 pt in September, the month of landfall, +5.7 pt in October, +1.8 pt in November and +4.5 pt in December, widening to a +4.0 pt average across the four months from September. In absolute terms, October occupancy rose from 72.7% to 78.4%.
Over the same period, ryokan came in at -2.1 pt in September, -1.8 pt in October and -0.5 pt in December, and simple accommodations at -5.9 pt, -5.8 pt and -7.6 pt respectively — all below the prior year. City hotels were roughly flat at +0.9 pt in September, +1.8 pt in October, -1.0 pt in November and -0.8 pt in December. In other words, business hotels were the only type whose occupancy lifted after the disaster; leisure-oriented formats actually fell as tourism demand receded.
Company and organization lodging houses stand out in another way. Against 24.0% in September 2018, September 2019 came in at 48.6% — a surge of +24.6 pt, consistent with corporate and institutional retreat facilities being pressed into service as accommodation for recovery workers. Because the occupancy level itself is low, this is easily overlooked, but it is worth noting as a channel that can scale up quickly in an emergency.
Total guest nights point the same way. Isolating Japanese guest nights to strip out inbound effects, and comparing year-on-year growth for Chiba against the national figure, gives the following.
Source: Japan Tourism Agency, “Overnight Travel Statistics Survey”; compiled by the HotelBank Editorial Team (Japanese guest nights, year-on-year change)
From January through August, before the typhoon, growth in Chiba’s Japanese guest nights ran an average of +4.4 pt above the national average. In April, with its ten-day holiday run, Chiba was +24.9% against +17.3% nationally — it was already a strong year for the prefecture. After the typhoon, from September through December, that gap widened to an average of +8.0 pt. December in particular saw Chiba at +20.4% against +5.7% nationally, a spread of +14.7 pt. In September, immediately after landfall, the gap was only +1.8 pt — showing that demand first dipped on power outages, property damage and tourist cancellations, before recovery-related stays accumulated from October onward.
Three implications follow from the 2019 pattern. First, recovery demand shows up concentrated in one particular property type: business hotels. Second, the peak comes not immediately after the event but one to three months later. Third, that level persists for more than three months. In the current heavy-rain disaster too, demand can be expected to shift toward inland business-format hotels from September through November. One caveat: October 2019 also saw the East Japan Typhoon (Typhoon No. 19, Hagibis) and heavy rain on October 25, so the figures from that period contain overlapping recovery from multiple disasters and should be discounted accordingly.
Making Absorption Capacity Work — Agreements and Extended-Stay Product Design
Stock and headroom mean nothing as absorption capacity without a route by which they reach affected residents and recovery workers. This is where the “agreements on the provision of accommodation facilities in times of disaster,” concluded between prefectures and their ryokan and hotel sanitation trade associations, come into play.
Chiba has concluded an agreement of this kind with the Chiba Prefecture Ryokan and Hotel Sanitation Trade Association, establishing a framework under which ryokan and hotel rooms can be provided as evacuation shelters in a large-scale disaster for affected people requiring special consideration — the elderly, people with disabilities and others — for whom shelter living is difficult. Similar agreements are being put in place nationwide, including in Aomori, Akita, Saitama and Kumamoto. Saitama operates a scheme under which information on which of the association’s 295 member properties can be used as shelters is provided to the prefecture. Kumamoto has published an “Accommodation Provision Program Manual,” going as far as standardizing the procedures. The Cabinet Office has also issued “Guidelines for Using Hotels, Ryokan and Similar Facilities as Evacuation Shelters in Times of Disaster,” so the institutional groundwork is steadily coming together.
For accommodation operators, joining this framework is more than a matter of social contribution. It brings stable occupancy to off-season and weekday vacancies, and it raises the standing of the property within its community. Ryokan running in the 40% occupancy range (as of May 2026, same survey) and simple accommodations below 30% in particular have scope to participate without substantially changing their existing product design.
On the product side, how well extended stays are built out determines effectiveness as absorption capacity. Recovery-phase stays have different requirements from one-night, two-meal leisure trips: room-only or breakfast-only, single occupancy, laundry facilities, accommodation of early-morning departures, parking, and bookings in two-week to one-month blocks. That business hotels were the format that grew occupancy in 2019 is precisely because they already met these requirements. For ryokan and simple accommodations, preparing room-only plans and setting extended-stay rates opens up access to the same demand pool.
Price levels are also worth noting. According to MetroEngines Research, Chiba’s estimated settled ADR stood at approximately ¥9,300 as of July 2026 (N=420 properties), and has moved in a range of roughly ¥9,000–¥11,200 over the trailing 12 months. The prefecture has deep urban mid-price stock, giving it a rate structure in which a reasonable set of options can be secured even within the cost standards for evacuation shelters under the Disaster Relief Act. How this rate level came to be formed is broken down on a confirmed-month year-on-year basis in Chiba Settled ADR: H1 2026 Beats Last Year, July Turns -8.2%.
Source: MetroEngines Research; compiled by the HotelBank Editorial Team (Chiba, monthly estimated settled ADR, N=319–423 properties)
A note on ADR for future dates: ADR figures for August 2026 onward are estimates based on selling prices publicly listed on OTAs and similar channels as of the survey date, and will move as the check-in date approaches. Current levels will not necessarily be realized as shown.
Conclusion — Design Absorption Capacity on the Premise of “Outside the Affected Zone”
Slicing Chiba’s accommodation supply along the Disaster Relief Act designation line reveals the following structure. The 25 designated municipalities hold 901 properties and 32,426 rooms (43.2% of the prefecture), of which 63.1% — 189 properties and 20,455 rooms — are extended-stay-capable business and city hotels. Supply in the affected zone skews urban and business-oriented, a good match for the characteristics of recovery-phase demand.
At the same time, the center of gravity of supply lies outside the zone. Urayasu’s 15,486 rooms and Narita’s 9,755 rooms alone account for 33.6% of the prefecture’s rooms, and both sit within a 30-minute to one-hour drive of the affected municipalities. Trying to contain absorption entirely within the designated area concentrates demand on the 9,940 rooms of Chiba City’s Chuo and Mihama wards. Designing the allocation with large out-of-area stock in view from the outset is the less strained approach.
After the 2019 Boso Peninsula Typhoon, Chiba’s business hotel occupancy rose +4.0 pt year on year on a September–December average, and +5.7 pt in October. Japanese guest nights grew +20.4% year on year in December (versus +5.7% nationally), with demand peaking three months after the event. The lift in occupancy concentrates in specific property types — and it lasts.
Chiba has roughly 11,000 extended-stay-capable rooms of daily vacancy headroom (an approximation multiplying the Japan Tourism Agency’s prefecture-average occupancy by the room stock within our coverage). On top of that sit still-underused layers: ryokan at 40.3% occupancy (May 2026, Japan Tourism Agency survey), simple accommodations at 29.4%, and company and organization lodging houses at 15.6%. Where the agreement framework and room-only, extended-stay product design mesh, these can be brought online as absorption capacity. For hotel operators it is an opportunity for stable occupancy; for local governments it is a resource that strengthens the practical effectiveness of evacuation and recovery planning. Accurately knowing supply — how many rooms, and where — is the first step.
Further Reading
- Chiba Settled ADR: H1 2026 Beats Last Year, July Turns -8.2%
- Kaihin-Makuhari 1,000-Room ¥30bn Mixed-Use: Breakeven ADR ¥13,200
References and Sources
■ Disaster and government information
- Chiba Prefecture, “Application of the Disaster Relief Act for the Disaster Caused by Heavy Rain from August 13, 2026” (August 2026)
- Chiba Prefecture, “On the Agreement with the Chiba Prefecture Ryokan and Hotel Sanitation Trade Association Concerning the Provision of Accommodation Facilities in Times of Disaster”
- Cabinet Office, “Guidelines for Using Hotels, Ryokan and Similar Facilities as Evacuation Shelters in Times of Disaster”
- Kumamoto Prefecture, “Accommodation Provision Program Manual for Times of Disaster”
- Aomori Prefecture, “Outline of the Agreement Concerning the Provision of Accommodation Facilities in Times of Disaster”
- Akita Prefecture, “We Have Concluded an ‘Agreement Concerning the Provision of Accommodation Facilities in Times of Disaster’ with the Akita Prefecture Ryokan and Hotel Sanitation Trade Association”
- Chiba Prefecture, “The 2019 Boso Peninsula Typhoon”
- Cabinet Office, “White Paper on Disaster Management 2020 — Disaster Caused by the 2019 Boso Peninsula Typhoon”
■ Government statistics
■ Data sources
Property and room counts are built up at the municipal level from individual-property records held by MetroEngines Research (Chiba total: 2,308 properties / 75,065 rooms, as of August 2026). Property-type classifications follow the same data. Room occupancy and Japanese guest nights come from the Japan Tourism Agency’s “Overnight Travel Statistics Survey,” by prefecture and accommodation type (occupancy for May 2026 = the latest published month of the second preliminary release; 2019 figures are final). Estimated settled ADR is an estimate applying property-type corrections to publicly listed OTA prices (Chiba, N=319–423 properties). The municipalities designated under the Disaster Relief Act are per Chiba Prefecture’s published materials.
■ Estimation assumptions
“Extended-stay-capable” is defined as the sum of business hotels and city hotels (an operational grouping of formats able to handle room-only, single-occupancy and consecutive-night stays). The approximate daily vacancy is calculated by applying the Japan Tourism Agency’s Chiba-average room occupancy by property type uniformly to the room counts by property type in the 25 designated municipalities within our coverage. The two-axis sensitivity (Table 3) varies that occupancy assumption across business 66–86% and city 57–77% while holding other conditions fixed — a purely arithmetic calculation in which the mid cell (76% × 67%) matches the point estimate in the text. The prefecture-wide band (7,100–15,000 rooms) applies the same occupancy range to the prefecture’s 39,386 extended-stay-capable rooms.
■ Limitations and caveats
(1) Occupancy rates are prefecture-wide averages and do not match actual occupancy by municipality or by property. Because room counts (our coverage) and occupancy rates (Japan Tourism Agency) have different underlying populations, the multiplied vacancy figures are an indication of order of magnitude, not a precise inventory count. (2) Our data starts from properties with an OTA listing history and is not a complete census. Unlisted small ryokan, minshuku and simple accommodations are excluded, and whole-house rentals and similar formats structurally inflate the property count. (3) Our municipal-level estimated occupancy rests on only 4 to 14 observation days and is not definitive. (4) The 2019 figures overlap with the East Japan Typhoon and the heavy rain of October 25 that year, so they cannot be read as the effect of the Boso Peninsula Typhoon alone. (5) Damage to and closure of properties caused by the disaster itself is not factored into these estimates, so the rooms actually available for sale may fall below the levels shown here.
■ Market data
- MetroEngines Research — room counts and property-type classifications for 2,308 properties / 75,065 rooms in Chiba, estimated occupancy by municipality, and estimated settled ADR (N=319–423 properties)