

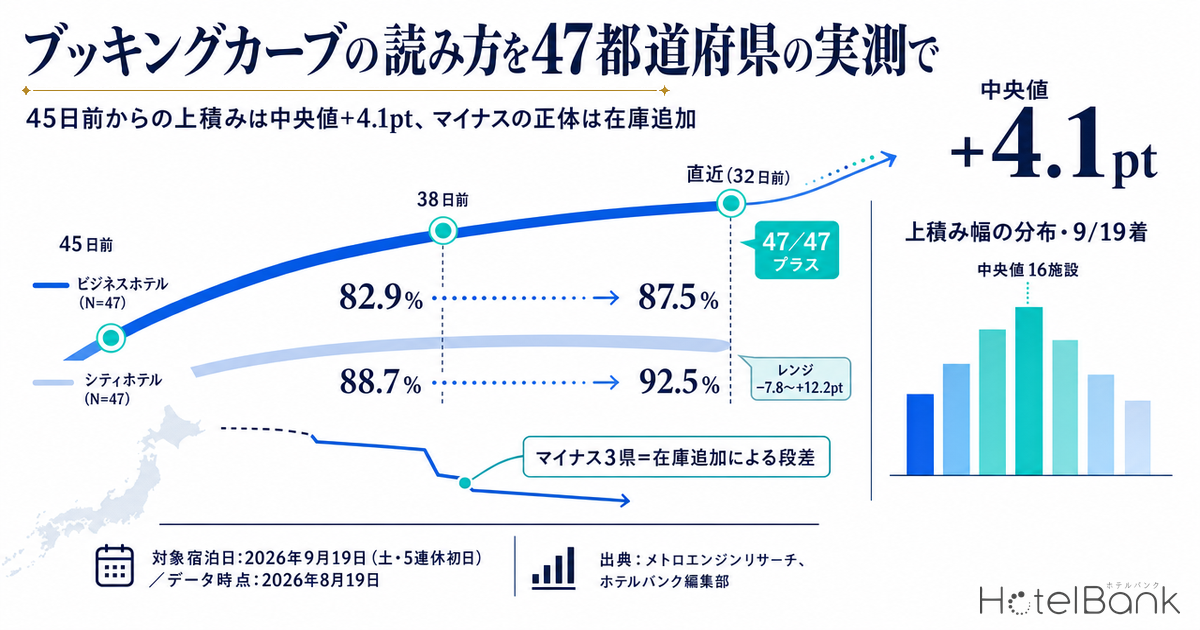
A booking curve is not a chart you read by asking whether the line slopes upward. What matters in practice is the increment — how much has been added at the same number of days remaining — and whether that increment came from demand or from inventory being opened and closed. For stays on Saturday, September 19, 2026 (the first day of a five-day holiday weekend), estimated OCC for business hotels across all 47 prefectures moved from a median of 82.9% at 45 days out (August 5, 2026) to 87.5% at the latest cross-section (32 days out, August 18, 2026). The median prefecture-level pickup was +4.1pt, and all 47 prefectures were positive. City hotels, by contrast, posted a median pickup of +2.7pt but a far wider range of −7.8 to +12.2pt. Of the three prefectures that came in negative, Wakayama and Gunma did not see demand retreat — they saw a step change caused by listed inventory being added all at once mid-observation — while the remaining prefecture, Kagawa, was already at 100.0% and effectively sold out at 45 days out. This article uses that measured distribution to lay out what to look at, and what to decide, at three fixed checkpoints: 45 days out, 38 days out, and the latest cross-section.
Scope: business hotels across all 47 prefectures (N=47 prefecture-level aggregates) and city hotels (same, N=47 prefecture-level aggregates). Occupancy is an estimate based on OTA-listed inventory. Definitions appear at the end of this article. Data as of August 19, 2026.
- — +4.1pt: For business hotels with stays on Saturday, September 19, 2026 (first day of a five-day holiday), pickup from 45 days out to the latest cross-section (32 days out) had a prefecture-level median of +4.1pt. All 47 prefectures were positive.
- — Read level and slope separately: Business hotels in Kagawa, already 99.1% full at 45 days out, added just +0.1pt. Small pickup is not necessarily “not selling” — it can equally mean “no room left to stack.”
- — −7.8 to +12.2pt: City hotels are far more dispersed. The negative readings in Wakayama and Gunma were not demand declines but step changes, where listed inventory equal to more than 8% of total rooms was added in a single day.
- — Median of 16 properties per prefecture: The city-hotel observation base is small (minimum 3 properties), so a single property releasing allotment can move a whole prefecture’s metric by several points. Simple comparisons against the market median should be treated as reference only.
- — T-45, T-38 to T-30, and the final stretch: Use level to sort peak days from ordinary days, a seven-day window to measure pickup pace, and the final stretch to gauge absorption after a step change — three checkpoints in operation.
How many points accumulate between 45 days out and the latest cross-section
Start with the national median curve for stays on Saturday, September 19, 2026. September 22 falls between Respect for the Aged Day (September 21) and the Autumnal Equinox (September 23), making it a national holiday, so September 19 through 23 forms a five-day break (Cabinet Office, “National Holidays”). September 19 is therefore the first day of a long weekend — one of the dates where demand concentrates most reliably in the year.
Median estimated OCC for business hotels was 82.9% at 45 days out, 85.8% at 38 days out, and 87.5% at the latest cross-section of 32 days out. City hotels moved 88.7% → 91.2% → 92.5% across the same three checkpoints. For comparison, Friday, September 25 — an ordinary weekday after the holiday — moved only 71.8% → 72.9% for business hotels and 80.2% → 81.2% for city hotels over the seven days from 45 days out (August 11) to the latest 38-days-out reading (August 18). Both the level and the slope of the curve are different things on a holiday opener versus an ordinary Friday, and the contrast is immediately visible. The same pattern recurs at the prefecture level: in Nagano, a 34pt gap between a September Wednesday and the holiday opener fails to narrow even in the final stretch, as verified in Nagano September: Wed 58.7% vs Holiday Sat 93.0%, 34pt Gap Holds.
Source: MetroEngines Research; compiled by the HotelBank Editorial Team
Organized numerically, the figures are as follows. Note that pickup is calculated by first deriving each of the 47 prefectures’ own pickup and then taking the median and quartiles of that distribution — not by taking the endpoint difference of the median curve. The two do not agree.
| Stay date / hotel type | 45 days out Median estimated OCC |
38 days out Median estimated OCC |
Latest cross-section Median estimated OCC |
Pickup Median (p25–p75) |
Pickup Range |
Prefectures positive |
|---|---|---|---|---|---|---|
| Sep 19 (Sat), business | 82.9% | 85.8% | 87.5% (32 days out) | +4.1pt (+3.1 to +4.7) | +0.1 to +10.5pt | 47 / 47 |
| Sep 19 (Sat), city | 88.7% | 91.2% | 92.5% (32 days out) | +2.7pt (+1.2 to +3.6) | −7.8 to +12.2pt | 43 / 47 |
| Sep 25 (Fri), business | 71.8% | 72.9% (latest) | — | +1.1pt (+0.8 to +1.9) | 0.0 to +3.1pt | 46 / 47 |
| Sep 25 (Fri), city | 80.2% | 81.2% (latest) | — | +0.9pt (+0.3 to +1.7) | −2.4 to +3.3pt | 37 / 47 |
Source: MetroEngines Research; compiled by the HotelBank Editorial Team (N=47 prefectures per row)
The same “seven days’ worth” produces a different slope depending on the date
The two stay dates have been observed for different lengths of time, so lining up their raw pickup figures is not a valid comparison. To align them, isolate only the seven days from 45 days out to 38 days out, which both dates share. Within that window, the median prefecture-level pickup was +1.8pt for business hotels on September 19 and +1.1pt on September 25; for city hotels, +1.0pt and +0.9pt respectively.
Two things follow. First, for business hotels the holiday opener fills roughly 1.6 times faster over the same number of days remaining. It starts from a level 11pt higher and still fills faster, so judging from the absolute level at 45 days out alone — concluding “this is already full enough” — means missing the entire remaining month of upside. Second, for city hotels there is almost no difference between the two dates over the same seven-day window (+1.0pt vs +0.9pt). Concentration into the holiday opener is not as pronounced as it is for business hotels, and prefecture-level dispersion dominates instead.
By prefecture, the largest pickup for business hotels on September 19 came in Kumamoto (78.8% → 89.3%, +10.5pt), Tottori (84.3% → 92.2%, +7.9pt) and Fukui (88.4% → 95.0%, +6.6pt). The smallest came in Kagawa (99.1% → 99.2%, +0.1pt), Nara (86.4% → 87.8%, +1.4pt) and Nagasaki (85.5% → 87.2%, +1.7pt). A prefecture like Kagawa, already in the 99% range at 45 days out, has no physical headroom left to add. Small pickup can mean “there is no room left to stack” rather than “it is not selling”, so it must always be read together with the level at 45 days out.
What negative pickup really is — inventory movement, not falling demand
This is the most operationally important point in the article. Among city hotels for September 19, three of the 47 prefectures showed estimated OCC lower at the latest cross-section than at 45 days out. The curve appears to bend downward, but opening up the daily movement shows that in Wakayama and Gunma the cause was listed inventory increasing in a step on a single day, while in Kagawa the cross-section difference of −0.2pt was observational noise, since the prefecture was already at 100.0% and effectively sold out at 45 days out.
Measuring single-day increases in listed inventory as a ratio to each prefecture’s total room count in scope, business hotels for September 19 stayed at or below the equivalent of 1.3% in all 47 prefectures, and their curves progress almost monotonically. City hotels, by contrast, had a median of the equivalent of 0.4% but reached as high as the equivalent of 8.9%, with five prefectures seeing single-day increases equivalent to 2.0% or more. Two of the three prefectures with negative readings — Wakayama and Gunma — are among those five. (The third, Kagawa, was at 100.0% and effectively sold out at 45 days out, with single-day inventory increases of no more than the equivalent of 0.4%.)
Source: MetroEngines Research; compiled by the HotelBank Editorial Team
City hotels in Wakayama (7 properties observed, 830 rooms total) had held estimated OCC at 81.7% through August 7, then dropped a step to 72.8% on August 8. On that day, listed inventory equivalent to 8.9% of the prefecture’s total rooms was added at once. The number of observed properties stayed at 7 before and after. In other words, this was existing properties opening up allotment, not reservations being cancelled. Estimated OCC then held flat around 73.0% through 32 days out, so the cross-section comparison comes out at −7.8pt.
City hotels in Gunma (11 properties, 1,022 rooms) are even clearer. After building to 90.3% by August 11, inventory was added in two stages on August 12 and August 14, pulling the figure down to 75.5%. Over the following four days, however — August 14 to August 18 — it moved 75.5% → 81.1% (+5.6pt), absorbing that inventory faster than the original pace (though the number of observed properties fell from 11 to 9 over those four days, so not all of the rebound can be attributed to sales progress). Strip out the step change and demand is strong. Looking only at the −7.4pt cross-section difference and concluding that “city hotels in Gunma stalled” would be reading the facts exactly backwards.
As a contrasting case, city hotels in Mie (14 properties, 1,472 rooms) — a comparable size band — accumulated smoothly from 73.7% to 84.9% (+11.2pt) with no step change. Putting the three side by side makes the distinction visually clear: remaining inventory that declines gently is real demand being absorbed, while remaining inventory that jumps back up in a single day is inventory being added.
| Prefecture (city hotels, Sep 19 stay) | Properties observed / total rooms |
45 days out | Latest (32 days out) | Cross-section difference | Largest single-day inventory increase (vs total rooms) |
Interpretation |
|---|---|---|---|---|---|---|
| Wakayama | 7 properties / 830 rooms | 80.8% | 73.0% | −7.8pt | 8.9% (Aug 8) | One step change, flat thereafter |
| Gunma | 11 properties / 1,022 rooms | 88.5% | 81.1% | −7.4pt | 8.3% (Aug 14) | Two step changes, then +5.6pt over four days |
| Mie | 14 properties / 1,472 rooms | 73.7% | 84.9% | +11.2pt | 0.1% | No step change, smooth absorption |
Source: MetroEngines Research; compiled by the HotelBank Editorial Team
Why does this happen so readily among city hotels? The answer is the size of the observation base. For September 19 stays, business hotels had a median of 94 observed properties per prefecture, while city hotels had a median of 16 (minimum 3, maximum 99). Structurally, one property releasing a few dozen rooms is enough to move the whole prefecture’s metric by several points. For September 25 stays after the holiday, 10 prefectures showed negative cross-section differences among city hotels, and one of them — Ibaraki (16 properties, 1,823 rooms) — followed the same pattern: inventory equivalent to 3.5% of total rooms was added on August 13, dropping the figure from 66.5% to 63.0%, after which it recovered only to 63.6%.
There is a caveat in the opposite direction as well. The number of observed properties fell in all 47 prefectures between 45 days out and the latest cross-section — from a median of 94 to 77 per prefecture for business hotels, and from 16 to 14 for city hotels. Because the denominator of estimated OCC, the total rooms in scope, is held fixed, remaining rooms at properties that can no longer be confirmed as listed drop out of the aggregate, pushing estimated OCC upward by that amount. Pickup therefore contains both “rooms that were sold” and “rooms that stopped being visible because the listing ended.” This is precisely why inventory changes and changes in the number of observed properties should be checked together when interpreting curve movement.
How pickup disperses differs by hotel type
Beyond the median, the shape of the distribution is worth grasping. Counting September 19 pickup by band, business hotels cluster very sharply, with 28 of 47 prefectures (roughly 60%) in the +3 to +5pt band. Pickup proceeds at a similar pace nationwide, which makes this a segment where comparing your own pace against the market median carries real meaning.
City hotels, on the other hand, spread across all seven bands, from three prefectures in negative territory to three at +8pt or more. Even the modal band, +3 to +5pt, holds only 16 prefectures (roughly 30%). For city hotels, saying “the market added +2.7pt but we only added +1.0pt” does not tell you whether that gap is demand or the composition of the observation base. Simple comparison against the area median should be treated as reference only; basing judgment primarily on the shape of your own daily curve — smooth or stepped — is the more practical approach. As for how far pickup can spread between hotel types, a single-city measurement in Tokyo found pickup from 45 days out to the final stretch of +25.7pt for business hotels, +14.5pt for city hotels and +1.9pt for capsule hotels.
Source: MetroEngines Research; compiled by the HotelBank Editorial Team
For revenue managers running business and city hotels — implications and an action plan
(1) Evaluate the level at 45 days out and the pickup from it separately. In a market like business hotels in Kagawa, already at 99.1% at 45 days out, pickup of +0.1pt is not a stall — it is hitting the ceiling. When reading your own curve, put the level at 45 days out in the denominator first and measure progress as “how much of the remaining allotment has filled.” The higher the level on a given date, the smaller pickup will naturally appear.
(2) Peak days and ordinary days have different slopes at the same number of days remaining. Over the identical seven-day window from 45 to 38 days out, median pickup for business hotels was +1.8pt on the holiday opener and +1.1pt on the post-holiday Friday. Even when progress “looks on track at 38 days out,” a peak day should be read on the assumption that more can still be added over the remaining period, and an ordinary day on the assumption that headroom is limited — which leaves room to design pricing calendars separately for the two.
(3) When a curve turns downward, suspect inventory movement first — yours and the market’s. City hotels in Gunma show a cross-section difference of −7.4pt, yet added +5.6pt over the four days after the step change. The same shape appears at your own property whenever sellable allotment increases: room types released, group blocks returned, renovations completed. Rather than jumping from “progress rate fell” to “demand dropped,” check the inventory-side operation history before judging.
(4) Benchmarks work differently by hotel type. Business hotels form a sharp distribution with 28 of 47 prefectures in the +3 to +5pt band, which makes comparison against the market median a usable input. City hotels spread across all seven bands and have a small observation base at a median of 16 properties per prefecture, so anchoring on the shape of your own curve is more stable than the gap versus the market average.
Translated into actions at three checkpoints, this looks as follows. The time axis is aligned with the observation window used here: 45 days out, 38 to 30 days out, and the final stretch (within 30 days). The underlying idea of narrowing operations down to three checkpoints is laid out, using measured data from Okayama, in Okayama Booking Curves: 3 Checkpoints, Aug 8 Late-Surges +11.8pt.
| Timing | Action | Decision trigger (tied to figures in this article) | Objective |
|---|---|---|---|
| 45 days out | Sort target dates into “peak days” and “ordinary days” and prepare two sets of pickup assumptions for the remaining period | The holiday-opener type sits at a business-hotel median of 82.9% at 45 days out; the ordinary-Friday type at 71.8%. Which level does your own progress on that date resemble? | Allow the same progress rate to carry different meanings |
| 45 days out | Isolate dates near the ceiling early and manage them separately as candidates for pricing review | Dates where estimated OCC at 45 days out exceeds the business-hotel p75 of 88.4% | Reduce missed opportunity on dates that fill early |
| 38 to 30 days out | Record pickup over a seven-day window weekly and line it up against the market’s identical window | Median pickup from 45 to 38 days out for business hotels is +1.8pt on peak days and +1.1pt on ordinary days. Cases where your property falls below this two weeks running | Detect anomalies in pace, not level, early |
| 38 to 30 days out | On days when progress falls versus the prior day, verify changes in sellable allotment before judging demand | Cases where allotment equivalent to 2% or more of total rooms returns in a single day (5 of 47 prefectures qualified among city hotels for September 19 stays) | Avoid misreading inventory-driven step changes as falling demand |
| Final stretch (within 30 days) | Check in four- to five-day units whether pace has returned after a step change | Whether the shape resembles city hotels in Gunma, recovering +5.6pt in the four days after a step change, or Wakayama, staying flat | Gauge absorption of the added allotment before moving to the next decision |
| Final stretch (within 30 days) | For the city-hotel segment, switch to judging by the shape of your own curve rather than the gap versus the market median | Cases where the number of observed city hotels in the target area is small, on the order of a median of 16 properties | Avoid misjudgments rooted in a small observation base |
Source: MetroEngines Research; compiled by the HotelBank Editorial Team
Conclusion — three yardsticks for reading a booking curve
First, look at level and slope separately. The higher estimated OCC is at 45 days out, the smaller pickup will appear. Comparing business hotels in Kagawa (99.1% → 99.2%) and Kumamoto (78.8% → 89.3%) purely as “+0.1pt versus +10.5pt” tells you nothing. Classifying dates along the two axes of level and slope is the starting point.
Second, align on the same number of days remaining. Lining up endpoint differences of curves observed over different lengths of time is not a comparison. By aligning on the seven-day window from 45 to 38 days out, this article was able to isolate the finding that business hotels fill roughly 1.6 times faster on the holiday opener than on an ordinary Friday. That “align the window” procedure transfers directly to your own weekly review.
Third, when a curve turns downward, suspect inventory movement first. Of the three prefectures with negative cross-section differences among city hotels for September 19 stays, two had allotment equivalent to 2% or more of total rooms returned in a single day. Among business hotels, all 47 prefectures stayed at or below the equivalent of 1.3% in a single day, and all 47 posted positive pickup. The smaller the observation base of a segment or area, the more its metrics reflect inventory operations rather than demand — a premise worth holding as a reader.
About the Data
• Definition of estimated OCC: occupancy on an OTA-listed-inventory basis = 100 − 100 × rooms remaining listed on OTAs ÷ total rooms. It is an estimate based on how listed inventory sold on OTAs is being absorbed, and its definition differs from actual room occupancy (it reads higher). This article labels it “estimated OCC (OTA-listed-inventory basis).”
• Booking curves: observation points run daily from 90 days before the stay date to the day before; the section analyzed here covers 45 days out to the latest cross-section. Target stay dates are Saturday, September 19, 2026 and Friday, September 25, 2026. The latest cross-section is August 18, 2026, which is 32 days out for September 19 stays and 38 days out for September 25 stays.
• Scope and counts: two hotel types — business hotels and city hotels — aggregated for each of the 47 prefectures (N=47 prefectures per type). For September 19 stays, the number of observed properties had a median of 94 per prefecture for business hotels and 16 per prefecture for city hotels (minimum 3, maximum 99). Total rooms in scope by prefecture are based on listed properties in each prefecture.
• Calculating pickup: for each prefecture, “estimated OCC at the latest cross-section − estimated OCC at 45 days out” is derived, and the median, quartiles and range are taken from that distribution of 47 values. The median curve in the charts is the line formed by taking the median across the 47 prefectures at each point in time; the endpoint difference of that curve does not agree with the pickup figures.
• Measuring single-day inventory increases: the increase in listed remaining rooms from the prior day to the current day, divided by total rooms in scope for that prefecture. This article expresses it as “the equivalent of X% of total rooms.”
• Data as of: August 19, 2026. Sales conditions and inventory change daily, so the figures in this article are a snapshot as of the retrieval date.
References and Sources
■ Data source
From daily snapshots of OTA-listed inventory collected in-house, booking curves were retrieved for business hotels and city hotels across all 47 prefectures for stays on Saturday, September 19, 2026 and Friday, September 25, 2026 (N=47 prefectures per hotel type). Observation points run daily from 90 days before the stay date to the day before; the section analyzed here runs from 45 days out to the latest cross-section (32 days out for September 19 stays and 38 days out for September 25 stays, both August 18, 2026). The holiday calendar was confirmed against the Cabinet Office’s “National Holidays.” Data as of August 19, 2026.
■ Calculation assumptions
Estimated OCC is calculated as “100 − 100 × rooms remaining listed on OTAs ÷ total rooms in scope,” with total rooms in scope held fixed on the basis of listed properties for each prefecture and hotel type. Pickup is derived per prefecture as “latest cross-section − 45 days out,” with the median, quartiles and range taken from that distribution of 47 values (which does not agree with the endpoint difference of the curve connecting the medians at each point in time). Single-day inventory increases are the increase in listed remaining rooms from the prior day, divided by total rooms in scope. Because the observable period differs by stay date, comparisons across hotel types and across dates are aligned to the shared seven-day window from 45 to 38 days out.
■ Limitations and caveats
Estimated OCC is an estimate based on how listed inventory sold on OTAs is being absorbed, and its definition differs from actual room occupancy (it reads higher). The number of observed properties declined in every prefecture between 45 days out and the latest cross-section (business hotels from a median of 94 to 77 per prefecture, city hotels from 16 to 14), and while remaining rooms at properties that can no longer be confirmed as listed drop out of the aggregate, the denominator stays fixed — so pickup contains both sales progress and delisting. For city hotels, whose observation base is small (a median of 16 properties per prefecture, minimum 3), one property’s inventory operations can move the whole prefecture’s metric by several points, so simple comparison against the area median remains a reference value. This article also reflects measurements of two stay dates and cannot be generalized as-is to other dates or other hotel types. All figures are a snapshot as of the retrieval date.
• Cabinet Office, “National Holidays” https://www8.cao.go.jp/chosei/shukujitsu/gaiyou.html
Related Reading
- Nagano September: Wed 58.7% vs Holiday Sat 93.0%, 34pt Gap Holds
- Osaka Sep 2026 Holiday: Demand Peaks First 2 Nights, Sep 23 at 58.0%
- Silver Week 2026 Back Half at T-47: Sep 23 Matches a Normal Wednesday
- Okayama Booking Curves: 3 Checkpoints, Aug 8 Late-Surges +11.8pt
- Chiba 4 Hotel Types: 22.7pt Gap at T-45 Narrows to 16.0pt by T-21
- Hyogo Booking Curves: 3.6x Pickup Gap, Ryokan Sellout Rate 28.4%
- Tokyo Early Sep: Booking Curves at T-45/T-30/T-14, OCC 76.0-81.5%