

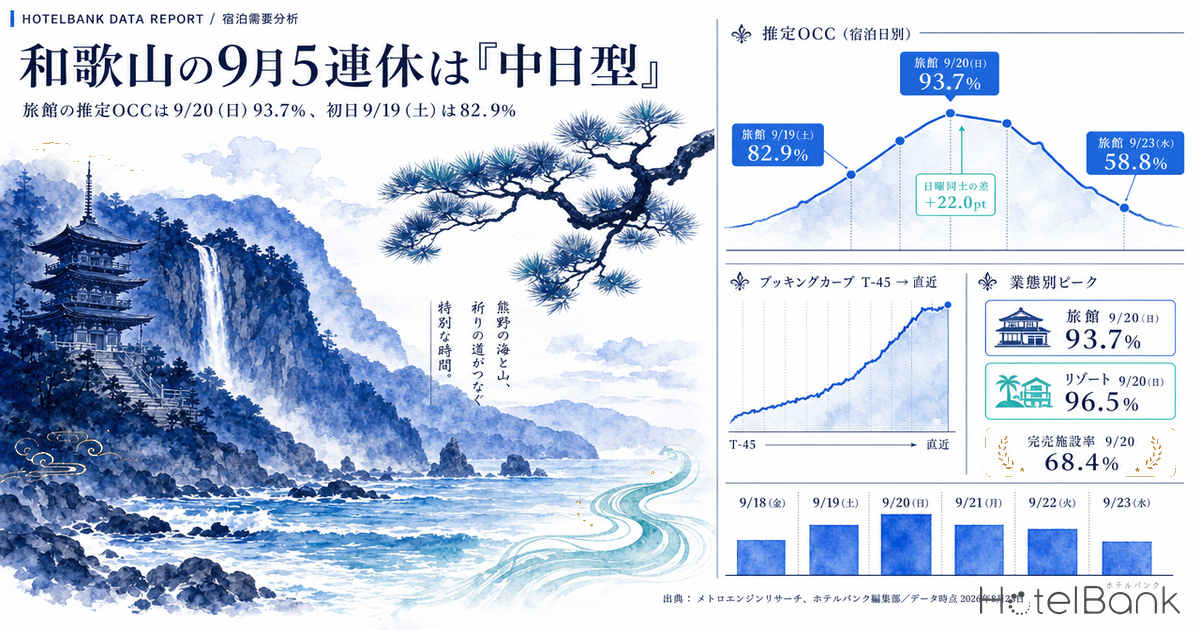
This article tracks accommodation demand in Wakayama Prefecture for the five-day holiday run from Saturday, September 19 to Wednesday, September 23, 2026, starting 45 days before the stay date. The headline finding: demand does not peak on the opening Saturday. It peaks on Sunday, September 20 — the middle day, where estimated OCC reaches 93.7% at ryokan (95 properties, 93–95 observed) and 96.5% at resort hotels (33 properties). The opening day, Saturday September 19, stops at 82.9% for ryokan and 79.4% for resorts, leaving gaps to the peak of 10.8pt and 17.1pt respectively. The final day, Wednesday September 23, falls to 58.8% at ryokan and 52.7% at resorts. This run is therefore not a curve that crests on Saturday but one that crests on Sunday and Monday, with the first and last days dropping away like shoulders. That difference in shape materially changes what can be done in the four weeks that remain.
About the data in this article — Scope: 95 ryokan, 33 resort hotels and 57 business hotels in Wakayama Prefecture (city hotels are treated as reference only, with 7 properties observed). The price metric in this article is estimated settled ADR (the transacted price level estimated from OTA and other sales data, tax-excluded equivalent); occupancy is an estimate based on OTA-listed inventory. Definitions for both appear at the end of the article. Data as of August 23, 2026.
- — Demand peaks not on the opening Saturday but on the middle day, Sunday September 20. Estimated OCC is 93.7% at ryokan and 96.5% at resort hotels (both observed as of August 22, 2026; N=95 / 33 properties).
- — The opening day, Saturday September 19, stops at 82.9% for ryokan, leaving a gap to the peak of 10.8pt at ryokan and 17.1pt at resorts. Business hotels are the one segment where the gap is flat, at 2.6pt.
- — The shape was already set 45 days out. The day-by-day ranking at ryokan (9/20 > 9/21 > 9/19 > 9/22) has not changed from T-45 through to the latest observation, and the build since then amounts to only +8.0 to +11.1pt.
- — What the holiday lifts is the Sunday and Monday that would normally soften. Sunday against Sunday, ryokan gain +22.0pt and resorts +27.7pt; Saturday against Saturday, resorts gain just +1.7pt.
- — The two edge days of the run (9/18 and 9/23) are not part of the holiday. At 60.9% and 58.8%, ryokan sit below the ordinary weekend of 9/13 (71.7%), so simply extending holiday pricing across them does not match the demand.
- — Applying absorption rates measured across 61 past stay dates, the middle day 9/20 lands at 96.1–96.8% for ryokan and 97.2–98.1% for resorts. The day with the most room to move over the remaining month is 9/22 (ryokan +9.3 to +12.0pt).
Demand peaks not on the opening Saturday but on the middle day, Sunday September 20
Start with the calendar. In the list of national holidays published by the Cabinet Office, September 21, 2026 is Respect for the Aged Day, September 22 is a holiday (the so-called Citizens’ Holiday) and September 23 is Autumnal Equinox Day. Counting from Saturday September 19, that makes five consecutive days off. Tracing the same list year by year, this run of three straight holidays — Respect for the Aged Day, Citizens’ Holiday, Autumnal Equinox Day — last occurred in 2015, eleven years ago. In a year with an unusual calendar alignment, day-of-week assumptions built on ordinary weekends do not carry over intact. The data bears that out.
The table below lines up estimated OCC and the sold-out property rate at the latest observation (as of August 22, 2026, equivalent to T-27 through T-32 for each stay date) for the six days from Friday September 18, the eve of the run, through Wednesday September 23, its final day. Saturday September 12 and Sunday September 13, an ordinary weekend, are shown alongside for comparison.
| Stay date | Days remaining | Ryokan est. OCC (N=95) |
Ryokan sold-out rate | Resort est. OCC (N=33) |
Business est. OCC (N=57) |
|---|---|---|---|---|---|
| 9/18 (Fri) eve of the run | T-27 | 60.9% | 13.7% | 55.1% | 66.9% |
| 9/19 (Sat) opening day | T-28 | 82.9% | 36.8% | 79.4% | 88.4% |
| 9/20 (Sun) middle day | T-29 | 93.7% | 68.4% | 96.5% | 91.0% |
| 9/21 (Mon, Respect for the Aged Day) | T-30 | 90.9% | 50.5% | 92.1% | 86.3% |
| 9/22 (Tue, Citizens’ Holiday) | T-31 | 75.9% | 23.2% | 74.4% | 71.4% |
| 9/23 (Wed, Autumnal Equinox Day) | T-32 | 58.8% | 20.0% | 52.7% | 63.5% |
| (ref.) 9/12 (Sat) ordinary weekend | T-21 | 73.2% | 13.7% | 77.7% | 74.6% |
| (ref.) 9/13 (Sun) ordinary weekend | T-22 | 71.7% | 17.9% | 68.8% | 65.5% |
Source: MetroEngines Research; compiled by the HotelBank Editorial Team
All three segments agree on where the curve tops out: Sunday September 20. What differs is how asymmetric that curve is. At ryokan the gap between the peak and the opening Saturday is 10.8pt, and at resorts it widens to 17.1pt, while at business hotels it is only 2.6pt. Business hotels had already built to 88.4%, with a 43.9% sold-out rate, by Saturday September 19, and run comparatively evenly from the start of the run to its end. Ryokan and resorts concentrate demand on the middle day, with thin shoulders either side. Even across the same five days in the same prefecture, which day to defend differs by segment. A case where ryokan and resort hotels in this same prefecture moved in opposite directions can also be seen in Wakayama Obon 2026: Aug 13 Peaks 94.9%, Aug 15 Ryokan Stuck at 73.2%.
Source: MetroEngines Research; compiled by the HotelBank Editorial Team
The other figure that draws the eye is how low the final day, Wednesday September 23 (Autumnal Equinox Day), sits. Ryokan at 58.8% and resorts at 52.7% fall below the 71.7% and 68.8% recorded for Sunday September 13, an ordinary weekend. It is a public holiday, but because Thursday September 24 is a working day it appears to serve as the day most travellers head home. On the holiday calendar it is part of the run; in demand terms it behaves like a day outside it. The same holds for Friday September 18, the eve of the run, where ryokan sit at 60.9% and resorts at 55.1%, again below an ordinary weekend. The assumption that a five-day run means five strong days is not supported by the current state of sales. That the weakness of the back half is not confined to Wakayama is shown at national level in Silver Week 2026 Back Half at T-47: Sep 23 Matches a Normal Wednesday.
Where the build happened, from T-45 to T-27
Next, when that shape was set. The booking curves below track estimated OCC daily for the four holiday nights across 95 ryokan, from 45 days before the stay date to the latest observation. The horizontal axis is days remaining (45 days out at the left, the latest observation at the right).
Source: MetroEngines Research; compiled by the HotelBank Editorial Team
What stands out is that the four lines had already settled their order 45 days out. At T-45, Sunday September 20 stood at 85.7%, Monday September 21 at 82.4%, Saturday September 19 at 71.8% and Tuesday September 22 at 67.2% — exactly the order seen at the latest cross-section. In other words, the middle-day shape of this demand was already fixed 45 days out. The build from there to the latest observation amounts to only +8.0 to +11.1pt at ryokan. The shape holds; only the level rises, in parallel.
Split by segment, though, the timing of that build differs sharply. The table below sets out three cross-sections — T-45, T-35 and the latest — together with the gain over each interval.
| Segment / stay date | T-45 | T-35 | Latest | T-45→T-35 | T-35 → latest |
|---|---|---|---|---|---|
| Ryokan 9/19 (Sat) | 71.8% | 77.1% | 82.9% | +5.3pt | +5.8pt |
| Ryokan 9/20 (Sun) | 85.7% | 90.3% | 93.7% | +4.6pt | +3.4pt |
| Ryokan 9/21 (Mon) | 82.4% | 87.8% | 90.9% | +5.4pt | +3.1pt |
| Ryokan 9/22 (Tue) | 67.2% | 73.0% | 75.9% | +5.8pt | +2.9pt |
| Resort 9/19 (Sat) | 61.0% | 67.1% | 79.4% | +6.1pt | +12.3pt |
| Resort 9/20 (Sun) | 77.6% | 89.4% | 96.5% | +11.8pt | +7.1pt |
| Resort 9/21 (Mon) | 72.0% | 86.2% | 92.1% | +14.2pt | +5.9pt |
| Resort 9/22 (Tue) | 60.2% | 69.4% | 74.4% | +9.2pt | +5.0pt |
| Business 9/19 (Sat) | 80.9% | 83.5% | 88.4% | +2.6pt | +4.9pt |
| Business 9/20 (Sun) | 81.1% | 86.3% | 91.0% | +5.2pt | +4.7pt |
| Business 9/21 (Mon) | 78.6% | 83.1% | 86.3% | +4.5pt | +3.2pt |
| Business 9/22 (Tue) | 66.9% | 69.9% | 71.4% | +3.0pt | +1.5pt |
Source: MetroEngines Research; compiled by the HotelBank Editorial Team. “Latest” is the observation as of August 22, 2026 (equivalent to T-28 through T-31 for each stay date).
Three things follow. First, resort hotels moved most in the ten days from T-45 to T-35: +14.2pt on Monday September 21 and +11.8pt on Sunday September 20. Set against +4.6 to +5.8pt at ryokan and +2.6 to +5.2pt at business hotels over the same interval, the early slope at resorts is exceptional. Second, resort Saturday September 19 posts the single largest late-interval gain of any segment on any day, at +12.3pt. The opening Saturday is not only lower in level; the period in which it fills is pushed back. Third, business hotels add little on any day, so the level at T-45 is close to the final shape. Because bookings arrive at different times by segment, the same date can be a day that already needs revisiting for one operator and a day that is still moving for another.
What the holiday lifts is Sunday and Monday, not Saturday
The quickest way to measure what a holiday run is worth is the difference against an ordinary weekend. Here, Saturday September 12 and Sunday September 13 — an ordinary September weekend — are compared with Saturday September 19 and Sunday September 20 of the run, at the latest cross-section.
Saturday against Saturday, ryokan go from 73.2% to 82.9%, +9.7pt, and business hotels from 74.6% to 88.4%, +13.8pt. Resort hotels, however, move only from 77.7% to 79.4% — +1.7pt. Being the opening day of a holiday run does not make the resort Saturday much stronger than an ordinary Saturday.
Sunday against Sunday looks entirely different. Ryokan go from 71.7% to 93.7%, +22.0pt; resorts from 68.8% to 96.5%, +27.7pt; and business hotels from 65.5% to 91.0%, +25.5pt. On the sold-out property rate the contrast is starker still: ryokan move from 17.9% on Sunday September 13 to 68.4% on Sunday September 20, and resorts from 12.1% to 60.6%.
In Wakayama, then, almost all of the demand this holiday creates sits on Sunday and Monday. Saturday is already a strong night and has little headroom, while the Sunday that would normally soften is lifted above Saturday’s level. Building the run on the basis that a holiday means pricing every date up uniformly does not fit this shape. A middle-day peak is not unique to Wakayama: the same ordering is observed in Hokkaido Silver Week: Sep 20 Peaks, Ryokan 96.4%, Only Business Dips.
Source: MetroEngines Research; compiled by the HotelBank Editorial Team
One more note on what sits outside the run. Saturday September 26, the Saturday of the following week, is tracking at 89.0% for business hotels with a 33.3% sold-out rate at the latest observation (equivalent to T-35) — a level comparable to the opening day of the run, Saturday September 19. Ryokan are at 69.1% and resorts at 71.4%, in line with an ordinary weekend. Assuming a deep trough follows the holiday will lead to a misread in some segments.
The price yardstick — the seasonal shape of estimated settled ADR and the year-on-year for finalized months
With the shape of occupancy in view, it is worth setting down the price yardstick as well. What follows is estimated settled ADR (monthly, tax-excluded equivalent), not daily or day-of-week pricing. A holiday run is only a few days inside the month, so a monthly ADR does not directly produce the right price for a holiday night — but it does work as a baseline for checking where a property’s own price band sits relative to the market.
Source: MetroEngines Research; compiled by the HotelBank Editorial Team
Ryokan and resort hotels in Wakayama both build a large peak in August, fall back in September, and rise again from November into December. Across the year September sits close to a trough, and inside that trough sits the few-day bump of the holiday run.
On a finalized-month year-on-year basis, the most recent finalized month, July 2026, came in at ¥13,400 for ryokan (N=106 properties, +2.7% against ¥13,000 with N=107 a year earlier), ¥16,000 for resort hotels (N=34, +11.0% against ¥14,500 with N=37) and ¥6,300 for business hotels (N=70, +3.6% against ¥6,100 with N=72). The gain at resort hotels stands out.
| Segment | July 2026 (finalized) | July 2025 (finalized) | Year on year | September 2026 (current estimate) |
|---|---|---|---|---|
| Ryokan | ¥13,364(N=106) | ¥13,008(N=107) | +2.7% | ¥14,046(N=103) |
| Resort hotels | ¥16,043(N=34) | ¥14,450(N=37) | +11.0% | ¥16,442(N=34) |
| Business hotels | ¥6,294(N=70) | ¥6,078(N=72) | +3.6% | ¥9,840(N=67) |
| (ref.) City hotels | ¥9,070(N=7) | ¥7,838(N=8) | +15.7% | ¥11,292(N=7) |
Source: MetroEngines Research; compiled by the HotelBank Editorial Team. Past months are finalized values while September 2026 is an estimate based on the current state of sales, so the two rest on different bases. A simple comparison between an estimate and a finalized value should wait for month-end finalization. City hotels are shown for reference only, with N=7–8 properties.
The September 2026 figure is an estimate based on the current state of sales and will move with how the rest of the month sells. It cannot be set against finalized values to produce a rate of change, but used as a way to check which side of this range a property’s own September pricing sits on, it is already useful today.
One further yardstick that bears on how holiday products are built is the meal-plan differential. This takes only those properties selling both a room-only rate and a rate with breakfast (or with two meals) within the same hotel, and aggregates the difference. It measures the uplift inside a single property, not price differences between properties. Ryokan are excluded from this aggregation, because their product mix generally assumes meals are included and room-only pairs rarely exist.
| Comparison (pair within the same hotel) | Scope | Differential | Differential rate | N (properties with a valid pair) |
|---|---|---|---|---|
| With breakfast vs. room only | Wakayama Prefecture overall | +¥3,281 | +12.7% | 44 |
| Two meals vs. room only | Wakayama Prefecture overall | +¥11,629 | +31.7% | 23 |
| With breakfast vs. room only | Business hotels | +¥1,620 | +11.8% | 24 |
| Two meals vs. with breakfast | Resort hotels | +¥15,923 | +36.4% | 8 |
Source: MetroEngines Research; compiled by the HotelBank Editorial Team. As of August 2026. Ryokan are excluded from this aggregation.
How much more can build in the remaining month — landing ranges and sensitivity
Everything so far has concerned observed levels. What the job actually requires is a view of where this lands. To get there, we measured the absorption rate of remaining inventory — (level the day before the stay − level at the reference cross-section) ÷ (100 − level at the reference cross-section) — across the 61 stay dates from June 1 to July 31, 2026 that have already passed in Wakayama, and assigned the quartiles of that distribution to a pessimistic, median and optimistic case. Because the landing figure is derived as latest observation + absorption rate × (100 − latest observation), it cannot by definition exceed 100%. Each figure is drawn from the same cross-section as the days remaining for the target date (T-28 through T-31), which also avoids distortion from mismatched cross-sections.
| Segment / stay date | Days remaining at latest | Latest observation | Pessimistic (bottom 25%) | Median | Optimistic (top 25%) | Gain at the median |
|---|---|---|---|---|---|---|
| Ryokan 9/19 (Sat) opening day | T-28 | 82.9% | 89.2% | 90.0% | 91.2% | +7.1pt |
| Ryokan 9/20 (Sun) middle day | T-29 | 93.7% | 96.1% | 96.4% | 96.8% | +2.7pt |
| Ryokan 9/21 (Mon, Respect for the Aged Day) | T-30 | 90.9% | 94.4% | 94.8% | 95.4% | +3.9pt |
| Ryokan 9/22 (Tue, Citizens’ Holiday) | T-31 | 75.9% | 85.2% | 86.3% | 87.9% | +10.4pt |
| Resort hotels 9/19 (Sat) opening day | T-28 | 79.4% | 83.7% | 85.5% | 88.7% | +6.1pt |
| Resort hotels 9/20 (Sun) middle day | T-29 | 96.5% | 97.2% | 97.5% | 98.1% | +1.0pt |
| Resort hotels 9/21 (Mon, Respect for the Aged Day) | T-30 | 92.1% | 93.8% | 94.5% | 95.8% | +2.4pt |
| Resort hotels 9/22 (Tue, Citizens’ Holiday) | T-31 | 74.4% | 80.2% | 82.5% | 86.7% | +8.1pt |
| Business hotels 9/19 (Sat) opening day | T-28 | 88.4% | 92.6% | 93.6% | 94.7% | +5.2pt |
| Business hotels 9/20 (Sun) middle day | T-29 | 91.0% | 94.4% | 95.1% | 96.0% | +4.1pt |
| Business hotels 9/21 (Mon, Respect for the Aged Day) | T-30 | 86.3% | 91.5% | 92.5% | 94.0% | +6.2pt |
| Business hotels 9/22 (Tue, Citizens’ Holiday) | T-31 | 71.4% | 82.6% | 84.7% | 87.5% | +13.3pt |
Source: MetroEngines Research; compiled by the HotelBank Editorial Team. Absorption rates are the quartiles of a distribution measured across the 61 stay dates from June 1 to July 31, 2026 (60 stay dates for business hotels), capturing how much of the remaining inventory was taken up between the cross-section at the same number of days remaining as each target date and the day before the stay.
At the median, the middle day of Sunday September 20 builds to 96.4% at ryokan and 97.5% at resort hotels — meaning there is almost no inventory left to hold back. By contrast, the largest remaining headroom sits on Tuesday September 22 (Citizens’ Holiday), where ryokan move from 75.9% to a median 86.3%, +10.4pt, and business hotels from 71.4% to 84.7%, +13.3pt. Reading 9/22 as a weak day from the latest cross-section alone needs revising once absorption is factored in. The widest spread between pessimistic and optimistic is resort hotels on September 22 (80.2–86.7%, a 6.5pt band), which makes it the day where the quality of the response shows up most clearly in the outcome. The two middle days, conversely, have a pessimistic-to-optimistic spread of around 1pt: whatever is done now, the landing is largely set.
| Level at latest observation | Absorption 20% | Absorption 30% | Absorption 40% | Absorption 50% | Absorption 60% |
|---|---|---|---|---|---|
| Latest observation 60% | 68.0% | 72.0% | 76.0% | 80.0% | 84.0% |
| Latest observation 70% | 76.0% | 79.0% | 82.0% | 85.0% | 88.0% |
| Latest observation 80% | 84.0% | 86.0% | 88.0% | 90.0% | 92.0% |
| Latest observation 85% | 88.0% | 89.5% | 91.0% | 92.5% | 94.0% |
| Latest observation 90% | 92.0% | 93.0% | 94.0% | 95.0% | 96.0% |
| Latest observation 95% | 96.0% | 96.5% | 97.0% | 97.5% | 98.0% |
Source: MetroEngines Research; compiled by the HotelBank Editorial Team. Landing = latest observation + absorption rate × (100 − latest observation). By definition the landing figure cannot exceed 100%. The ranges measured in Wakayama are an absorption rate of 37–50% for ryokan, 21–48% for resort hotels and 37–56% for business hotels.
Table 7 is a lookup for applying a property’s own numbers. The method is simple: find how full the property is for the date in question on the vertical axis, then take the column on the horizontal axis closest to its segment within the ranges measured in Wakayama (37–50% for ryokan, 21–48% for resort hotels, 37–56% for business hotels). If a property is at 70% for September 22 and, as a ryokan, expects a median absorption rate of around 40%, the landing is 82.0%. Working back from there, the decision becomes how many rooms can be held in the higher-rate bucket right now on the assumption of an 82% landing. One caveat: these absorption rates were observed across the summer demand peak of June and July, whereas September is a trough month in annual terms. Actual September absorption may sit toward the lower end of the table, so building from the pessimistic column is the safer call.
For revenue managers running ryokan, resorts and business hotels in Wakayama — implications and an action plan
1. There is room to re-test the assumption that the opening day of a holiday is the strongest day against your own results. At the latest market cross-section, the ryokan peak is 93.7% on Sunday September 20, 10.8pt above the 82.9% of the opening day, Saturday September 19. At resorts that gap reaches 17.1pt. If, lining up your own bookings across the four holiday nights, Saturday is the fullest and Sunday is open, that runs against the shape of the market. Where pricing is set automatically by day of week, this particular holiday calls for a decision to override the day-of-week logic.
2. Which days are still moving and which are not differs by segment. Resort hotels added +12.3pt on Saturday September 19 between T-35 and the latest observation, so the opening day reads as still in the middle of building. Business hotels, conversely, moved only +1.5pt on Tuesday September 22 over the same interval, so it is worth allowing for the possibility that waiting will not add much. Within the same four weeks remaining, the combination of segment and date leaves room to vary how fast to act.
3. The two days at the edge of the run (9/18 and 9/23) deserve to be treated as a separate product from the run itself. Ryokan sit at 60.9% on Friday September 18 and 58.8% on Wednesday September 23, both below the 71.7% of Sunday September 13, an ordinary weekend. Extending holiday rates straight across them risks applying above-ordinary-weekend pricing to below-ordinary-weekend demand. Designing them instead as a way to extend a middle-day stay outward fits the shape better.
4. Set the price baseline monthly; make the call on the day from the shape of occupancy. Estimated settled ADR for September 2026 is ¥14,000 at ryokan (N=103 properties) and ¥16,400 at resorts (N=34 properties), and that level is an average across the whole month. The holiday nights can plausibly sit above it, but lifting weak days such as September 18 and 23 by the same amount invites lost business. Within the same property, the meal-plan differential between two meals and room only is +31.7% across the prefecture (N=23 properties). Making the meals more substantial on the middle night of a multi-night stay is one way to build rate through product mix rather than price.
What follows is an action plan along a time axis. Every decision trigger is tied to a figure presented in this article.
| Time horizon | Action | Decision trigger | Intent |
|---|---|---|---|
| Today–this week (around T-30) | Lay out your own bookings across the five holiday nights as a day-by-day sequence and overlay the shape of the market | If your 9/20 sits below your 9/19, the sequence runs opposite to the market (93.7% vs 82.9% at ryokan) | Detach settings built on day-of-week assumptions and handle this holiday separately |
| Today–this week | Revisit the allocation of remaining rooms on 9/20 and 9/21 so that higher-category inventory is held back first | If the market sold-out rate on 9/20 has reached 68.4% at ryokan and 60.6% at resorts while your own low-rate buckets remain heavily open | Avoid giving up rate on the two days where demand concentrates most |
| Within two weeks (T-14 to T-20) | Re-frame the sale of 9/19 (Sat) as a 9/19–20 two-night stay rather than a single opening night | If your 9/19 has stalled near the resort market’s T-35 level (67.1%), it is the point to go after the late build (+12.3pt) | Fill opening-night vacancy with middle-day demand while avoiding discounting a single night |
| Within two weeks | Detach 9/18 (Fri) and 9/23 (Wed) from holiday pricing and return them to a design close to an ordinary weekend | If these two days at your property are not reaching the market level of 9/13 (Sun) (71.7% at ryokan) | Avoid carrying unsold rooms while leaving aggressive pricing on weak days |
| Looking to next month | Take stock of your own average rate level for September against the market’s estimated settled ADR | If your September settings remain well below the market’s current estimate (¥14,046 ryokan, ¥16,442 resort, ¥9,840 business) | Review the price band for the whole month rather than deciding on the holiday alone |
| Looking to next month | Rebuild the settings for the week after the holiday (around 9/26) from current conditions rather than assuming a pullback | If business hotels in the market are tracking 9/26 at 89.0%, on a par with the opening day of the run, and your property is not at that level | Avoid easing off after the holiday and losing business unnecessarily |
Source: MetroEngines Research; compiled by the HotelBank Editorial Team
In summary — three yardsticks
Yardstick 1: the shape of a holiday run is set 45 days out. At ryokan in Wakayama, the day-by-day ranking at T-45 (9/20 > 9/21 > 9/19 > 9/22) did not change at all through to the latest cross-section. The build was +8.0 to +11.1pt: the level rose, the shape did not move. It is reasonable to settle which day is the peak at the 45-days-out cross-section and only then work through the detail.
Yardstick 2: what a holiday lifts is the day of the week that would normally soften. Saturday against Saturday gave ryokan +9.7pt and resorts +1.7pt, whereas Sunday against Sunday gave ryokan +22.0pt and resorts +27.7pt. The benefit of a holiday does not show up as making an already strong day stronger. That is where the value lies in detaching day-of-week logic for this period alone.
Yardstick 3: the edge of a holiday is not the holiday. Friday September 18, the eve of the run, and Wednesday September 23, its final day, are both tracking below an ordinary weekend. The number of holiday days on the calendar and the number of holiday days in demand terms do not match. Whether these two days are included in the same design as the run itself will shape what the holiday earns overall.
Every figure in this article is a snapshot at the time of collection. Levels will move over the four weeks that remain, but on the evidence so far the shape — the day-by-day ranking — is the part that resists change. Fix the shape and track only the level: that is the practical way to approach this holiday.
About the data
- Definition of estimated OCC (based on OTA-listed inventory): OTA-listed-inventory occupancy = 100 − 100 × rooms still listed on OTAs ÷ total rooms. It is an estimate based on how inventory sold on OTAs is taken up and differs in definition from actual room occupancy (it runs higher). The month covered is September 2026.
- Booking curve: based on observations from 45 days before the stay date to the latest. “Latest” in this article is the observation as of August 22, 2026, equivalent to T-21 through T-35 for each stay date.
- Sold-out property rate: the share of properties in scope for which no listed inventory can be confirmed on OTAs and similar channels (estimated).
- Estimated settled ADR: the transacted price level (tax-excluded equivalent) estimated from OTA and other sales data (cheapest-plan level × segment coefficient, ensembled across multiple channels). Past months are finalized values; current and future months are estimates based on the current state of sales. Median error against published operating results is 6.6%.
- Meal-plan differential: a paired comparison covering only properties selling more than one meal plan within the same hotel. Ryokan are excluded from this aggregation. N indicates the number of properties for which a valid pair exists.
- Breakdown of N in scope: 95 ryokan in Wakayama Prefecture (3,282 rooms; 93–95 observed), 33 resort hotels (2,090 rooms; 33 observed), 57 business hotels (3,898 rooms; 56–57 observed) and 7 city hotels (830 rooms; 7 observed). N for estimated settled ADR is the number of properties aggregated in each month; for the months cited in this article that is 103–107 ryokan, 34–37 resort hotels, 67–72 business hotels and 7–8 city hotels.
- Data as of August 23, 2026. Sales and inventory move daily, so the figures in this article are a snapshot at the time of collection.
References and sources
■ Data sources
Accommodation demand (estimated OCC, sold-out property rate, booking curves) is aggregated in-house across 95 ryokan (3,282 rooms), 33 resort hotels (2,090 rooms), 57 business hotels (3,898 rooms) and 7 city hotels (830 rooms) in Wakayama Prefecture. Prices are estimated settled ADR by segment (monthly, tax-excluded equivalent), with past months as finalized values and current and future months as estimates based on the current state of sales. The meal-plan differential aggregates only properties with a valid pair within the same hotel. The calendar was confirmed against the Cabinet Office’s “National Holidays”. Data as of August 23, 2026; latest observation as of August 22, 2026.
■ Calculation assumptions
The landing ranges measure the absorption rate of remaining inventory — (level the day before the stay − level at the reference cross-section) ÷ (100 − level at the reference cross-section) — across the 61 stay dates from June 1 to July 31, 2026 that have already passed (60 stay dates for business hotels), and assign its quartiles to a pessimistic (bottom 25%), median and optimistic (top 25%) case. Each target date is drawn from the cross-section at the same number of days remaining (T-28 through T-31). Because landing = latest observation + absorption rate × (100 − latest observation), it cannot by definition exceed 100%. Year-on-year figures are calculated only between finalized values; current estimates are not compared with finalized values.
■ Limitations and caveats
Estimated OCC is an estimate based on how OTA-listed inventory is taken up and differs in definition from actual room occupancy (it runs higher). The distribution of absorption rates was observed across the summer demand peak of June and July, and in September — a demand trough — it may sit toward the lower end, so landing ranges should be read conservatively. City hotels, with 7–8 properties observed, are shown for reference only and are not used in the main argument. A monthly estimated settled ADR does not directly yield the right price for a holiday night, and is used here only as a baseline for the price band. The figures in this article are a snapshot at the time of collection, and levels will move with sales over the remaining period.
- Cabinet Office, “National Holidays” (confirming Respect for the Aged Day on September 21, the Citizens’ Holiday on September 22 and Autumnal Equinox Day on September 23, 2026)
https://www8.cao.go.jp/chosei/shukujitsu/gaiyou.html - Accommodation demand, estimated settled ADR and meal-plan differential: MetroEngines Research, HotelBank Editorial Team
Related reading
- Wakayama Obon 2026: Aug 13 Peaks 94.9%, Aug 15 Ryokan Stuck at 73.2%
- Hokkaido Silver Week: Sep 20 Peaks, Ryokan 96.4%, Only Business Dips
- Silver Week 2026 Back Half at T-47: Sep 23 Matches a Normal Wednesday
- Osaka Sep 2026 Holiday: Demand Peaks First 2 Nights, Sep 23 at 58.0%
- Nagano September: Wed 58.7% vs Holiday Sat 93.0%, 34pt Gap Holds
- Silver Week 2026: First in 11 Years — ADR & Booking Curve Analysis
- Okayama Booking Curves: 3 Checkpoints, Aug 8 Late-Surges +11.8pt