

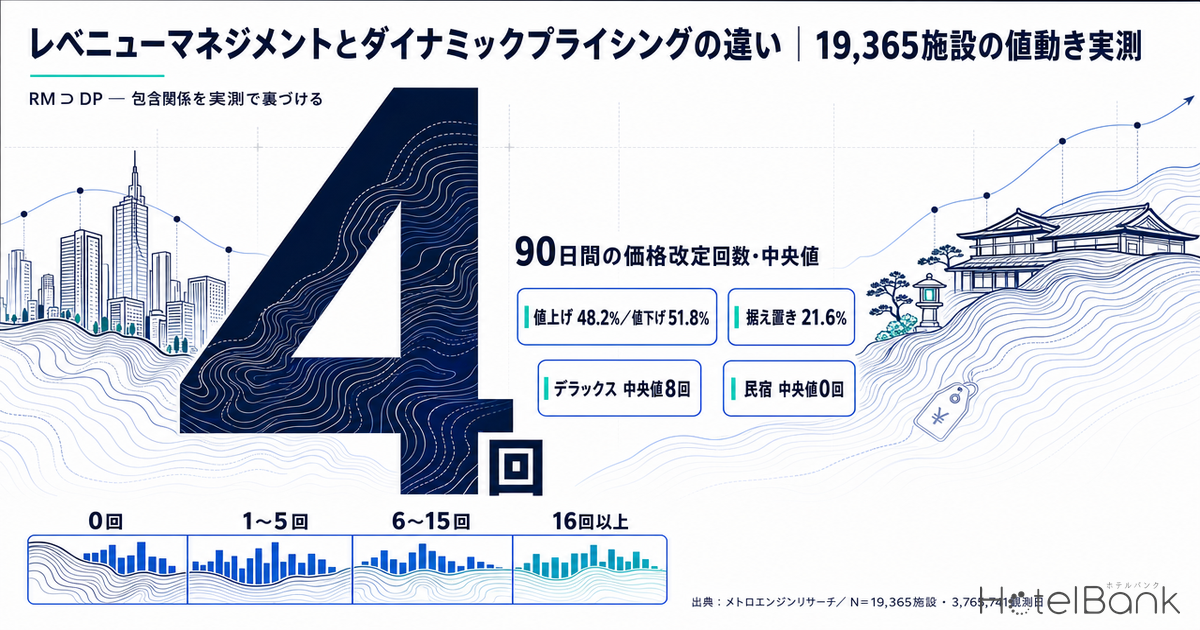
Revenue management (RM) and dynamic pricing (DP) are often used interchangeably, but they cover different ground. RM is the decision-making framework that determines who to sell to, through which channel, how many rooms, and at what price, all grounded in demand forecasting, while DP is the specific technique of moving the “at what price” part in response to demand. DP is therefore a component of RM, and adopting DP alone does not mean a property is practising RM. This article does not stop at defining the terms: it backs the containment relationship with observed price movement across 19,365 properties and 3.77 million observation-days.
Metric Definitions Used in This Article
- Listed price: the price of the cheapest plan each property published on OTAs and similar channels (two guests in one room, per-room rate, tax included). This is a daily-observed listing-based figure and differs from the price actually transacted. This article addresses how listed prices move, not the price level itself.
- LT (lead time): days remaining until the check-in date. LT0 = the check-in day itself, LT90 = 90 days out. This article uses observations within LT90 only.
- Price revision: an event where a given day’s listed price changed by ±3% or more from the immediately preceding observation. A positive change counts as a hike, a negative one as a cut. Days on which no listing could be confirmed (carry-over of the previous day’s value) are excluded from revision detection.
- Price range: the spread between the highest and lowest price observed during the observation window, expressed as a percentage of the lowest price.
- Rooms remaining: the number of bookable rooms confirmed on OTAs and similar channels on each observation day (room basis). Published inventory share refers to the maximum rooms-remaining figure confirmed during the observation window as a proportion of that property’s total room count.
- ADR, RevPAR, OCC: referenced in this article as concepts only; no estimated values are presented.
- Data source: MetroEngines Research
- — RM ⊃ DP — revenue management is the decision framework binding four layers (demand forecasting, inventory allocation, price, and sales control); dynamic pricing is the technique that handles the price layer.
- — The median property made 4 price revisions in 90 days. Across 19,365 properties and 3,765,741 observation-days, 21.6% never moved price at all.
- — Hikes 48.2%, cuts 51.8% — the 266,144 revisions observed were almost symmetric, so DP is not a tool for raising rates.
- — Room count is the strongest determinant of operating density. Properties with 19 rooms or fewer had a median of 1 revision, those with 200+ rooms had 8, and the price range gap widens to 10.9% versus 40.7%.
- — Median published inventory share is 51.2%, but the distribution is polarised: 28.0% publish under 30% of their rooms while 26.3% publish 80% or more, and this split does not line up with how they move price. Inventory allocation sits outside DP.
The short answer — RM is the framework, DP is one technique inside it
Here is the shortest possible answer to the question most people arrive with. Revenue management is the broader concept, and it contains dynamic pricing. The relationship can be written as “RM ⊃ DP”.
The decisions RM covers break into at least four layers. First, demand forecasting — estimating when, from which segment, and how many bookings will arrive. Second, inventory allocation — how many of the total rooms to assign to which channel and which rate class. Third, price — what to charge for that inventory. Fourth, sales control — the non-price levers such as setting minimum length of stay, closing specific plans, and deciding how much overbooking to permit.
Dynamic pricing is the technique that isolates the third layer, moving price in response to demand. DP is powerful, but if the demand forecast is wrong it will move price in the wrong direction, and if inventory allocation is fixed, moving price will not change how many rooms can actually be sold. DP is not self-contained — that is the practical reason the two terms need to be kept apart.
| Dimension | Revenue management (RM) | Dynamic pricing (DP) | Yield management (YM) |
|---|---|---|---|
| Positioning | Decision framework for maximising revenue | Price-movement technique within RM | Predecessor of RM; now subsumed within it |
| Main scope | Demand forecasting, inventory allocation, price, sales control, channels | Price | Inventory (rate-class buckets) and price |
| Framing question | “To whom and how should this inventory be sold to generate the most revenue?” | “What price do we publish for this date today?” | “At what point do we close the cheap buckets?” |
| Core KPIs | RevPAR, GOPAR, total revenue | ADR, revision count and revision magnitude | OCC, ADR (yield = the product of the two) |
| Point of origin | From the 1990s onward, spreading across hotels, railways and other sectors | From the 2010s onward, as rate calculation became automated | The 1970s-80s, after US airline deregulation |
| Limits when used alone | — | Delivers little without inventory allocation and demand forecasting alongside it | Bucket management alone is insufficient once price moves continuously |
Source: compiled by the HotelBank Editorial Team
Where yield management fits
Yield management is the other term frequently mentioned alongside these two. It is the predecessor concept to RM, put into practice in the US airline industry of the 1970s and 80s, particularly amid the price competition that followed deregulation. Its focus was optimising bucket (class) allocation: how to divide seats — inventory that vanishes the next day — between cheap advance-purchase fare classes and expensive last-minute ones.
Transplanted to hotels, the object shifts from seats to guest rooms. At the time, however, selling ran mainly on printed rate sheets and travel agents, so moving the price itself every day was not realistic. That is precisely why controlling the inventory side — deciding when to close the cheap buckets — became the main battleground. Yield management is inventory optimisation for an era in which price was hard to move; framing it that way makes its position easy to grasp.
Once online distribution became the norm and the cost of changing a price fell to effectively zero, properties could move the price continuously instead of closing buckets. That is dynamic pricing, and revenue management as practised today is the integration of both, extended to cover demand forecasting and channel strategy. In short, yield management, dynamic pricing and revenue management are not three competing approaches but three successive stages in how the same problem has been solved.
Measured: how often do Japanese properties move price in 90 days? Median 4, and 21.6% never
From here the article turns to measurement, because organising the concepts alone does not reveal how widely DP has actually been adopted.
The analysis covers three check-in dates: Wednesday 22 July 2026 (an ordinary weekday), Saturday 1 August (a weekend), and Friday 14 August (the Obon peak). All three had already passed at the time of writing, so observation from LT90 through LT0 is complete. Using a query of two guests in one room for one night, the cheapest listed price and the rooms remaining were tracked daily for each property, and cases with 40 or more actual observations within LT90 were included. The population is 19,365 properties and 48,423 cases (property × check-in date), totalling 3,765,741 observation-days, with a median of 83 observation-days per case.
Within that population, we counted how many times the listed price changed by ±3% or more from the immediately preceding observation. The median was 4 and the mean 5.5. Four revisions across 83 observation-days means price was touched on roughly 5% of days.
The distribution makes the structure clear. Over 90 days, 21.6% never moved price, 40.8% moved it 1-5 times, 30.4% moved it 6-15 times, and 7.1% moved it 16 or more times. In other words, more than six in ten (62.4%) moved price five times or fewer in 90 days. Relative to how widely the term DP circulates, implementation density has yet to reach the whole market.
Source: MetroEngines Research; compiled by the HotelBank Editorial Team (N=48,423 cases, 19,365 properties)
The price-move-count metric itself was tested earlier in 1,057 Hotels: Median 6 Price Moves in 90 Days, 12.1% Never Moved. This time the dates, conditions and detection threshold are different, making it an independent tally, yet the structure was reproduced: the median stays in the low single digits, and somewhere between one in ten and one in five properties never moves price at all. The fact that the same shape emerges under a different analytical design is what makes this distribution robust.
Operating density varies fourfold by property type — 8 revisions for deluxe hotels versus 2 for ryokan
The overall median of 4 splits sharply once property type is separated out. Deluxe hotels are highest at a median of 8, followed by city hotels at 7 and business hotels at 6. At the other end, ryokan recorded 2, guesthouses 1, and both pensions and minshuku a median of 0.
The share that never moved price at all diverges in the same direction. Deluxe hotels stop at 3.9% and city hotels at 5.3%, whereas ryokan reach 27.0%, pensions 54.3% and minshuku 64.0%.
Source: MetroEngines Research; compiled by the HotelBank Editorial Team
| Property type | N | Revisions | Share with 0 revisions | Share with 16+ | Price range | Published inventory share |
|---|---|---|---|---|---|---|
| Deluxe hotel | 438 | 8 | 3.9% | 23.1% | 43.2% | 32.4% |
| City hotel | 2,841 | 7 | 5.3% | 18.0% | 46.5% | 27.8% |
| Business hotel | 16,941 | 6 | 11.7% | 11.6% | 35.1% | 37.5% |
| Resort hotel | 3,614 | 5 | 12.1% | 8.1% | 33.3% | 50.3% |
| Hostel | 2,440 | 5 | 11.6% | 8.4% | 48.9% | 75.0% |
| Capsule hotel | 200 | 4 | 18.0% | 8.5% | 35.7% | 5.9% |
| Ryokan | 12,282 | 2 | 27.0% | 2.2% | 19.2% | 58.3% |
| Guesthouse | 1,617 | 1 | 37.6% | 0.8% | 11.1% | 75.0% |
| Pension | 2,045 | 0 | 54.3% | 0.2% | 0.0% | 60.0% |
| Minshuku | 1,466 | 0 | 64.0% | 0.0% | 0.0% | 50.0% |
Source: MetroEngines Research; compiled by the HotelBank Editorial Team (only property types with N of 180 or more are shown)
This gap reflects differences in how rates are constructed rather than superiority or inferiority. Business and city hotels have simple room-type structures and build their rate tables out from a single base rate, so moving one value moves everything with it. Ryokan, by contrast, multiply meal content, room type and seasonal plans together, so one change cascades into many. The difficulty of moving the structure itself is what shows up as a low revision count — that is the natural reading.
Turned around, it means simply tidying the rate design and consolidating to a single base rate leaves operational headroom for the ryokan segment. How far price volatility spreads by area and property type is examined separately in RM Tools & Price Dispersion: Tokyo/Osaka ADR Volatility by Hotel Type.
Room count is the strongest determinant of operating density
Room count acted even more monotonically than property type. Properties with 19 rooms or fewer had a median of 1 revision and a 37.9% share with zero revisions. At 200 rooms or more, the median rises to 8 and the zero-revision share falls to 4.0%. Without exception, operating density increased as the size band went up.
Source: MetroEngines Research; compiled by the HotelBank Editorial Team (N=48,384 cases; 39 cases with unknown room count excluded)
Price range moves the same way. For properties with 19 rooms or fewer, the spread between the highest and lowest observed price stops at 10.9%, whereas for 200 rooms or more it reached 40.7%. Properties that revise often also swing further. What matters here is the implication on the other side: properties that revise rarely are selling strong-demand and weak-demand dates at essentially the same price. On where a price that never moves tends to come to rest, Do Hotel Prices Stall at Round Numbers? 29.2M Listed Rates Say No picks out the digit habits from 29.24 million listed rates.
Much of this correlation can be explained by the time available. A 200-room property can staff a dedicated revenue manager. At a 20-room inn, the owner watches price alongside guest service, purchasing and housekeeping. Because it is a difference in resourcing rather than in awareness, this is also an area that systems can close.
DP is not a rate-hiking tool — 48.2% up, 51.8% down
The term dynamic pricing carries an implication of a mechanism that jacks up prices in peak periods. The measurements do not support that.
The population produced 266,144 observed price revision events. Of these, 128,187 were hikes (48.2%) and 137,957 were cuts (51.8%) — cuts were in fact marginally more common. Looking at the property level, across the 37,957 cases with at least one revision, the median share of revisions that were hikes was exactly 50.0%. The median magnitude per revision was 9.5%.
Cut when demand is weaker than forecast, raise when it is stronger. This symmetric adjustment is what operations actually look like, and revision count should be read as the number of times a property tracked demand, not the number of times it raised rates. Where hikes and cuts sit along the lead-time axis is examined from the timing side in When Do Hotels Raise Rates? 12,821 Hotels: Hikes Win Only LT30-15.
Why RM is broader than DP, part 1 — inventory allocation is a separate decision from price
Here is the practical core that separates the two. Of RM’s four layers, inventory allocation moves as an entirely different variable from price.
Looking at published inventory share — the maximum rooms-remaining figure confirmed during the observation window as a proportion of total rooms — the overall median was 51.2%. By quartile, the bottom 25% sat at 26.9% and the top 25% at 80.0%, meaning 28.0% of properties publish less than 30% of their total rooms while 26.3% publish 80% or more: a wide split at both poles.
Source: MetroEngines Research; compiled by the HotelBank Editorial Team (N=48,384 cases)
The differences by property type do not line up with how price is moved. Deluxe hotels, which revise most often (median 8), publish 32.4% of their inventory; city hotels 27.8%; capsule hotels as little as 5.9%. Meanwhile ryokan, with a median of 2 revisions, published 58.3%, and guesthouses, with a median of 1, published 75.0%. The types that move price most finely are the ones publishing the least inventory — an inverse relationship.
The reason for this gap cannot be pinned down from public data alone. It could reflect a distribution mix centred on channels other than OTAs — direct booking on official sites, call centres, travel agents, corporate contracts; it could reflect inventory control that releases rooms in small increments as check-in approaches; or the contracted allotment itself may simply be set small. Any of these is plausible. What is certain either way is that “how many rooms go to which channel” is decided independently of price. That layer lies outside DP’s remit and belongs to RM.
Why RM is broader than DP, part 2 — capturing demand and moving price are different axes
The second piece of evidence lies in how price behaved when demand was strong. Here the analysis narrows to properties publishing at least 30% of their total rooms and examines how their OTA inventory was absorbed. The scope is 34,847 cases across 14,788 properties (excluding the 13,576 cases with a published inventory share below 30%).
Of these, rooms remaining hit zero earlier than seven days before check-in in 8,896 cases (25.5%) — instances where strong demand was actually observed. Yet 27.2% of those cases never moved price by ±3% or more across the entire 90 days.
| Price revisions | N | Rooms | Share reaching zero rooms before LT7 | LT at sell-out | Price range |
|---|---|---|---|---|---|
| 0 | 7,334 | 9 | 33.0% | LT30 | 0% |
| 1-5 | 14,634 | 16 | 27.7% | LT28 | 23.8% |
| 6-15 | 10,649 | 53 | 19.3% | LT25 | 53.8% |
| 16 or more | 2,230 | 90 | 16.2% | LT21 | 84.3% |
Source: MetroEngines Research; compiled by the HotelBank Editorial Team (tallied across the 34,847 cases publishing at least 30% of total rooms)
A confounder deserves attention here. The zero-revision group had a median of 9 rooms, while the 16-or-more group had 90. Small properties reach full occupancy on a small number of bookings, so they structurally hit zero rooms earlier. No causal claim that “not moving price makes you sell out sooner” can be read from this.
One thing is nonetheless certain. Reaching zero rooms remaining is a room-based measurement that strong demand existed for that date. And the zero-revision group had a price range of 0% even in those strong-demand instances — selling out at the same price from beginning to end. They had exhausted their inventory at LT30, a full month before check-in, and never once moved the price.
This is not a weakness so much as headroom that has not yet been used. The strength of demand — that at this price the property fills a month out — is already demonstrated, so room remains for staged price adjustment. And that judgement does not come out of a pricing algorithm. It only becomes possible with an observation from the demand side: when, and at what pace, the inventory was absorbed — in other words, reading the booking curve. DP moves the price, but RM builds the case for moving it. How to use booking curves in practice, and which checkpoints matter, is set out in Okayama Booking Curves: 3 Checkpoints, Aug 8 Late-Surges +11.8pt.
A mini-glossary of adjacent terms
| Term | Meaning, and its relationship to RM/DP |
|---|---|
| ADR (average daily rate) | Room revenue divided by rooms sold, i.e. the average rate per room sold. The metric DP moves directly. |
| OCC (occupancy) | Rooms sold as a proportion of total rooms. One of the two pillars of yield management alongside ADR. |
| RevPAR | Revenue per available room (ADR × OCC). RM’s central KPI, folding the ADR-versus-OCC trade-off into a single figure. |
| GOPAR | Gross operating profit per available room. Because it looks at profit rather than revenue, it absorbs differences in overheads and customer-acquisition costs. |
| Booking curve | The trajectory of bookings and rooms remaining toward the check-in date. An input to demand forecasting and the basis for moving price. |
| Lead time (LT) | Days until check-in. The shared coordinate for discussing when to place a revision. |
| Allotment | The room allocation assigned to each distribution channel. An inventory-allocation decision independent of price, and squarely within RM. |
| Rate parity | The principle of keeping displayed prices aligned across channels. A constraint on running DP across multiple channels. |
| MLOS (minimum length of stay) | A sales control restricting single-night stays on dates with strong multi-night demand. A way to change the revenue mix without changing price. |
| Overbooking | Accepting bookings beyond the room count by pricing in a cancellation rate. Inventory-side optimisation, and not part of DP. |
Source: compiled by the HotelBank Editorial Team
Frequently asked questions
Q. Between revenue management and dynamic pricing, which is ultimately the broader concept?
A. Revenue management is the broader one. RM is a decision framework covering demand forecasting, inventory allocation, price and sales control, while DP is the technique within it that moves price in response to demand. The relationship is RM ⊃ DP.
Q. If we adopt dynamic pricing, does that mean we are practising revenue management?
A. It covers the price layer, but inventory allocation and demand forecasting are separate layers. In this article’s measurements, 28.0% of properties published less than 30% of their total rooms while 26.3% published 80% or more, and that distribution did not line up with how they moved price. How many rooms go to which channel is a judgement independent of price.
Q. Is the term yield management no longer used?
A. It is still used, but today it more often appears in the narrower context of optimising inventory (rate-class buckets) as one part of RM. It is a concept established in the US airline industry of the 1970s and 80s, and its starting point was bucket allocation in an environment where price was hard to move.
Q. Is dynamic pricing a mechanism for raising rates?
A. The measurements were close to symmetric. Of the 266,144 price revisions observed here, 48.2% were hikes and 51.8% were cuts. The median share of hikes at the property level was also exactly 50.0%.
Q. Is dynamic pricing meaningful even for a small property?
A. In the measurements, properties with 19 rooms or fewer had a median of 1 revision and a price range of just 10.9%. At the same time, within the population publishing at least 30% of total rooms, 33.0% of the zero-revision group reached zero rooms remaining earlier than seven days out, and even in those instances their price range was 0%. Given that dates exist where the strength of demand is already demonstrated, room remains to try staged price adjustment.
Restating revision counts as the share of days price is touched
Dividing the revision counts above by observation-days turns them into a density comparable across property types and size bands. The overall median of 4 revisions in 90 days works out to 4.8% of the median 83 observation-days — meaning price is touched once every 20 days. The table below simply divides the median revision counts measured in this article by observation-days. No new assumptions are introduced.
| Level | Revisions (median) | Revision-day share (83-day basis) | Price range (median) | Rooms (median) |
|---|---|---|---|---|
| Static tier (0 revisions) | 0 | 0.0% | 0% | 9 |
| Market-median tier (1-5) | 1-5 (overall median 4) | 1.2-6.0% (4.8% at the median of 4) | 23.8% | 16 |
| High-frequency tier (16+) | 16 or more | 19.3% or more | 84.3% | 90 |
Source: MetroEngines Research; compiled by the HotelBank Editorial Team (revision counts, price range and room counts are measured values from the body text; revision-day share is the division by 83 observation-days)
Observation-days do vary by property, however. This article’s inclusion condition was 40 or more actual observations within LT90, with a median of 83 and a ceiling of 90. The next table sets out how the revision-day share shifts across that span. Every row and column uses only values measured or defined in this article, and each cell is nothing more than the division.
| Revisions | Corresponding tier (measured in this article) | 40 days | 60 days | 83 days | 90 days |
|---|---|---|---|---|---|
| 0 | Zero-revision tier (21.6% of all) | 0.0% | 0.0% | 0.0% | 0.0% |
| 1 | 19 rooms or fewer; guesthouses | 2.5% | 1.7% | 1.2% | 1.1% |
| 2 | Ryokan | 5.0% | 3.3% | 2.4% | 2.2% |
| 4 | Overall median | 10.0% | 6.7% | 4.8% | 4.4% |
| 6 | Business hotels | 15.0% | 10.0% | 7.2% | 6.7% |
| 8 | Deluxe hotels; 200 rooms or more | 20.0% | 13.3% | 9.6% | 8.9% |
| 16 | 16-or-more tier (7.1% of all) | 40.0% | 26.7% | 19.3% | 17.8% |
Source: MetroEngines Research; compiled by the HotelBank Editorial Team (revision counts are the measured medians from the body text; 40 observation-days = the lower bound of the inclusion condition, 83 = the median, 90 = the LT90 ceiling)
The reading is straightforward. The ryokan median of 2 means price was touched on 2.4% of 83 days — equivalent to once every six weeks. Even the 8 revisions recorded by deluxe hotels and 200-plus-room properties works out to 9.6%, or once every ten days. The “price that moves every day” the term dynamic pricing evokes is not the reality even at the top of the market. Put the other way, moving up a single step in density is enough to change a property’s position within the market. But what determines that step is not the pricing algorithm; it is the RM-side design of how demand is read and how inventory is allocated.
Summary
The difference between revenue management and dynamic pricing is a difference of scope. RM is the decision framework binding demand forecasting, inventory allocation, price and sales control; DP is merely the technique handling the price layer. Yield management sits ahead of RM in the lineage, as inventory optimisation from an era when price was hard to move.
And the measurements show this distinction is not merely conceptual. Across 19,365 properties and 3,765,741 observation-days, the median property made 4 price revisions in 90 days, and 21.6% made none. The direction of revisions was near-symmetric at 48.2% up and 51.8% down, so DP is not a rate-hiking tool. Published inventory share had a median of 51.2% but split widely at both poles, and that distribution does not line up with how price is moved. Beyond that, instances of properties exhausting their inventory a month before check-in without ever moving price genuinely exist within the population publishing at least 30% of total rooms.
The technology that moves price and the system that builds the case for moving it are different things. At the stage of considering DP adoption it is easy to focus on the price conversation, but what determines the outcome sits upstream — in the design of how demand is read and how inventory is allocated. That is the practical reason for getting the terms straight.
Related reading
- 1,057 Hotels: Median 6 Price Moves in 90 Days, 12.1% Never Moved
- When Do Hotels Raise Rates? 12,821 Hotels: Hikes Win Only LT30-15
- RM Tools & Price Dispersion: Tokyo/Osaka ADR Volatility by Hotel Type
- Okayama Booking Curves: 3 Checkpoints, Aug 8 Late-Surges +11.8pt
- Listed vs Settled ADR Gap: Japan’s 46-Prefecture Upside Map 2026
- Do Hotel Prices Stall at Round Numbers? 29.2M Listed Rates Say No
- Weekend Premium 2026: Tokyo Business 24% vs Hakone Ryokan 10%, N=659
References and sources
■ Data source
Listed prices and rooms remaining published on OTAs, collected daily by MetroEngines Research. Three check-in dates — Wednesday 22 July 2026, Saturday 1 August and Friday 14 August — were tracked from LT90 through LT0 using a query of two guests in one room for one night. Only property × check-in-date combinations with 40 or more actual observations within LT90 were included, giving N=48,423 cases across 19,365 properties and 3,765,741 observation-days (median 83 observation-days per case). Term definitions and public materials draw on publications from the Japan Tourism Agency and the Ministry of Health, Labour and Welfare.
■ Calculation assumptions
A price revision is defined as an event where the value changed by ±3% or more from the immediately preceding observation; days on which no listing could be confirmed (carry-over of the previous day’s value) are excluded from detection. Price range expresses the spread between the highest and lowest price during the observation window as a percentage of the lowest. Published inventory share is the maximum rooms-remaining figure during the observation window as a proportion of total rooms. The inventory-absorption analysis is limited to the 34,847 cases publishing at least 30% of total rooms (excluding the 13,576 cases below 30%). The revision-day share added in this article is an arithmetic division of measured revision counts by observation-days, and introduces no new estimates or assumptions.
■ Limitations and caveats
What is covered here is listed prices, not prices actually transacted. ADR, RevPAR and OCC are referenced as concepts only; no estimated values are presented. Inventory sold through channels other than OTAs (direct booking, travel agents, corporate contracts) is not captured in the observations, so a low published inventory share does not in itself indicate weak selling capability. The relationship between revision count and inventory absorption is confounded by property size (a median of 9 rooms in the zero-revision tier versus 90 in the 16-or-more tier), so it cannot be read causally. The scope is three check-in dates and does not represent year-round operating behaviour.
■ Market data
- MetroEngines Research — daily observation of listed prices and rooms remaining (check-in 22 July, 1 August and 14 August 2026; LT90-LT0; query of two guests in one room for one night; N=48,423 cases, 19,365 properties, 3,765,741 observation-days)
■ Government and public materials