

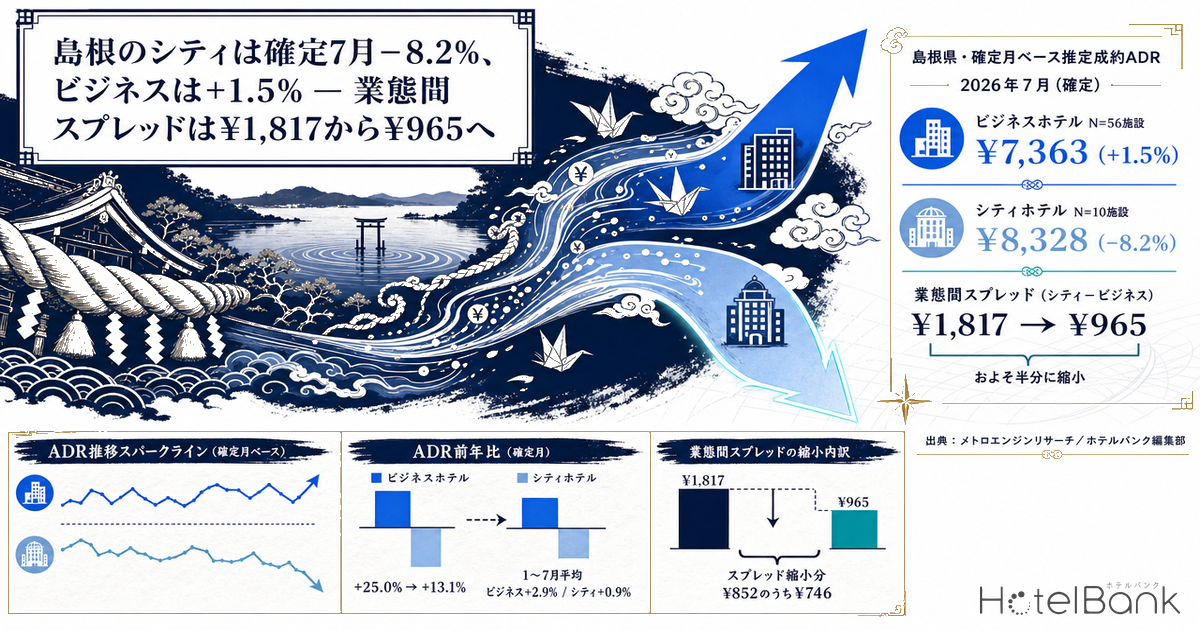
In July 2026 — a finalized month — Shimane Prefecture’s settled ADR estimate came in at ¥7,363 for business hotels (+1.5% year on year) and ¥8,328 for city hotels (−8.2% year on year). Same prefecture, same month, and the two segments moved in opposite directions. The result is that the city-minus-business price gap in July narrowed by roughly half, from ¥1,817 (+25.0%) a year earlier to ¥965 (+13.1%). Averaged across January–July, however, both segments sit above last year: business hotels at ¥7,291 (+2.9%) and city hotels at ¥8,113 (+0.9%). This article uses year-on-year comparisons between finalized months only, separating single-month noise from trend, to trace exactly where pricing in Shimane’s two segments diverged.
Coverage: Shimane Prefecture, business hotels N=56 properties and city hotels N=10 properties (as of July 2026). The price metric in this article is the settled ADR estimate (a transaction-price level inferred from OTA and other distribution data, tax-exclusive equivalent); occupancy is an estimate based on OTA-listed inventory. Both definitions appear at the end of the article. Data as of 25 August 2026.
- — In finalized July 2026, business hotels posted ¥7,363 (+1.5% year on year) and city hotels ¥8,328 (−8.2%). Two segments in the same prefecture, in the same month, pointed opposite ways.
- — The segment spread narrowed from ¥1,817 to ¥965 (a premium over business hotels of +25.0% down to +13.1%). Of the ¥852 of narrowing, ¥746 came from the city-hotel side falling.
- — On a January–July average both segments beat last year — business hotels ¥7,291 (+2.9%), city hotels ¥8,113 (+0.9%). Single-month swings and the underlying trend need to be read separately.
- — City hotels are a small sample at N=10 properties. Monthly year-on-year change swung across a range of more than 20pt, from −8.2% to +11.9%, so the selling stance of a handful of properties feeds straight into the index.
- — Occupancy peaked in May 2026 for both segments — the same month business hotels posted their largest price gain. By day of week, the segment gap narrows to 0.7pt on Saturdays, and Sunday is the weekly low.
Finalized July: Business +1.5%, City −8.2% — Opposite Directions in the Same Prefecture
One premise first. The settled ADR estimate comes in two forms: a finalized value for a past month, and a forward-looking value derived from current on-sale conditions. Because the two rest on different bases, year-on-year comparisons can only be built between finalized months. For Shimane, August 2026 onward is not yet finalized, so every year-on-year figure in this article compares January–July 2026 with the same months of 2025. The tables and charts below cover that finalized range only.
| 2026 | Business hotels settled ADR est. |
YoY | City hotels settled ADR est. |
YoY | Segment gap (city − business) |
|---|---|---|---|---|---|
| January | ¥6,941 | −0.5% | ¥7,212 | −1.9% | ¥271 |
| February | ¥7,238 | +3.6% | ¥7,348 | −3.5% | ¥110 |
| March | ¥7,298 | +5.7% | ¥7,936 | +0.1% | ¥638 |
| April | ¥7,260 | +2.0% | ¥8,612 | +11.9% | ¥1,352 |
| May | ¥7,873 | +7.4% | ¥9,029 | +4.3% | ¥1,156 |
| June | ¥7,064 | +0.3% | ¥8,323 | +4.5% | ¥1,259 |
| July | ¥7,363 | +1.5% | ¥8,328 | −8.2% | ¥965 |
| Jan–Jul average | ¥7,291 | +2.9% | ¥8,113 | +0.9% | ¥822 |
Settled ADR estimate on a finalized-month basis, Shimane Prefecture (business hotels N=52–56 properties / city hotels N=10 properties). Source: MetroEngines Research; compiled by the HotelBank Editorial Team
Business hotels beat the prior year in six of the seven months; the only shortfall was January at −0.5%. The amplitude is small too, with monthly year-on-year change contained within a −0.5% to +7.4% band. Helped by the size of the sample at N=56 properties, this series has the shape of a slow, steady accumulation.
City hotels, by contrast, swung across a range of more than 20pt, from +11.9% in April to −8.2% in July. What matters here is that the city-hotel sample is small at N=10 properties. A series built from the median of ten properties will show a change in the selling stance of a few of them, or a renovation, or a different inventory mix during an event period, directly in the index. Reading a single month of ±8% as a change of market direction goes too far; this is the kind of data where the slope only becomes visible once several months are lined up. For another case where amplitude split sharply between segments, the 18 finalized months of Aichi’s settled ADR estimate digs into how to separate single-month noise from a pricing decision.
Settled ADR estimate on a finalized-month basis (year overlay). August 2026 onward is not yet finalized and is therefore not plotted. Source: MetroEngines Research; compiled by the HotelBank Editorial Team
Overlaid by year, the seasonal shape of the two segments looks much alike: a trough in January–February, a first lift in March, a peak in May during the long-holiday period, a drop in June, then a renewed climb from July into summer. On 2025 finalized values, the annual peak for both segments was August (business hotels ¥7,711, city hotels ¥10,648). City hotels build higher peaks in May and August, while business hotels keep a smaller distance between peak and trough. Comparing the 2026 January–July amplitude, business hotels show a ratio of 1.13× between their cheapest month (January, ¥6,941) and their most expensive (May, ¥7,873); city hotels show 1.25×. In other words, seasonal stretch in pricing is about twice as large for city hotels. Note also that rates within Shimane separate into tiers across Izumo, Matsue, Iwami and Oki; that geography and the Kamiarizuki demand season are analysed in detail in Kamiarizuki and the Shimane hotel market.
Line Up the Year-on-Year Changes and the Bigger Gains Belong to Business Hotels
Isolating the month-by-month year-on-year changes makes the difference in character between the two segments clearer still.
Year-on-year change between finalized months (January–July 2026, Shimane Prefecture). Source: MetroEngines Research; compiled by the HotelBank Editorial Team
The largest gain for business hotels was May at +7.4% (¥7,330 → ¥7,873), followed by March at +5.7%. Both are months tied to long-holiday or fiscal-year-turnover travel demand, while the ordinary months of February, April, June and July ran a mild +0.3% to +3.6%. In other words, the pricing pattern reads as Shimane’s business hotels building their gains in months where demand is dense, and holding roughly flat against last year in ordinary months.
For city hotels, April’s +11.9% (¥7,696 → ¥8,612) stands out, followed by +4.3% in May and +4.5% in June, before the reversal to −8.2% in July. The city-hotel settled ADR estimate for July 2025 was ¥9,074 — the third-highest of the 2025 finalized values, behind August (¥10,648) and November (¥9,984). July’s negative number is therefore in large part a comparison against a month where a high level had been set the year before. The ¥8,328 level itself in July 2026 is almost identical to June of the same year (¥8,323), so nothing has collapsed within the year. It is a textbook case for checking where the prior-year comparison base sits before moving price off a single month’s year-on-year reading.
The Narrowing Segment Spread — July Went from ¥1,817 to ¥965
What emerges from business and city hotels pointing opposite ways is a shift in the segment spread (city-hotel settled ADR estimate minus business-hotel settled ADR estimate). This metric works as a yardstick for how much of a premium the upper segment is able to capture within the same prefecture.
Segment spread = city-hotel minus business-hotel settled ADR estimate (finalized-month basis). Source: MetroEngines Research; compiled by the HotelBank Editorial Team
In 2025 the spread widened toward the demand season — ¥1,027 in March, ¥1,324 in May and ¥1,817 in July. That ¥1,817 in July equates to a premium of +25.0% over business hotels. In 2026 the shape changed. The spread all but vanished in January and February at ¥271 and ¥110, then opened abruptly to ¥1,352 in April, running at ¥1,156, ¥1,259 and ¥965 from May through July. The July premium of +13.1% is roughly half the prior year’s +25.0%.
A spread narrows for one of two reasons: the upper segment comes down, or the lower segment goes up. On Shimane’s finalized values, both happened at once in July. City hotels ran −8.2% and business hotels +1.5%, so of the ¥852 of narrowing, the city-side decline (¥746) accounts for most of it and the business-side increase (¥106) fills the rest. Earlier in the year, the disappearance of the spread in January–February was a combination of business hotels holding up (+3.6% in February) and city hotels falling (−3.5% in February) — a stretch in which the two segments’ price bands essentially overlapped. For an upper-segment operator, this reads as there being several points in the year where it is worth checking whether the basis for the premium is actually being presented.
When Price Moved, What Did Occupancy Do? (Estimated OCC, April–July 2026)
Price alone cannot tell you whether a pricing decision was aggressive or, in the end, well judged. So here is the occupancy side. The figures below are estimated OCC on an OTA-listed-inventory basis (defined differently from actual room occupancy, and reading higher), averaged across daily observations within each month.
| 2026 | Business hotels est. OCC | City hotels est. OCC | Gap |
|---|---|---|---|
| April | 88.6% | 83.7% | 4.9pt |
| May | 91.4% | 89.4% | 2.0pt |
| June | 85.8% | 80.3% | 5.5pt |
| July | 87.3% | 80.9% | 6.4pt |
Estimated OCC, Shimane Prefecture (OTA-listed-inventory basis). July 2026 observations cover 47–51 business-hotel properties and 5,368 rooms, and 10 city-hotel properties and 724 rooms. Source: MetroEngines Research; compiled by the HotelBank Editorial Team
Both segments are highest in May (business hotels 91.4%, city hotels 89.4%) and lowest in June (85.8% and 80.3%). May, the month in which the business-hotel settled ADR estimate rose most, is also the strongest of the four months on the occupancy side. June, conversely, saw occupancy fall and the year-on-year change hold at a near-flat +0.3%. To the extent that the price gain and the high occupancy landed in the same month, May at least reads as an increase supported by demand. In July, business hotels ran 87.3% and city hotels 80.9%, and the 6.4pt segment gap was the widest of the four months.
Next, the day-of-week pattern for July 2026 (viewed on the occupancy axis alone, not price).
| July 2026 | Mon | Tue | Wed | Thu | Fri | Sat | Sun |
|---|---|---|---|---|---|---|---|
| Business hotels | 83.2% | 90.3% | 89.1% | 88.7% | 85.9% | 93.8% | 80.0% |
| City hotels | 75.2% | 81.1% | 81.4% | 81.8% | 79.7% | 93.1% | 73.8% |
Estimated OCC by day of week (OTA-listed-inventory basis, average of daily observations in July 2026). Source: MetroEngines Research; compiled by the HotelBank Editorial Team
Saturday is the peak for both segments, with business hotels at 93.8% and city hotels at 93.1% — practically level. That is the distinctive feature in Shimane: on weekdays business hotels run 6–9pt above city hotels, yet on Saturdays the segment gap narrows to 0.7pt. The structure is one of leisure-led weekend demand pushing occupancy up into the upper segment’s rooms as well. Sunday, in contrast, is the weekly low for both segments at 80.0% and 73.8%, below the Tuesday-to-Thursday midweek block (business hotels 88.7–90.3%, city hotels 81.1–81.8%). Business-hotel occupancy being midweek-weighted rather than weekend-led is not unique to Shimane: Hokkaido’s business hotels are not weekend-led shows the same Sunday and Monday troughs.
By individual date, the July high was Saturday 18 July at 99.5% for business hotels and 99.9% for city hotels; the sold-out property rate that day (the estimated share of properties for which no listed inventory could be observed on OTAs and other channels) reached 85.1% and 90.0%. Sunday the 19th also ran high at 96.6% and 96.4%, while Monday the 20th — the final day of the three-day weekend — fell to 75.4% and 67.7%. The three-day weekend produced a clear mountain-shaped demand distribution: inventory disappears from the first day into the middle day, and opens up on the last. The troughs were Sunday 5 July at 72.3% and 64.8% and Sunday 12 July at 75.2% and 62.3% — both Sundays not attached to a long weekend.
For Revenue Managers Running Business and City Hotels in Shimane — Implications and an Action Plan
(1) Which of the two segment patterns does your own year-on-year profile resemble? Shimane’s business hotels were positive in six of seven months across January–July, within a −0.5% to +7.4% range. City hotels opened up to more than 20pt, from −8.2% to +11.9%. Laying your own monthly track over these two ranges tells you whether you are the “steady, market-paced accumulation” type or the “large monthly movement” type. If the latter, taking stock one by one of what was happening in the months that moved — groups, events, renovation, channel mix — gives you material for building the same month next year.
(2) Judge a single month’s year-on-year change only after looking at the level it is being compared with. City hotels’ −8.2% in July is also the flip side of the prior July (¥9,074) having been the third-highest month of 2025, and the ¥8,328 recorded in July 2026 was itself almost identical to June of the same year (¥8,323). When your own year-on-year swings sharply, check the prior year’s absolute level first. Reading a month where the prior year was unusually high as “we are losing this year” and cutting price ends up shaving rate when the level itself has not fallen.
(3) The segment spread tells you when to inspect the basis for your premium. The July spread narrowed from ¥1,817 (+25.0%) a year earlier to ¥965 (+13.1%), and in January–February it had all but vanished at ¥271 and ¥110. If you run an upper-segment property, the months where the spread is thin are precisely the months with room to rebuild, on the product side, the elements that support a price gap — breakfast, late check-out, higher floors, parking and the like, made visible. Seen from the lower segment, those same months are when it is easiest to reach up into the higher price band.
(4) The occupancy calendar and the pricing calendar are out of step. Occupancy was highest in May for both segments (91.4% / 89.4%), matching the month in which the business-hotel settled ADR estimate rose most. By day of week, though, the segment gap narrows to 0.7pt on Saturdays and Sunday is the lowest day (80.0% / 73.8%). If your pricing discussion happens only at monthly granularity, the monthly average may be concealing two troughs: Sunday, and the last day of a long weekend.
What follows is an action plan by time horizon, grounded in the figures through finalized July. None of it guarantees an outcome; treat it as a suggested order in which to check and consider.
| Time horizon | Action | Decision trigger (figures from this article) | Objective |
|---|---|---|---|
| Today–this week | Line up your own January–July ADR against the finalized market values, month by month | Business hotels ran ¥6,941–¥7,873 and city hotels ¥7,212–¥9,029. If your property sits pinned to the bottom of the range in every month | Establish where your pricing sits and identify the months with room to move up |
| Today–this week | Audit inventory and rate settings for recent Sundays and long-weekend final days | Estimated OCC on Sundays was the weekly low at 80.0% for business hotels and 73.8% for city hotels. If your Sunday still carries the same rate design as your Saturday | Treat the within-week trough directly instead of letting the monthly average bury it |
| Within two weeks | Take stock of the justification for your upper price band (added value) as expressed in plan copy | The segment spread was ¥965 (+13.1%) in July, against ¥271 and ¥110 in January–February. If you are a city-hotel property in a phase of narrowing spread | Make the elements that support the price gap visible and restore the explanatory power of the premium |
| Within two weeks | Write up cause notes for the months where year-on-year moved sharply | The market showed city hotels +11.9% in April and −8.2% in July, and business hotels +7.4% in May. If your own property also swung double digits in those months | Separate single-month noise from trend and avoid over-reacting |
| Toward next month | Vary the granularity of your rate revisions between demand months and ordinary months | Market business hotels built gains in demand months (+7.4% in May, +5.7% in March) and ran +0.3% to +3.6% in ordinary months. If your revisions apply a uniform increment across all months | Shift toward a pattern that builds the gain in the dense months |
| Toward next month | Build an autumn-onward capture plan on the assumption of incremental room supply within the prefecture | New openings confirmed in Shimane for 2026 total 12 properties and 331 rooms (on an OTA-listing-confirmed basis), of which one business-hotel property accounts for 208 rooms (opening in August, in front of Matsue Station). That is equivalent to roughly 3.9% of the 5,368 business-hotel rooms observed in July | Thicken weekday base demand on the premise that demand allocation may shift |
The action plan is tied solely to figures appearing in this article. Source: MetroEngines Research; compiled by the HotelBank Editorial Team
Where Could H2 2026 Land? Three Scenarios and a Two-Axis Sensitivity
Everything so far has dealt only with finalized months. The settled ADR estimate for August 2026 onward is not yet finalized — it is a differently based figure resting on forward on-sale conditions — and cannot be placed alongside year-on-year comparisons between finalized months. Instead, then, we want a view of the second-half range built by applying the distribution of year-on-year changes actually observed in January–July 2026 to the finalized 2025 levels for August–December. This is not a forecast; it is a mapping of what happens if the amplitude that has already occurred simply continues.
The year-on-year rates applied are the quartiles of the actual January–July 2026 values. For business hotels, the first quartile across the seven months is +0.9%, the median +2.0% and the third quartile +4.7%. For city hotels the three are −2.7%, +0.1% and +4.4%, the width of the range reflecting the difference in sample size (N=56 properties versus N=10 properties).
| Segment | Month | 2025 finalized |
Pessimistic (1st quartile) |
Mid (median) |
Optimistic (3rd quartile) |
|---|---|---|---|---|---|
| Business hotels | August | ¥7,711 | ¥7,780 | ¥7,865 | ¥8,073 |
| Business hotels | September | ¥7,226 | ¥7,291 | ¥7,371 | ¥7,566 |
| Business hotels | October | ¥7,252 | ¥7,317 | ¥7,397 | ¥7,593 |
| Business hotels | November | ¥7,474 | ¥7,541 | ¥7,623 | ¥7,825 |
| Business hotels | December | ¥7,374 | ¥7,440 | ¥7,521 | ¥7,721 |
| Business hotels | Aug–Dec average | ¥7,407 | ¥7,474 | ¥7,556 | ¥7,756 |
| City hotels | August | ¥10,648 | ¥10,361 | ¥10,659 | ¥11,117 |
| City hotels | September | ¥8,776 | ¥8,539 | ¥8,785 | ¥9,162 |
| City hotels | October | ¥8,928 | ¥8,687 | ¥8,937 | ¥9,321 |
| City hotels | November | ¥9,984 | ¥9,714 | ¥9,994 | ¥10,423 |
| City hotels | December | ¥8,358 | ¥8,132 | ¥8,366 | ¥8,726 |
| City hotels | Aug–Dec average | ¥9,339 | ¥9,087 | ¥9,348 | ¥9,750 |
The rates applied to the pessimistic, mid and optimistic cases are +0.9% / +2.0% / +4.7% for business hotels and −2.7% / +0.1% / +4.4% for city hotels. Source: MetroEngines Research; compiled by the HotelBank Editorial Team
Lined up on the mid case, the August–December average is ¥7,556 for business hotels and ¥9,348 for city hotels. The segment spread works out at ¥1,792, slightly below the ¥1,932 of the same period in 2025. In other words, the narrowing of the spread visible in July does not resolve itself even if the prior year’s amplitude simply continues through the second half. Conversely, if city hotels swing to the optimistic side (+4.4%), the arithmetic returns the spread to roughly 2025 levels — the structure in which upper-segment pricing determines the second-half spread does not change.
For a finer view, here is how the level moves for city hotels across two axes: year-on-year change and the base month (2025 finalized value). City hotels carry large level differences between months (¥10,648 in August 2025 against ¥8,358 in December), so the same “−4% year on year” costs nearly 30% more in some months than others.
| YoY \ base month | August ¥10,648 |
September ¥8,776 |
October ¥8,928 |
November ¥9,984 |
December ¥8,358 |
|---|---|---|---|---|---|
| YoY −8% | ¥9,796 | ¥8,074 | ¥8,214 | ¥9,185 | ¥7,689 |
| YoY −4% | ¥10,222 | ¥8,425 | ¥8,571 | ¥9,585 | ¥8,024 |
| Flat vs prior year (0%) | ¥10,648 | ¥8,776 | ¥8,928 | ¥9,984 | ¥8,358 |
| YoY +4% | ¥11,074 | ¥9,127 | ¥9,285 | ¥10,383 | ¥8,692 |
| YoY +8% | ¥11,500 | ¥9,478 | ¥9,642 | ¥10,783 | ¥9,027 |
The shaded row is flat versus the prior year (the 2025 finalized values themselves). Source: MetroEngines Research; compiled by the HotelBank Editorial Team
Read the grid horizontally and the amount given up by dropping one step (4pt) of year-on-year change is about ¥426 in August and about ¥334 in December — a spread of roughly 1.27× for the same percentage. Setting a target purely in terms of year-on-year percentage gives equal weight to high-rate months, where the yen impact is large, and low-rate months, where it is small. In building second-half pricing, it is worth holding, alongside the percentage target, a yen-based target weighted by the absolute level of the base month. November (¥9,984) and August (¥10,648) are the two months where a single point costs the most.
Summary — Three Yardsticks for Reading Pricing in Shimane
Yardstick 1: always read year-on-year change together with the prior year’s absolute level. City hotels’ −8.2% in July also reflects the prior July having been ¥9,074, the third-highest month of 2025. The ¥8,328 of July 2026 is almost identical to June of the same year, so the level itself has not broken down. Moving price on the percentage alone makes a misjudgement easy.
Yardstick 2: for a small-sample series, read the slope across several months rather than one. City hotels are N=10 properties. April at +11.9% and July at −8.2% coexisting in the same year is partly a product of that small sample. On the January–July average the segment sits at +0.9%, above the prior year, and that is the more stable reading. Business hotels, at N=56 properties, show a steady shape: +2.9% on average with six positive months.
Yardstick 3: the segment spread works as a measure of how well a premium can be explained. July’s spread narrowed from +25.0% a year earlier to +13.1%, and in January–February it had all but disappeared. Months with a thin spread are an opportunity for the upper segment to rebuild on the product side, and an opportunity for the lower segment to reach into the higher price band. From either position, keeping the month-by-month spread on a single chart makes it easier to set priorities for rate revisions.
About the Data
| Definition of estimated OCC | Occupancy on an OTA-listed-inventory basis = 100 − 100 × rooms still listed on OTAs ÷ total rooms. It is an estimate based on how far inventory offered for sale on OTAs has been taken up, and is defined differently from actual room occupancy (it reads higher). The months covered in this article are April–July 2026 (Shimane Prefecture). |
| Observation window | Booking curve: based on observations from 45 days before the stay date through to the most recent observation. |
| Definition of the settled ADR estimate | A transaction-price level (tax-exclusive equivalent) inferred from OTA and other distribution data (cheapest-plan level × a segment-specific coefficient, ensembled across multiple channels). Past months are finalized values; the current and future months are estimates based on present on-sale conditions. Median error against published operating results is 6.6%. Every year-on-year comparison in this article is between finalized months, and months from August 2026 onward are excluded from the calculation. |
| Breakdown of N | Settled ADR estimate: Shimane Prefecture business hotels N=52–56 properties (N=56 in July 2026, N=55 in July 2025), city hotels N=10 properties (every month from January 2025 through July 2026). Estimated OCC: for July 2026, 47–51 business-hotel properties and 5,368 total rooms, and 10 city-hotel properties and 724 total rooms. New openings comprise the 12 properties and 331 rooms confirmed in Shimane Prefecture in 2026 (on an OTA-listing-confirmed basis). OTA listings often begin several months before opening, and many properties are listed only after opening, so property and room counts for the most recent months onward may rise with future listings (they are structurally understated). Read alongside the building-plan pipeline on a construction-application basis (Ministry of Land, Infrastructure, Transport and Tourism, “Statistical Survey on Building Construction Dynamics”). |
| Data as of | Data as of 25 August 2026. On-sale conditions and inventory change daily, so the figures in this article are a snapshot at the time of retrieval. |
Source: MetroEngines Research; compiled by the HotelBank Editorial Team
■ Data Sources
The settled ADR estimate, estimated OCC and the count of new openings within the prefecture all come from MetroEngines Research aggregated data (Shimane Prefecture, as of 25 August 2026). For the supply pipeline on a building-plan basis, read alongside the Ministry of Land, Infrastructure, Transport and Tourism’s “Statistical Survey on Building Construction Dynamics”. Links within the article point to HotelBank articles.
■ Calculation Assumptions
Year-on-year change is calculated only between finalized past months; months from August 2026 onward, which are not yet finalized and rest on a different basis (forward on-sale conditions), are excluded from the comparison. The January–July average is a simple average of the individual months. The segment spread is the difference between the city-hotel and business-hotel settled ADR estimates, and the premium rate takes business hotels as the denominator. The second-half landing range (Table 5) and the sensitivity grid (Table 6) are mappings that apply year-on-year rates to finalized August–December 2025 levels; they are not forecasts. The rates applied are the quartiles of the seven actual months of January–July 2026.
■ Limitations and Notes
The settled ADR estimate is a transaction-price level inferred from distribution data; median error against published operating results is 6.6%. Estimated OCC rests on OTA-listed inventory and therefore reads higher than actual room occupancy. City hotels are a small sample at N=10 properties, so a single month’s year-on-year change is strongly affected by the selling stance and inventory mix of a few properties. The 12 new openings and 331 rooms within the prefecture are on an OTA-listing-confirmed basis, and because some properties are listed only after opening, the most recent months onward are structurally understated. Tables 5 and 6 are mappings of amplitude observed in the past and do not incorporate changes in the demand environment or in supply.
Related Reading
- Shimane Hotel Market: Kamiarizuki’s 4-Tier ADR Split, +59.3% Peak
- Yamaguchi Settled ADR H1 2026: Business +3.4%, City Hotels −6.4%
- Aichi Settled ADR 18 Months: City Swings 25.0pt, Business 14.0pt
- Yamagata ADR Splits by Segment: Business −4.8% in April, City +12.5%
- Tochigi ADR Splits by Type: Business +1.6%, City −4.1%, Ryokan +6.8%
- Hokkaido Business Hotels Aren’t Weekend-Led: Thu 95.4% Ties Sat 95.4%
- Kyoto Day-of-Week OCC: Thursday 90.4% Edges Friday, May–Jul 2026