

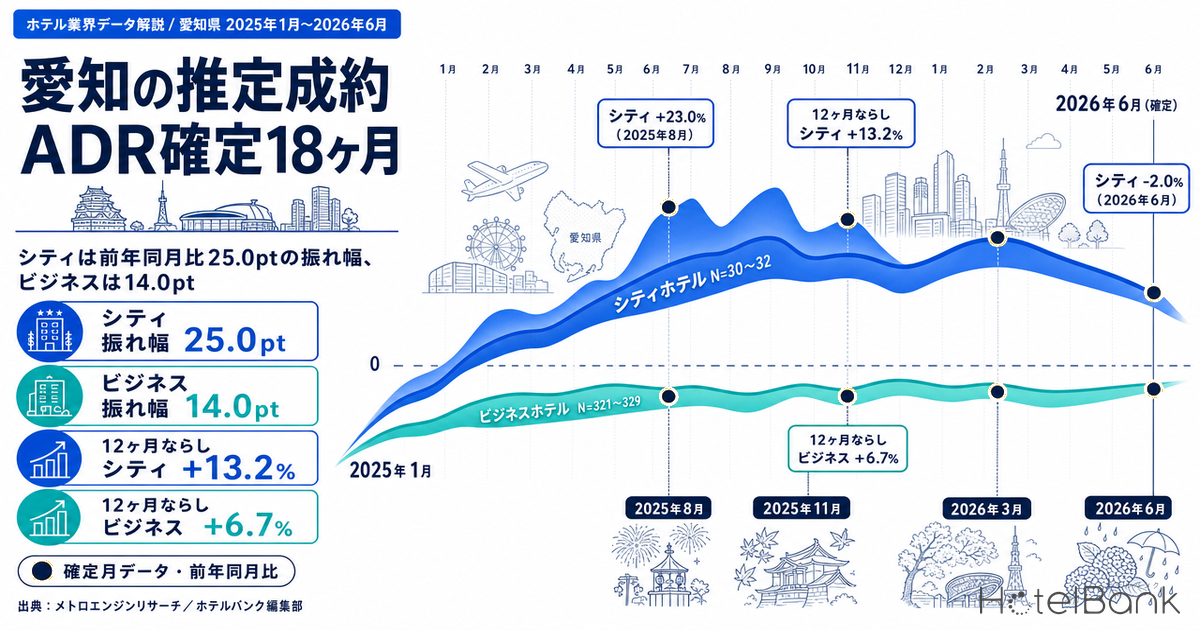
Lining up 18 months of confirmed data for Aichi Prefecture (January 2025 through June 2026), the year-on-year change in estimated settled ADR averaged +11.9% for city hotels and +6.7% for business hotels. What deserves attention, however, is not the average but the spread. City hotel YoY figures scattered across a 25.0-point band, from a low of -2.0% (June 2026) to a high of +23.0% (August 2025), while business hotels stayed inside 14.0 points, from -0.1% (June 2026) to +13.9% (October 2025). Within the same market over the same period, one category swings widely from month to month while the other holds close to flat. And in the most recent confirmed month, June 2026, both categories landed slightly below the prior year. Should a single month’s YoY reading move your pricing? This article builds that decision framework using confirmed values only.
Scope: city hotels in Aichi Prefecture, N=30-32 properties; business hotels, N=321-329 properties. The price metric used throughout is estimated settled ADR (the settled price level inferred from OTA and other sales data, pre-tax equivalent); occupancy is an estimate on an OTA-listed-inventory basis. Definitions for both appear at the end of the article. Data as of July 31, 2026.
- — Across 18 confirmed months in Aichi (January 2025 to June 2026), YoY estimated settled ADR averaged +11.9% for city hotels and +6.7% for business hotels. City hotels posted the larger gain.
- — The spread was 25.0pt for city hotels (-2.0% to +23.0%) versus 14.0pt for business hotels (-0.1% to +13.9%). Even within one market, the band in which a single month can normally swing differs by category.
- — Months falling within +/-5pt of the category average numbered 14 of 18 for business hotels and 10 of 18 for city hotels. How far a single-month outlier can be read as a market signal therefore depends on the category.
- — Smoothed over 12 months, the figures converge to +13.2% for city hotels and +6.7% for business hotels. Use the smoothed value for the medium-term price band and the single month for short-term selling tactics.
- — The pattern of November as the yearly high and January-February as the yearly low held in both 2024 and 2025. The simultaneous June 2026 decline also sits on top of that recurring shape, in which June is a low month.
YoY Across 18 Confirmed Months: City +11.9%, Business +6.7% on Average
First, the ground rules. Every comparison here is between estimated settled ADR figures that have been confirmed as past months. Months from July 2026 onward are estimates based on current sales conditions, and since a straight comparison against confirmed values has to wait for month-end confirmation, they are not used anywhere in this article’s YoY figures. That leaves 18 comparable confirmed months, January 2025 through June 2026, each matched against the same month a year earlier (January 2024 through June 2025).
Averaged across the 18 months, city hotels came in at +11.9% and business hotels at +6.7%. Room rates in Aichi are rising in both categories, and the gain is larger for city hotels. Reading that average as “city hotels are up double digits all year,” however, will trip you up in practice. Of the 18 months, business hotels landed within +/-5 points of their own category average in 14 months, while city hotels managed only 10. That works out to city hotels producing a month well off the average more than once every three months.
The table below breaks out the most recent 12 months (July 2025 to June 2026). City hotels surged +23.0% in August 2025 and +20.5% in January 2026, then fell back to +4.5% in April 2026 and -2.0% in June 2026. Over the same 12 months, business hotels topped out at +13.9% and bottomed at -0.1%, staying inside the city hotel range at both ends.
| Confirmed month | City settled ADR |
Prior-year month | YoY | N | Business settled ADR |
Prior-year month | YoY | N |
|---|---|---|---|---|---|---|---|---|
| Jul 2025 | ¥11,684 | ¥10,662 | +9.6% | 31 | ¥7,584 | ¥6,927 | +9.5% | 327 |
| Aug 2025 | ¥13,368 | ¥10,864 | +23.0% | 30 | ¥8,149 | ¥7,398 | +10.2% | 324 |
| Sep 2025 | ¥11,803 | ¥10,004 | +18.0% | 30 | ¥7,638 | ¥7,005 | +9.0% | 324 |
| Oct 2025 | ¥12,996 | ¥10,872 | +19.5% | 30 | ¥7,815 | ¥6,862 | +13.9% | 322 |
| Nov 2025 | ¥13,798 | ¥12,286 | +12.3% | 30 | ¥8,416 | ¥7,747 | +8.6% | 325 |
| Dec 2025 | ¥12,824 | ¥10,945 | +17.2% | 30 | ¥7,681 | ¥7,436 | +3.3% | 325 |
| Jan 2026 | ¥13,228 | ¥10,978 | +20.5% | 30 | ¥7,774 | ¥6,924 | +12.3% | 328 |
| Feb 2026 | ¥12,014 | ¥10,745 | +11.8% | 30 | ¥7,471 | ¥7,311 | +2.2% | 329 |
| Mar 2026 | ¥13,850 | ¥12,092 | +14.5% | 30 | ¥8,087 | ¥7,415 | +9.1% | 329 |
| Apr 2026 | ¥13,230 | ¥12,665 | +4.5% | 30 | ¥8,087 | ¥7,899 | +2.4% | 327 |
| May 2026 | ¥13,393 | ¥11,979 | +11.8% | 30 | ¥8,192 | ¥8,035 | +2.0% | 328 |
| Jun 2026 | ¥11,470 | ¥11,701 | -2.0% | 30 | ¥7,330 | ¥7,339 | -0.1% | 324 |
Source: MetroEngines Research; compiled by the HotelBank Editorial Team
Only one month out of the 18 fell below its prior-year counterpart in either category: June 2026. City hotels came in around ¥11,500 (versus roughly ¥11,700 a year earlier) and business hotels around ¥7,300 (against roughly ¥7,300 a year earlier). The decline itself is small, but it is worth noting that the sign flipped in both categories at once, at the end of 18 months of gains. If only one category had dropped, property mix or a one-off factor would be the first suspect; because two categories that differ in scale and guest base moved the same way in the same month, the natural reading is that this reflects the demand environment for June itself.
Source: MetroEngines Research; compiled by the HotelBank Editorial Team
The Spread in Absolute Terms: ¥2,380 for City, ¥1,086 for Business Over 12 Months
Because YoY figures are sensitive to the denominator, it is worth checking movement in the absolute level as well. Over the most recent 12 confirmed months (July 2025 – June 2026), city hotel estimated settled ADR peaked at ¥13,850 in March 2026 and bottomed at ¥11,470 in June 2026. The ¥2,380 gap equals 18.6% of the ¥12,805 average for the period. Business hotels peaked at ¥8,416 in November 2025 and bottomed at ¥7,330 in June 2026, a ¥1,086 gap equal to 13.8% of the ¥7,852 average. In absolute yen and as a share of the average alike, city hotels occupy the wider band.
What about the smoothed 12-month level? The July 2025 – June 2026 average was roughly ¥12,800 for city hotels against roughly ¥11,300 for the preceding 12 months (July 2024 – June 2025), a gain of +13.2%. For business hotels the comparison is roughly ¥7,900 against roughly ¥7,400, or +6.7%. Comparing first halves (January-June 2026 versus January-June 2025) gives roughly ¥12,900 against ¥11,700 for city hotels, +10.0%, and roughly ¥7,800 against ¥7,500 for business hotels, +4.5%. City hotels swing from -2.0% to +23.0% in single months, yet smoothed over 12 months they converge on a single figure of +13.2%. That is the first fork to recognize in any pricing decision. The same yardstick – YoY between confirmed months – applied to another prefecture appears in Fukuoka Settled ADR +10.9% in H1 2026 While Osaka Falls 32.8% in June, where the sign itself reverses in some areas.
| Metric (confirmed months only) | City hotels | Business hotels |
|---|---|---|
| Average YoY over 18 months | +11.9% | +6.7% |
| Minimum / maximum YoY | -2.0% / +23.0% | -0.1% / +13.9% |
| Spread of the above | 25.0pt | 14.0pt |
| Months with YoY within +/-5pt of category average | 10 of 18 months | 14 of 18 months |
| Highest month in the last 12 confirmed months | ¥13,850 (March 2026) | ¥8,416 (November 2025) |
| Lowest month in the last 12 confirmed months | ¥11,470 (June 2026) | ¥7,330 (June 2026) |
| High minus low (vs. average) | ¥2,380 (18.6%) | ¥1,086 (13.8%) |
| YoY on a 12-month smoothed basis | +13.2% | +6.7% |
| YoY, first half vs. first half (Jan-Jun) | +10.0% | +4.5% |
| Property count (range across confirmed months) | N=30-32 | N=321-329 |
Source: MetroEngines Research; compiled by the HotelBank Editorial Team
Source: MetroEngines Research; compiled by the HotelBank Editorial Team
The difference in sample size also matters when reading this gap. Aichi city hotels number N=30-32 properties in confirmed months, against N=321-329 for business hotels. With a sample one-tenth the size, a single large city hotel property – its occupancy mix, or how a convention lands – can push the prefecture-wide median up or down. The business hotel median, drawn from more than 300 properties, smooths individual circumstances out and produces a flatter monthly series. In other words, the structural contrast of swinging city hotels versus steady business hotels reflects both a difference in the character of demand and a difference in sample size. Keep that in mind when benchmarking your own property against the market.
Inside the Swing: The Shape That Repeats Every Year, and the Moves Unique to One Year
Not every single-month swing can be dismissed as noise. Mixed into the movement are a seasonal shape that appears in the same month every year – calendar-driven – and moves specific to that year’s demand environment. To separate the two, we calculated a seasonal index setting each year’s 12-month average to 100, for 2024 and 2025, the two years with a complete 12 months of data.
| Seasonal index (annual average = 100) |
Jan | Feb | Mar | Apr | May | Jun | Jul | Aug | Sep | Oct | Nov | Dec |
|---|---|---|---|---|---|---|---|---|---|---|---|---|
| City 2024 | 94.2 | 91.3 | 102.8 | 100.6 | 105.4 | 100.4 | 98.3 | 100.2 | 92.3 | 100.3 | 113.3 | 100.9 |
| City 2025 | 89.8 | 87.9 | 99.0 | 103.6 | 98.0 | 95.8 | 95.6 | 109.4 | 96.6 | 106.4 | 112.9 | 104.9 |
| Business 2024 | 94.9 | 97.5 | 100.3 | 102.9 | 100.1 | 96.5 | 97.1 | 103.7 | 98.2 | 96.2 | 108.6 | 104.2 |
| Business 2025 | 90.1 | 95.1 | 96.5 | 102.8 | 104.6 | 95.5 | 98.7 | 106.1 | 99.4 | 101.7 | 109.5 | 100.0 |
Source: MetroEngines Research; compiled by the HotelBank Editorial Team
Laying the two years side by side reveals several recurring shapes. First, November is the highest month of the year in both categories and both years (city 113.3 then 112.9; business 108.6 then 109.5). Second, January and February fall below 100 in both categories and both years, with city hotel February the deepest at 91.3 then 87.9. Third, August lifted in 2025 relative to 2024 – city hotels from 100.2 to 109.4, business hotels from 103.7 to 106.1. Because the November peak and the early-year trough land in the same position two years running, they can be built into the calendar in advance. Months like August, whose height changes from year to year, have to be checked against that year’s demand environment each time. For 2026, how the Asian Games held from September into October affect prefecture-wide demand belongs squarely in that year-specific category.
The same yardstick applied to the first half of 2026 gives this. Indexing to the January-June 2026 average as 100, city hotels read 102.8 in January, 93.4 in February, 107.7 in March, 102.8 in April, 104.1 in May and 89.2 in June. What carries over from the prior two years is the shape: a low February against a high March, and a decline in June. Business hotels show the same, with a first-half 2026 index of 99.4 in January, 95.5 in February, 103.4 in March, 103.4 in April, 104.7 in May and 93.7 in June – June the lowest of the six. The negative June 2026 YoY readings (city -2.0%, business -0.1%) are best read as that recurring shape – June is a low month – combined with a somewhat high June a year earlier, which together flipped the sign. It is too early to call a market turn from the sign of a single month.
Source: MetroEngines Research; compiled by the HotelBank Editorial Team
Converting the Spread into a Yardstick for Your Property: Three Bands and a Two-Axis Grid
Every figure so far describes the Aichi market, not any single property. To think about where your own monthly rate sits within these bands, the YoY range drawn from the 18 confirmed months is converted here into absolute levels. Everything below is a conversion between confirmed values already cited in this article, not a forecast. No estimate for a future month is used.
Applying the minimum, average and maximum YoY figures from the 18 confirmed months to the prior-year 12-month smoothed level (roughly ¥11,300 for city hotels and ¥7,400 for business hotels) produces the following three bands.
| YoY applied | City YoY | City level | Business YoY | Business level |
|---|---|---|---|---|
| Pessimistic (minimum of the 18 confirmed months) | -2.0% | ¥11,074 | -0.1% | ¥7,393 |
| Mid (average of the 18 confirmed months) | +11.9% | ¥12,645 | +6.7% | ¥7,896 |
| Optimistic (maximum of the 18 confirmed months) | +23.0% | ¥13,899 | +13.9% | ¥8,429 |
| Reference: actual (last 12 confirmed months, smoothed) | +13.2% | approx. ¥12,800 | +6.7% | approx. ¥7,900 |
Source: MetroEngines Research; compiled by the HotelBank Editorial Team
For city hotels the gap between the pessimistic and optimistic cases widens to ¥2,825 (¥13,899 minus ¥11,074), while for business hotels it stays at ¥1,036 (¥8,429 minus ¥7,393). The mid band (¥12,645 for city, ¥7,896 for business) sits almost exactly on the actual 12-month smoothed figures of roughly ¥12,800 and ¥7,900. However widely individual months scatter, smoothing returns them to the mid band – a pattern the absolute levels confirm as well.
Two-axis grid: prior-year monthly level x YoY
In day-to-day work the useful question is often “given what my property did in the same month last year, what would this year look like at the market’s growth rate?” Put the prior-year monthly level on the vertical axis and YoY on the horizontal, and the current-year level follows from a single line: current year = prior-year month x (1 + YoY). The two tables below step through only the observed ranges cited in this article on both axes. The shaded cell marks each category’s mid case (average YoY x the midpoint prior-year level).
| Prior-year month settled ADR | -2.0% | +4.5% | +11.9% | +18.0% | +23.0% |
|---|---|---|---|---|---|
| ¥10,050 | ¥9,849 | ¥10,502 | ¥11,246 | ¥11,859 | ¥12,362 |
| ¥10,700 | ¥10,486 | ¥11,182 | ¥11,973 | ¥12,626 | ¥13,161 |
| ¥11,350 | ¥11,123 | ¥11,861 | ¥12,701 | ¥13,393 | ¥13,960 |
| ¥12,000 | ¥11,760 | ¥12,540 | ¥13,428 | ¥14,160 | ¥14,760 |
| ¥12,650 | ¥12,397 | ¥13,219 | ¥14,155 | ¥14,927 | ¥15,560 |
Source: MetroEngines Research; compiled by the HotelBank Editorial Team
| Prior-year month settled ADR | -0.1% | +2.2% | +6.7% | +10.2% | +13.9% |
|---|---|---|---|---|---|
| ¥6,900 | ¥6,893 | ¥7,052 | ¥7,362 | ¥7,604 | ¥7,859 |
| ¥7,180 | ¥7,173 | ¥7,338 | ¥7,661 | ¥7,912 | ¥8,178 |
| ¥7,460 | ¥7,453 | ¥7,624 | ¥7,960 | ¥8,221 | ¥8,497 |
| ¥7,740 | ¥7,732 | ¥7,910 | ¥8,259 | ¥8,529 | ¥8,816 |
| ¥8,020 | ¥8,012 | ¥8,196 | ¥8,557 | ¥8,838 | ¥9,135 |
Source: MetroEngines Research; compiled by the HotelBank Editorial Team
The width of each grid is itself the band within which a single month can normally swing for that category. From the same prior-year level of ¥11,350, city hotels span ¥11,123 to ¥13,960 across the observed YoY range – a ¥2,838 gap. Business hotels, from a prior-year level of ¥7,460, span ¥7,453 to ¥8,497, a gap of ¥1,044. As long as your property’s monthly figure moves inside that band, it can be read as within the market’s shape. Only when it moves outside is it worth going looking for property-specific causes.
For Revenue Managers Running City and Business Hotels in Aichi: Implications and an Action Plan
(1) A single month’s YoY figure carries different weight depending on the category. Business hotels land within +/-5pt of their category average in 14 of 18 months, so when a single month departs sharply from the average it is worth treating as a signal that something is happening on the market side. City hotels stay within +/-5pt in only 10 months and scatter across 25.0 points, from -2.0% to +23.0%. If you run a city hotel, start from the assumption that a month off the average is not unusual in itself. The idea is to hold different thresholds, by category, for when to move and when not to.
(2) Use the 12-month smoothed figure and the single month for different purposes. City hotels swing from -2.0% to +23.0% month by month, yet settle into a single value of +13.2% smoothed over 12 months and +10.0% comparing first halves. The straightforward split is to tie the smoothed value to the medium-term question of where to place your annual price band relative to the whole market, and the single month to the short-term question of whether to fine-tune how you sell that month. Using a single month as medium-term input makes it easy, in the city hotel segment, to mistake the edge of the market band for its center.
(3) Separate the shape that repeats from the moves unique to one year. November as the highest month of the year (city 113.3 and 112.9; business 108.6 and 109.5) and January-February below 100 held in both 2024 and 2025. That part can be filled into the rate-revision calendar in advance. Months like August, where the city hotel index moved from 100.2 to 109.4 between years, should be kept separate: not fixed on the calendar, but decided after watching how bookings come in that year.
(4) Match the market band against your own position using confirmed values. Across the last 12 confirmed months in Aichi, city hotel estimated settled ADR moved within a ¥11,470-¥13,850 band and business hotels within ¥7,330-¥8,416. Start by placing your property’s actual rate for each month somewhere inside that band. Note that the lowest month is June 2026 in both categories, which confirms across categories that June was a weak month for Aichi as a whole. If your own June was down, that agreement lets you separate property-specific circumstances from the shape of the market.
The action plan below organizes the above by time horizon. None of these are prescriptions; they are entry points for a discussion grounded in confirmed values.
| Horizon | Action | Decision trigger (figures from this article) | Purpose |
|---|---|---|---|
| Today to this week | Line up your property’s June 2026 actuals against the confirmed market values | The market read ¥11,470 for city hotels (-2.0% YoY) and ¥7,330 for business hotels (-0.1%). If your June fell further YoY than that, something remains that the shape of the market alone cannot explain | Separate June weakness into market factors and property factors |
| Today to this week | Document a category-specific threshold for when a single month triggers action | City hotels fall within +/-5pt of their category average in 10 of 18 months, business hotels in 14 of 18. Applying one threshold to both means over-reacting on the city hotel side | Reduce reflexive rate moves driven by single-month noise |
| Within two weeks | Review your annual price band against the 12-month smoothed level | Smoothed over the last 12 months the market read approx. ¥12,800 for city hotels (+13.2%) and approx. ¥7,900 for business hotels (+6.7%). If growth in your annual average rate stays below that, there is room to consider repositioning the band itself | Insulate the medium-term price band from single-month noise |
| Within two weeks | Build a 12-month calendar that color-codes months that repeat every year against months that vary by year | November is the yearly high in both categories and both years (city 113.3 and 112.9; business 108.6 and 109.5) and January-February sit below 100 in both years, while August moved from 100.2 to 109.4 for city hotels between years | Separate the lead time for rate revisions month by month |
| Looking to next month | Set autumn-into-November pricing early, on the assumption that the recurring shape holds | The November seasonal index was the yearly high two years running – city 113.3 then 112.9, business 108.6 then 109.5. If your November is still priced at the annual average, it is a candidate for review | Avoid selling the highest month as an extension of a normal one |
| Looking to next month | Fix the date when confirmed values become complete as the standing monthly review day | The confirmed months usable for YoY in this article run through June 2026. Later months are estimates based on current sales conditions, and a YoY comparison can only be built once they are confirmed | Keep unconfirmed figures from moving annual policy |
Source: MetroEngines Research; compiled by the HotelBank Editorial Team
Conclusion: Three Yardsticks
The 18 confirmed months in Aichi yield three yardsticks.
Yardstick 1: hold a separate normal-swing band for each category. City hotel YoY figures scattered across 25.0 points (-2.0% to +23.0%) while business hotels stayed within 14.0 points (-0.1% to +13.9%). In absolute terms, high minus low over the last 12 confirmed months was ¥2,380 for city hotels (18.6% of the average) and ¥1,086 for business hotels (13.8%). The same one month of change is worth being surprised by at very different magnitudes depending on the category.
Yardstick 2: smoothed for the medium term, single month for the short term. City hotels move from -2.0% to +23.0% month by month yet read +13.2% smoothed over 12 months and +10.0% comparing first halves; business hotels read +6.7% and +4.5%. Simply refusing to use a single month when setting the annual price band changes how stable your decisions are.
Yardstick 3: fill in the recurring shape in advance and check the variable months each time. November as the yearly high and January-February as the yearly low held in both 2024 and 2025. August, by contrast, changes height from year to year. Assign the former to the rate-revision calendar and the latter to the monthly review. The simultaneous decline in June 2026 also belongs on top of that recurring shape, in which June is a low month.
When a single month’s figure moves, the question to ask is not whether it moved but whether the move sits inside or outside the recurring shape. The 18 confirmed months in Aichi provide the baseline for asking it.
About the Data
- Estimated settled ADR: the settled price level (pre-tax equivalent) inferred from OTA and other sales data (lowest-plan level x category coefficient, ensembled across multiple channels). Past months are confirmed values; current and future months are estimates based on current sales conditions. Median error against published operating results is 6.6%.
- All YoY figures in this article compare confirmed values (past months) with one another. Months from July 2026 onward are estimates based on current sales conditions and may move as those conditions change, so a straight comparison against confirmed values waits for month-end confirmation.
- Sample: Aichi city hotels number N=30-32 properties across confirmed months (N=30 in June 2026); business hotels N=321-329 (N=324 in June 2026). Both are monthly aggregations on an area-median basis.
- The seasonal index sets each year’s 12-month average to 100 (2024 and 2025). Because only the first half of 2026 is confirmed, 2026 is calculated separately as a within-first-half index setting the January-June 2026 average to 100.
- This article covers monthly estimated settled ADR only; occupancy and booking-curve data are not used in the analysis. For reference, estimated OCC on an OTA-listed-inventory basis is defined as: occupancy = 100 – 100 x rooms still listed on OTAs / total rooms. It is an estimate based on how listed inventory is being absorbed and is defined differently from actual room occupancy (it reads higher).
- Data as of July 31, 2026. Because sales conditions and inventory change daily, the figures in this article are a snapshot at the time of retrieval.
References and Sources
Data sources
Monthly aggregation of OTA public price and inventory data by MetroEngines Research & Consulting. Coverage is city hotels in Aichi Prefecture (N=30-32 properties in confirmed months) and business hotels (N=321-329), over the confirmed months from January 2024 through June 2026. Estimated settled ADR uses monthly values on an area-median basis.
Calculation assumptions
YoY figures are calculated solely between confirmed months (January 2025 – June 2026 against January 2024 – June 2025); no estimate from July 2026 onward is used. The seasonal index sets each year’s 12-month average to 100 (for 2026, the six-month first-half average is set to 100). The conversions in Tables 5 through 7 use only the definitional identity “current-year estimated settled ADR = prior-year monthly estimated settled ADR x (1 + YoY),” and both axes stay inside the ranges actually observed in this article. They are not forecasts of future levels.
Limitations and caveats
Estimated settled ADR is inferred from OTA public data, with a median error of 6.6% when checked against published operating results. The city hotel sample is small at N=30-32 properties, so the occupancy mix of a single large property or the timing of a convention can readily shift the prefecture-wide median (with more than 300 properties, individual factors are smoothed out on the business hotel side). Because this article covers estimated settled ADR only and does not use occupancy or booking-curve data, it does not address how rate movement flows through to revenue (RevPAR). The figures are a snapshot as of July 31, 2026 and may be revised slightly in later re-aggregations.