

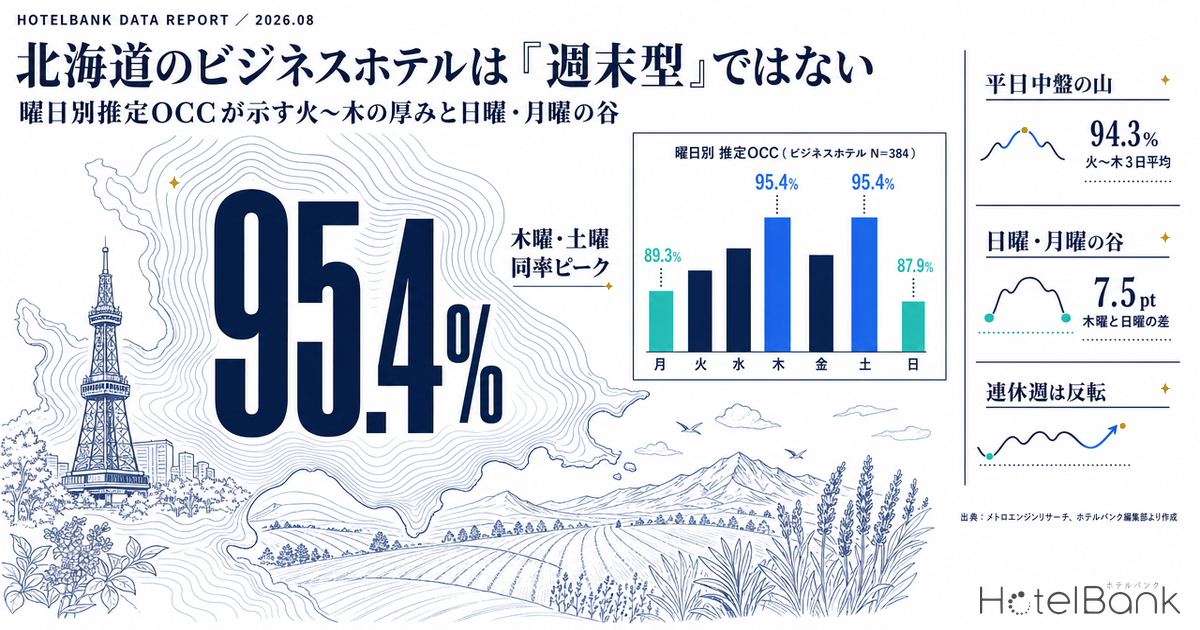
Hokkaido’s business hotel market, on June–July 2026 actuals, took a shape in which Thursday at 95.4% and Saturday at 95.4% tied for the peak, while Sunday at 87.9% and Monday at 89.3% formed the trough. It is true that there is a peak at the weekend — but the peak is not at the weekend “only.” Tuesday 93.1%, Wednesday 94.5% and Thursday 95.4% make the middle of the week thick, and against this three-day Tuesday–Thursday average of 94.3%, the two-day Sunday–Monday average is 88.6%. The gap is 5.7pt. In other words, what a revenue manager in Hokkaido’s business market needs to fill is not the weekend but Sunday and Monday. This article organises the day-of-week shape by property type, the same shape already showing up in a normal week in September, and the phenomenon of that shape inverting during a holiday week — using the occupancy axis alone.
About the data in this article Coverage: all property types in Hokkaido, N=1,314 properties (main types: business hotels 384, city hotels 73, ryokan 256, resort hotels 133 — each the median daily observed property count for June–July 2026; because the types are aggregated individually, they do not sum to the all-types figure). The price metric in this article is estimated settled ADR (a settled price level inferred from sales data such as OTAs, approximately tax-exclusive), and occupancy is an estimate based on OTA-listed inventory. Definitions for both appear at the end of the article. Data as of: August 20, 2026.
- — Thursday 95.4% and Saturday 95.4% tie for the peak. Hokkaido’s business hotels are not “weekend-led”: the three-day Tuesday–Thursday average of 94.3% stands alongside Saturday in a twin-peak structure (June and July 2026 actuals, N=384 properties).
- — The trough is Sunday 87.9% and Monday 89.3%. Their character differs: Sunday adds only +4.7pt from T-45 to T-24 and needs to be captured early, whereas Monday adds +6.5pt and still has room to move late.
- — The share of properties with no listed inventory is 45.5% on Thursday against 19.5% on Sunday — a 26.0pt gap. That is wider than the 7.5pt gap in estimated OCC, which reads as competitors’ inventory running dry on Thursday while Friday at 26.4% and Sunday remain days on which inventory is left over.
- — The position of the trough changes by property type. Ryokan are a single-Saturday-peak type at Saturday 92.3% and Monday 83.8%, while business hotels are a thick-weekday type. Even within the same prefecture, the day that needs filling differs.
- — Holiday weeks invert the day-of-week rule. Across the five-day run of September 19–23, 2026, at the T-45 cross-section Sunday September 20 is the highest in the week at 88.6%, and Wednesday September 23 the lowest at 70.2%.
Estimated OCC by day of week at Hokkaido business hotels — the peak is Tuesday–Thursday, the trough Sunday and Monday
Averaging actual daily estimated OCC (OTA-listed inventory basis) for June and July 2026 by day of week, Hokkaido business hotels (N=384 properties) take the following shape. Monday 89.3%, Tuesday 93.1%, Wednesday 94.5%, Thursday 95.4%, Friday 92.7%, Saturday 95.4%, Sunday 87.9%.
Three things are worth noting. First, the peak is a tie between Thursday and Saturday at 95.4%. A shape that in many markets gets lumped together as “weekend-led” has, in Hokkaido’s business market, a second peak on the weekday side. Second, Friday at 92.7% falls below Wednesday at 94.5%. Friday, treated as the gateway to the weekend, is in fact at roughly the same level as Tuesday at 93.1% and thinner than Wednesday or Thursday. Third, the trough is Sunday at 87.9%, with Monday at 89.3% next. The gap between Thursday and Sunday reaches 7.5pt.
This shape is not a single-month coincidence. For June alone, estimated OCC by day of week at business hotels was Monday 87.7%, Tuesday 92.0%, Wednesday 93.2%, Thursday 94.2%, Friday 91.5%, Saturday 93.9%, Sunday 85.3%; for July alone, Monday 91.3%, Tuesday 94.5%, Wednesday 95.5%, Thursday 96.4%, Friday 93.6%, Saturday 96.8%, Sunday 90.6%. The level is a notch higher in July (91.0% in June rising to 94.2% in July on a monthly average), but the rank order across days of the week is almost identical — in both months Sunday is last and Thursday the highest weekday. In June, Thursday at 94.2% exceeded Saturday at 93.9%; in July, Saturday at 96.8% edged Thursday at 96.4%. Smoothed across the two months, they come out level. The pattern of “Sunday and Monday forming two consecutive troughs” is not unique to Hokkaido — the same twin trough is confirmed in Saitama Business Hotels: Sat 77.2% vs Sun 70.1%, Gap Widens to 11pt.
Source: MetroEngines Research; compiled by the HotelBank Editorial Team
The trough sits in a different place by property type — ryokan and resorts peak only on Saturday, business hotels run thick on weekdays
Even within Hokkaido, splitting by property type produces entirely different day-of-week shapes. The table below averages June–July 2026 actuals by property type and day of week, and also shows “the share of properties for which no listed inventory can be confirmed on OTAs or similar channels (estimated; hereafter, the share of properties with no listed inventory).”
| Property type (N=properties) | Mon | Tue | Wed | Thu | Fri | Sat | Sun | Max−Min |
|---|---|---|---|---|---|---|---|---|
| Business hotels (N=384) | 89.3% | 93.1% | 94.5% | 95.4% | 92.7% | 95.4% | 87.9% | 7.5pt |
| City hotels (N=73) | 89.1% | 91.5% | 92.8% | 94.0% | 93.4% | 95.2% | 90.0% | 6.1pt |
| Ryokan (N=256) | 83.8% | 85.0% | 85.8% | 85.9% | 86.4% | 92.3% | 86.0% | 8.5pt |
| Resort hotels (N=133) | 84.4% | 85.1% | 86.5% | 85.7% | 87.6% | 91.8% | 87.2% | 7.4pt |
| All types (N=1,314) | 87.9% | 90.4% | 91.7% | 92.2% | 91.2% | 94.3% | 88.2% | 6.4pt |
| <Reference> Business hotels: share with no listed inventory | 25.1% | 38.5% | 41.1% | 45.5% | 26.4% | 39.9% | 19.5% | 26.0pt |
Source: MetroEngines Research; compiled by the HotelBank Editorial Team (day-of-week averages of actual daily estimated OCC for June–July 2026. Share of properties with no listed inventory = the estimated share of properties for which no listed inventory can be confirmed on OTAs or similar channels)
Ryokan run at 92.3% on Saturday against 83.8% on Monday, and their 8.5pt swing across days of the week is the largest of the four types. Theirs is a “single-peak” shape in which only Saturday stands out, with Tuesday through Friday sitting almost flat in a 85.0–86.4% band. Resort hotels are similarly a single-Saturday-peak type, with Saturday at 91.8% the sole peak and Monday at 84.4% the trough. City hotels, by contrast, peak on Saturday at 95.2% but are followed by Thursday at 94.0% and Friday at 93.4% — a shape intermediate between business hotels and resorts.
Viewed through the share of properties with no listed inventory, the day-of-week differences at business hotels become sharper still. Thursday sits at 45.5% against Sunday at 19.5%, a gap of 26.0pt. That the gap in estimated OCC is 7.5pt while the gap in the share with no listed inventory widens to 26.0pt means that on Thursday the count of properties that sell out stacks up substantially, whereas on Sunday inventory is left over across the market as a whole. Friday, moreover, records estimated OCC of 92.7% (average of June and July 2026 actuals, N=384 properties) yet a no-listed-inventory share of just 26.4%, on a par with Monday: the market may be full, but few properties are selling down to the last room. Friday is “a day of high occupancy that is nevertheless not sold out.” The structure in which the peak flips position depending on property type is observed in other prefectures too, and Kumamoto Day-of-Week Occupancy Inverts by Type: Thu 88.3% vs Sat 89.9% digs into the same angle.
The same shape is already showing up ahead of time in a normal week in September
This day-of-week shape is not a thing of the past. Taking the one-week normal week from Sunday, September 6 to Saturday, September 12, 2026, and cutting the booking curve for each stay date (Hokkaido, business hotels) at three cross-sections — 45, 30 and 24 days remaining — the same rank order as the June–July actuals has already emerged.
| Stay date | T-45 | T-30 | T-24 | Gain, T-45 to T-24 |
|---|---|---|---|---|
| Sep 6 (Sun) | 78.4% | 82.6% | 83.1% | +4.7pt |
| Sep 7 (Mon) | 76.6% | 82.2% | 83.1% | +6.5pt |
| Sep 8 (Tue) | 78.4% | 84.8% | 85.5% | +7.1pt |
| Sep 9 (Wed) | 78.8% | 85.3% | 86.6% | +7.8pt |
| Sep 10 (Thu) | 82.3% | 88.7% | 90.2% | +7.9pt |
| Sep 11 (Fri) | 80.5% | 85.1% | 86.7% | +6.2pt |
| Sep 12 (Sat) | 82.4% | 86.4% | 88.3% | +5.9pt |
Source: MetroEngines Research; compiled by the HotelBank Editorial Team (Hokkaido, business hotels; observed property count at T-45 of 355–377 properties)
At T-45 the most advanced dates are Thursday September 10 at 82.3% and Saturday September 12 at 82.4%, and the most behind is Monday September 7 at 76.6%. Even at T-24, Thursday stands at 90.2% while Sunday and Monday are level at 83.1%, leaving a gap of 7.1pt. The rank order seen in the June–July actuals — Thursday and Saturday the peaks, Sunday and Monday the troughs — is thus already settled more than a month before the stay date.
Looking at the size of the gain (T-45 to T-24), the middle of the week is large — Wednesday +7.8pt, Thursday +7.9pt, Tuesday +7.1pt — while Sunday at +4.7pt and Saturday at +5.9pt are small. Weekday demand thickens over the final three to four weeks, whereas Sunday barely moves from its T-45 level. The Sunday trough is not the kind of slot that can be left to fill in late; it reads as one that has to be captured from an early stage. Monday, at +6.5pt, is on the smaller side among weekdays, but because it starts so far behind at T-45 it remains level with Sunday even at T-24.
Source: MetroEngines Research; compiled by the HotelBank Editorial Team
Weeks that involve a public holiday invert the shape — Sunday becomes the peak, the following Tuesday and Wednesday the trough
That said, “Sunday and Monday are the trough” applies to normal weeks; once a holiday run is involved, the shape inverts. In September 2026, Monday the 21st is Respect for the Aged Day, Tuesday the 22nd a citizens’ holiday and Wednesday the 23rd the Autumnal Equinox, making a five-day run from Saturday the 19th (Cabinet Office, “About National Holidays”). Lining up that week’s stay dates at the T-45 cross-section gives Saturday September 19 at 86.7%, Sunday September 20 at 88.6%, Monday September 21 at 84.6%, Tuesday September 22 at 75.9%, Wednesday September 23 at 70.2% and Thursday September 24 at 73.1%.
Since Sunday September 6 in the normal week was at 78.4% at T-45, Sunday September 20 — the middle day of the holiday run — is 10.2pt higher at the same cross-section. The Sunday that ought to be a trough exceeds Saturday and becomes the most advanced stay date in the week. At the other end, Tuesday September 22 at 75.9% and Wednesday September 23 at 70.2%, in the back half of the run, fall below the same days in the normal week (Tuesday 78.4%, Wednesday 78.8%). A holiday run pulls the “nights people stay” toward the front half and hollows out the back.
The same inversion can be observed in the July actuals. Monday, July 20, 2026 was Marine Day, and actual estimated OCC at Hokkaido business hotels that day was 84.9% — 6.4pt below the July Monday average of 91.3%, making it July’s lowest Monday. Conversely, the preceding day, Sunday July 19, was at 94.6%, 4.0pt above the July Sunday average of 90.6% and July’s highest Sunday. Over a three-day weekend, Sunday becomes the peak and the Monday that closes the run becomes a deep trough. Turning days of the week into a mechanical rule guarantees losses at these inversions.
The foundation of a pricing calendar — monthly estimated settled ADR
Days of the week belong on the occupancy axis; the price axis is properly read monthly. Estimated settled ADR for Hokkaido business hotels, on final figures, was in the ¥9,500 range for June 2026 (N=429 properties) and around ¥11,200 for July (N=432 properties). Against the final figures for the same months a year earlier, June was +2.7% and July +4.1% — modest, but up in both cases. City hotels, by contrast, came in at around ¥14,800 for June 2026 (N=75 properties), −3.6% year on year, and around ¥17,800 for July (N=75 properties), −5.7% year on year, both below the prior year. This divergence in sign between city and business hotels is followed through on final monthly data in Hokkaido ADR H1 2026: City −5.7%, Business +4.1%, April the Turn.
Looking at the shape across the year, Hokkaido business hotels have a seasonal profile in which they bottom out for the year in April (around ¥7,100 in April 2026) and then climb steadily toward August. 2025 had the same shape, with July–August the annual peak and a decline setting in from October. Figures from August 2026 onward are estimates based on current sales conditions: around ¥13,200 for August, around ¥13,600 for September and around ¥12,100 for October. A straight comparison with final figures has to wait for month-end settlement, but at the very least the current picture reads as inventory selling in a shape where the summer peak extends into September.
Source: MetroEngines Research; compiled by the HotelBank Editorial Team
For revenue managers running business and city hotels in Hokkaido — implications and an action plan
1. Before reaching for “strengthen the weekend,” check whether the Tuesday–Thursday thickness is being held. Hokkaido’s business market runs at Tuesday 93.1%, Wednesday 94.5% and Thursday 95.4% — a level that stands alongside Saturday’s 95.4%. If your own day-of-week occupancy spikes on Saturday alone while Tuesday–Thursday sags, that is a divergence from the market’s shape, and the order of work is to inspect weekday product design first (early release of allocations, how corporate inventory is held). If your own Tuesday–Thursday is thick as well, then those three days are high-occupancy across the whole market, so they can be treated as a phase for defending rate rather than building occupancy.
2. What needs filling is Sunday and Monday — but they differ in character. Sunday at 87.9% and Monday at 89.3% are both troughs, yet the progression in the September normal week shows Sunday moving from 78.4% at T-45 to 83.1% at T-24, a gain of only +4.7pt, while Monday starts behind at 76.6% at T-45 and adds +6.5pt. Read Sunday as a slot that will not accumulate unless it is captured early, and Monday as one with room to move late. Applying the same lever to both “troughs” will miss one of them.
3. What the day-of-week spread in the no-listed-inventory share says about competitors. At business hotels the share of properties with no listed inventory is 45.5% on Thursday against 19.5% on Sunday, with Friday also held to 26.4%. Thursday is a day on which competitors’ inventory genuinely runs dry, so late demand may come round to your property. Friday and Sunday, on the other hand, leave inventory in the market and can be regarded as phases where it is easy to be drawn into last-minute discounting. The thinking required is to vary the late-stage lever by day of week, on the premise of whether competitors have sold out.
4. Suspend the day-of-week rule over holiday runs. Across the five-day run of September 19–23, Sunday September 20 is the highest in the week at 88.6% at the T-45 cross-section, 10.2pt above the Sunday of a normal week (78.4%). Conversely, Wednesday September 23, in the back half of the run, is the lowest in the week at 70.2%. The July 20 (Marine Day) actuals likewise show Monday at 84.9%, July’s lowest Monday. Because weeks containing a holiday run invert the “Sunday = trough” and “Monday = trough” rules, it is worth colour-coding the exception weeks on the calendar in advance.
| Time horizon | Lever | Decision trigger | Objective |
|---|---|---|---|
| Today to this week | Overlay your own day-of-week occupancy for the past two months on the by-property-type day-of-week profiles in this article and identify the days that diverge | Where your own Tuesday–Thursday average falls well short of the market’s 94.3% (business hotels) | Avoid the misdiagnosis of “our weekend is weak” |
| Today to this week | Colour-code the September holiday week (Sep 19–23) on the calendar as an exception week and lift the Sunday and Monday trough rule | Given that the Sunday in the middle of the run is currently the highest in the week at 88.6% at T-45 | Avoid losses during an inverted week |
| Within two weeks | Secure inventory allocations for multi-night products that span trough days — two nights checking in Sunday and out Monday, consecutive nights checking in Thursday | Where your own Sunday occupancy falls below the market’s 87.9% | Bundle trough days rather than selling them standalone |
| Within two weeks | Review the minimum length of stay (MLOS) restrictions set on Tuesday–Thursday and check that single-night Thursday stays are not being closed off excessively | Given the structure in which Thursday’s no-listed-inventory share is the market’s highest at 45.5% while Friday is held to 26.4% | Avoid lost opportunity on the day with the thickest demand |
| Looking to next month | Switch Sunday inventory to a practice of releasing it earlier than T-45 and stop relying on the late window | Given that Sunday’s gain from T-45 to T-24 is the smallest in the week at +4.7pt | Capture early a slot that will not accumulate late |
| Looking to next month | Align the pricing calendar with the monthly seasonal shape and lock in settings before the decline phase begins from October | Where your setting for the month in question diverges from the market’s estimated settled ADR level (business hotels, around ¥11,200 final for July 2026) | Prevent cutting too far after the peak |
Source: MetroEngines Research; compiled by the HotelBank Editorial Team
Summary — three yardsticks for reading days of the week in Hokkaido
Yardstick 1: there are two peaks. Hokkaido business hotels have a twin-peak structure of Thursday 95.4% and Saturday 95.4%, and the three-day Tuesday–Thursday average of 94.3% is at almost the same level as Saturday. The simplification “weekend-led” misses the weekday thickness in this market. That Friday at 92.7% falls below Wednesday at 94.5% likewise shows the outline of the weekend sitting differently from the usual assumption.
Yardstick 2: the trough is Sunday and Monday, and they are different animals. Sunday at 87.9% and Monday at 89.3% are the troughs. In the progression through the September normal week, Sunday adds only +4.7pt from T-45 to T-24 while Monday, though starting behind, adds +6.5pt. Split the levers: early capture for Sunday, late-window measures for Monday.
Yardstick 3: holiday weeks invert the shape. Across the five-day run of September 19–23, Sunday September 20 is the highest in the week at 88.6% at the T-45 cross-section, 10.2pt above the Sunday of a normal week. The Monday of July 20 (Marine Day) came in at 84.9% on actuals, July’s lowest Monday. Day-of-week rules are a tool for normal weeks; holiday weeks have to be handled separately.
Cross into another property type and the shape changes further. Ryokan are a single-Saturday-peak type with an 8.5pt gap between Saturday 92.3% and Monday 83.8%, with Tuesday through Friday flat in a 85.0–86.4% band. Even within the same prefecture, business hotels on one hand and resorts and ryokan on the other have entirely different “days that need filling.” Taking the shape of your own property type as the starting point is the premise for any day-of-week design.
About the data
| Item | Detail |
|---|---|
| Definition of estimated OCC | OTA-listed-inventory-based occupancy = 100 − 100 × rooms remaining on OTA listings ÷ total rooms. This is an estimate based on how inventory sold through OTAs is being absorbed, and its definition differs from actual room occupancy (it reads higher). The months covered by the day-of-week aggregation in this article are June and July 2026 (actuals), and the stay dates covered by the booking curves are September 6–12 and September 19–24, 2026. |
| Booking curves | Based on observations from 45 days before the stay date up to the most recent reading. |
| Definition of estimated settled ADR | The settled price level (tax-excluded equivalent) estimated from OTA and other sales data (lowest-plan level × property-type coefficient, ensembled across multiple channels). Past months are final figures; the current and future months are estimates based on current sales conditions. Median error against published operating results is 6.6%. |
| Breakdown of coverage N | Estimated OCC by day of week (June–July 2026, Hokkaido): all types N=1,314, business hotels N=384, city hotels N=73, ryokan N=256, resort hotels N=133 (each the median daily observed property count). Booking curves (business hotels): 355–377 properties observed at T-45. Estimated settled ADR: business hotels N=429–432 properties (June–July 2026, final), city hotels N=75 properties (same). |
| Caveats | Because the observed property count for the booking curves varies as the stay date approaches, the gains are not a net increase within an identical population. The day-of-week aggregation is carried out on the occupancy axis alone and does not extend to price levels by day of week (monthly is the canonical basis for estimated settled ADR). |
| Data as of | Data as of: August 20, 2026. Because sales conditions and inventory change daily, the figures in this article are a snapshot at the time of retrieval. |
References and sources
■ Data sources
Daily observations of OTA-listed inventory and listed prices for Hokkaido (all property types, N=1,314 properties), aggregated by MetroEngines Research. Estimated OCC by day of week averages actual daily values for June and July 2026 by day of week. Booking curves are cut by stay date at cross-sections by days remaining (355–377 properties observed at T-45). Estimated settled ADR is monthly (business hotels N=429–432 properties, city hotels N=75 properties). Because the N for each property type is aggregated individually, the types do not sum to the all-types N. Public holiday dates confirmed against the Cabinet Office, “About National Holidays.” Data as of: August 20, 2026.
■ Basis of estimates
Estimated OCC = OTA-listed-inventory-based occupancy (100 − 100 × rooms remaining on OTA listings ÷ total rooms), an estimate based on how inventory sold through OTAs is being absorbed. Its definition differs from actual room occupancy and it reads higher. Share of properties with no listed inventory = the estimated share of properties for which no listed inventory can be confirmed on OTAs or similar channels. Estimated settled ADR is the settled price level (tax-excluded equivalent) estimated from OTA and other sales data; past months are final figures, and August 2026 onward are forward estimates based on current sales conditions. The day-of-week theme is handled on the occupancy axis alone and does not extend to price levels by day of week or to daily ADR (monthly is treated as the canonical basis for estimated settled ADR).
■ Limitations and caveats
Because the observed property count for the booking curves varies as the stay date approaches, the gain between cross-sections is not a net increase within an identical population. Forward-estimated monthly ADR does not match final figures, and comparison has to wait for month-end settlement. Weeks involving public holidays and holiday runs invert the day-of-week rank order, so a normal-week aggregation cannot be applied to them as-is. Year-on-year comparison of estimated OCC is not carried out, because the observation period accumulated to date is insufficient.
– Cabinet Office, “About National Holidays” https://www8.cao.go.jp/chosei/shukujitsu/gaiyou.html (used to confirm the 2026 public holiday calendar)
– Japan Tourism Agency, “Overnight Travel Statistics Survey” https://www.mlit.go.jp/kankocho/tokei_hakusyo/shukuhakutokei.html (reference source for official occupancy statistics)
Related reading
- Saitama Business Hotels: Sat 77.2% vs Sun 70.1%, Gap Widens to 11pt
- Kumamoto Day-of-Week Occupancy Inverts by Type: Thu 88.3% vs Sat 89.9%
- Fukui Ryokan Sat 90.9% vs Mon 76.3%: Business Hotels Dip on Sunday
- Kyoto Day-of-Week OCC: Thursday 90.4% Edges Friday, May–Jul 2026
- Nagano September: Wed 58.7% vs Holiday Sat 93.0%, 34pt Gap Holds
- Hokkaido ADR H1 2026: City −5.7%, Business +4.1%, April the Turn
- Hokkaido City Hotels: Only Aug 15 Trails at 78.7% OCC, 45 Days Out