

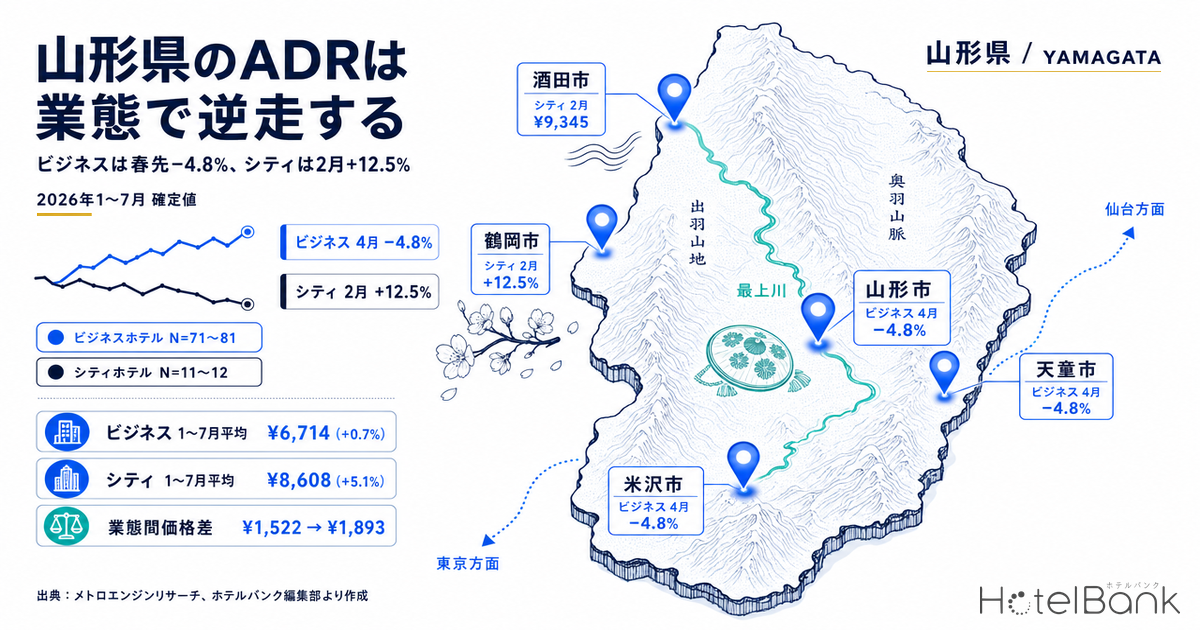
In Yamagata’s lodging market, business hotels and city hotels are moving in opposite directions on price — same prefecture, same period. Looking at finalized settled ADR estimates on a year-on-year basis for January–July 2026, business hotels fell into negative territory for three straight spring months: −2.7% in March, −4.8% in April and −1.4% in May. City hotels ran positive over exactly that stretch: +12.5% in February, +8.5% in March and +8.6% in April. Averaged across January–July, business hotels were essentially flat at +0.7% year on year (¥6,668 → ¥6,714, N=71–81 properties), while city hotels came in at +5.1% (¥8,190 → ¥8,608, N=11–12 properties). The gap between the two segments widened by ¥371, from a monthly average of ¥1,522 to ¥1,893. In Yamagata, the blanket prefecture-level question of whether “the market is strong or weak” falls apart the moment you split it by segment.
Scope: business hotels (N=71–81 properties) and city hotels (N=11–12 properties) in Yamagata Prefecture. The price metric in this article is the settled ADR estimate (the transaction price level estimated from OTA and other sales data, tax-excluded equivalent); occupancy is an estimate based on OTA-listed inventory. Definitions for both appear at the end of the article. Data as of August 24, 2026.
- — Yamagata’s settled ADR estimate runs in reverse by segment. Averaged over January–July 2026, business hotels posted +0.7% (¥6,668 → ¥6,714) against city hotels at +5.1% (¥8,190 → ¥8,608); the monthly average gap between segments widened by ¥371, from ¥1,522 to ¥1,893.
- — The signs themselves diverged in three months: March, April and July. Business hotels came in below the prior year for three straight spring months, −2.7% in March and −4.8% in April, while city hotels recorded +8.5% in March and +8.6% in April over the same period.
- — The spring weakness in business hotels is not a payback effect. Even against 2024, March was −7.6% and April −6.8% — below the level of two years earlier, meaning the shoulder-season price band has stepped down over two years.
- — Demand is not thinning. Estimated OCC for April–July 2026 stayed high at 87.0–92.2% for business hotels and 85.5–90.0% for city hotels — a picture of “rooms filling but rates not rising.” On Sundays, business hotels ran 84.9% against city hotels at 80.6%, so weekend dependence is stronger at city hotels.
- — Applying the quartiles of first-half year-on-year changes to the second half (August–December) puts business hotels at a five-month average of ¥6,901–¥7,140 (a ¥239 span) and city hotels at ¥9,434〜¥10,164 (a ¥730 span). With N around 11, city hotels need to hold budgets as a range.
Business hotels — +12.0% in January, then negative through early spring
Start with business hotels. The settled ADR estimate for January 2026 was ¥6,910, up 12.0% from ¥6,171 a year earlier (N=75 properties; 77 the prior year). The year opened clearly positive. February slowed to +2.6%, then March came in at ¥6,271 (−2.7%), April at ¥6,288 (−4.8%, N=78 properties; 80 the prior year) and May at ¥6,969 (−1.4%) — three spring months all below the prior year. June (+0.1%) and July (−0.2%) were roughly flat, leaving the January–July average at just +0.7%.
Judging this early-spring weakness against the prior year alone leads you astray. Compared with the same months of 2024, March was −7.6% and April −6.8% — well below the level of two years ago. In other words, the 2026 spring decline is not “payback for 2025 being too high”; the spring shoulder-season price band has stepped down over two years. Conversely, January (+3.9% vs 2024) and July (+6.0% vs 2024) came in above two years ago, so Yamagata’s business hotel market is not “weak all year round.” It is closer to the reality to read it as the gap between strong and weak months widening. The monthly range for January–July 2026 ran from ¥6,271 (March) to ¥6,969 (May), a spread of ¥698.
Source: MetroEngines Research, compiled by the HotelBank Editorial Team
Plotted as a year overlay, 2026 (solid line, dark) sits well above 2025 in January, then digs a trough in March–April that falls below both 2024 and 2025. It sits a further step below the same trough a year earlier (¥6,447 in March 2025), so the spring shoulder season has surfaced as this market’s weak point for a second consecutive year.
City hotels — +12.5% in February, but note the thin N=11 coverage
City hotels in the same prefecture grew precisely when business hotels sank. The settled ADR estimate for February 2026 was ¥9,345, up 12.5% from ¥8,303 a year earlier (N=11 properties; 11 the prior year). March came in at ¥8,287 (+8.5%) and April at ¥8,468 (+8.6%), both N=11 properties (12 the prior year). After returning to roughly flat in May (−0.4%) and June (+0.1%), July turned positive again at ¥8,949 (+5.6%). The January–July average was ¥8,608, up 5.1% year on year.
One caveat must always accompany these figures. The city hotel sample covers only N=10–12 properties, strikingly thin next to business hotels (N=71–81).A price revision, closure or reopening at one or two properties can move the prefecture average by several percent, so reading a single month’s change as “the intent of Yamagata’s entire city hotel market” is dangerous. In fact, November 2025 — a month with N=10 — produced an outlying ¥10,085, the thin sample surfacing as monthly volatility. Treat the figures below as “the average of a set of roughly 11 properties.”
Source: MetroEngines Research, compiled by the HotelBank Editorial Team
Viewed as a year overlay, the 2026 gains at city hotels are not a break to new highs but a rebound from the 2025 trough. March 2025 was −11.8% versus 2024 and April −12.5%, sharp declines; March and April 2026 recovered +8.5% and +8.6% from there, but still sit at −4.4% and −5.0% versus 2024. February 2026, by contrast, was clearly above 2024 at +11.8%, so only February and July have stepped up in level terms. Rather than “every month recovered,” the accurate framing is that recovered months and months still short of a full rebound coexist.
The month-by-month divergence, and what was happening on the supply side
Line the two segments’ year-on-year changes up on the same axis and the shape of the divergence stands out. In January, business hotels were +12.0% against city hotels at +1.4%; in February both were positive but city hotels far outpaced at +12.5%; in March–April the signs flipped, with business hotels negative and city hotels up in the +8% range; May–June were roughly flat for both; and in July business hotels were −0.2% while only city hotels rose, at +5.6%. Of the seven months, the signs themselves diverged in three — March, April and July — and even in months where the signs agreed, the spread ran around 10 points, as in January (+12.0% vs +1.4%) and February (+2.6% vs +12.5%). Segment-level splits in the sign of year-on-year change within a single prefecture are not unique to Yamagata; the same structure can be confirmed in Yamaguchi Settled ADR H1 2026: Business +3.4%, City Hotels −6.4% as well.
Source: MetroEngines Research, compiled by the HotelBank Editorial Team
| Stay month | Business 2025 | Business 2026 | YoY | N (26/25) | City 2025 | City 2026 | YoY | N (26/25) |
|---|---|---|---|---|---|---|---|---|
| January | ¥6,171 | ¥6,910 | +12.0% | 75/77 | ¥8,201 | ¥8,314 | +1.4% | 11/11 |
| February | ¥6,665 | ¥6,840 | +2.6% | 76/79 | ¥8,303 | ¥9,345 | +12.5% | 11/11 |
| March | ¥6,447 | ¥6,271 | −2.7% | 78/79 | ¥7,640 | ¥8,287 | +8.5% | 11/12 |
| April | ¥6,602 | ¥6,288 | −4.8% | 78/80 | ¥7,794 | ¥8,468 | +8.6% | 11/12 |
| May | ¥7,065 | ¥6,969 | −1.4% | 75/81 | ¥8,697 | ¥8,660 | −0.4% | 11/12 |
| June | ¥6,887 | ¥6,892 | +0.1% | 74/80 | ¥8,219 | ¥8,230 | +0.1% | 11/12 |
| July | ¥6,842 | ¥6,829 | −0.2% | 71/80 | ¥8,476 | ¥8,949 | +5.6% | 11/12 |
| Jan–Jul average | ¥6,668 | ¥6,714 | +0.7% | 71〜81 | ¥8,190 | ¥8,608 | +5.1% | 11〜12 |
Yamagata Prefecture / settled ADR estimate (tax-excluded equivalent), year-on-year comparison of finalized figures. Source: MetroEngines Research, compiled by the HotelBank Editorial Team
Supply-side moves also line up in time with the difference in signs over this period. New properties opening in Yamagata Prefecture under the business hotel classification numbered 4 with 152 rooms in total in 2025 and 2 with 104 rooms in 2026, and both 2026 openings came in March and April. The months when the settled ADR estimate for business hotels turned negative and the months when new rooms entered the market fall in the same quarter. In the city hotel classification, meanwhile, one property with 62 rooms was added in March 2025 — and within a thin sample of N=11–12, that overlaps the period when the −11.8% and −12.5% troughs formed in March–April 2025. This is not data that establishes causation, but it is fair to say that a pattern of “the prefecture average being pushed down in the period immediately after a new opening, then recovering the following year” appears in both segments, one year apart. How far new supply across northern Tohoku, Yamagata included, is being absorbed by the market is diagnosed alongside Aomori and Akita in North Tohoku’s 2,079 New Rooms: Which Segments Can Absorb the Supply.
The counts of new openings and rooms in this article are compiled on an OTA-listing-confirmed basis. Only a portion of properties are listed on OTAs ahead of opening, and in many cases the listing is confirmed after opening, so the most recent months and years (2026 in particular, still being compiled) may see counts and room numbers rise as further listings are confirmed. We recommend reading them alongside the building-plan pipeline on a confirmation-application basis (Ministry of Land, Infrastructure, Transport and Tourism, “Statistical Survey on Building Construction Dynamics”).
Source: MetroEngines Research (OTA-listing-confirmed basis)
Demand-side temperature — estimated OCC stays high in both segments, and the Sunday drop is larger at city hotels
Prices falling does not mean demand was thinning. Estimated OCC on an OTA-listed-inventory basis (April–July 2026, Yamagata Prefecture) held at high levels throughout: business hotels at 87.0% in April, 90.4% in May, 92.2% in June and 91.8% in July (43–57 properties covered), and city hotels at 85.5% in April, 88.1% in May, 89.9% in June and 90.0% in July (10–11 properties covered). April was the month business hotels ran −4.8% year on year on the settled ADR estimate, yet inventory sell-through itself was 87.0% — hardly low. It is not that rooms are cheap because demand is short; the price band at which rooms fill has come down — that reading fits these four months of data better.
Broken out by day of week, estimated OCC brings out the difference in character further. On Saturdays the two are nearly level, business at 94.4% and city at 94.8%, but on Sundays business runs 84.9% against city at 80.6%. The Saturday-to-Sunday drop is 9.5 points for business hotels and 14.2 points for city hotels, so city hotels lean harder on weekends. On weekdays, Thursday is highest at 92.2% for business and 91.1% for city, while Monday is lowest at 88.6% and 85.1%. How many days before the stay date demand within Yamagata is settled was examined — with days of week aligned — using booking curves in Yamagata Hanagasa 2026: Demand Settled 45 Days Out, +9.6pt vs Normal.
| Day | Business est. OCC | City est. OCC | Gap |
|---|---|---|---|
| Mon | 88.6% | 85.1% | 3.5pt |
| Tue | 91.3% | 89.2% | 2.1pt |
| Wed | 91.3% | 89.4% | 1.9pt |
| Thu | 92.2% | 91.1% | 1.1pt |
| Fri | 89.6% | 88.2% | 1.4pt |
| Sat | 94.4% | 94.8% | −0.4pt |
| Sun | 84.9% | 80.6% | 4.3pt |
Yamagata Prefecture; stay dates from April–July 2026 averaged by day of week (business hotels 43–57 properties / city hotels 10–11 properties). Source: MetroEngines Research, compiled by the HotelBank Editorial Team
For revenue managers running business and city hotels in Yamagata — implications and an action plan
1. Don’t set your property’s annual policy from “the prefecture’s market trend.”Within the same Yamagata Prefecture, the January–July 2026 year-on-year change was +0.7% for business hotels and +5.1% for city hotels — nearly five points apart — and on a monthly basis the signs themselves diverged in three months. When benchmarking your own results against the market, use the monthly series for your own segment as the yardstick, not the prefecture average. If you are a business hotel and “April came in below last year,” that may not be a property-specific miss but the same direction as the market’s −4.8%; conversely, if you are a city hotel and “February was flat year on year,” you may have left share on the table in a month when the market moved +12.5%.
2. The weakness is in “early spring,” not “all year round.”Business hotels show a seasonal shape of +12.0% in January and −0.2% in July (+6.0% versus 2024) against negative territory in March–May. Rather than a uniform annual pricing calendar, the thinking needs to be: capture reliably in the strong months (January, high summer) and rebuild the weak months (March–May) with levers other than price — pulling the selling window forward, designing multi-night and corporate allotments, reallocating weekday inventory. The ¥698 range between ¥6,271 in March and ¥6,969 in May shows that the price band tolerated by the season differs clearly, even for the same room type at the same property.
3. High estimated OCC can be a signal of headroom in pricing.Estimated OCC for April–July 2026 held high at 87.0–92.2% for business hotels and 85.5–90.0% for city hotels. April in particular saw business hotels at an estimated OCC of 87.0% (April 2026, 43–57 properties covered) — inventory moving — while ADR came in below the prior year, so price-side factors, rather than a demand shortfall, most likely did the work. If your property shows the same combination of high occupancy and low ADR in that month, consider revisiting your price floor ahead of next spring.
4. Translate the difference in weekend dependence into day-of-week inventory strategy.Saturdays are nearly level at 94.4% for business and 94.8% for city, but Sundays run 84.9% and 80.6%, a 4.3-point gap. The city segment’s 14.2-point Saturday-to-Sunday drop is large, making how you fill Sundays the swing factor for weekly RevPAR. For the business segment, Thursday at 92.2% is the in-week peak, only 3.6 points above Monday at 88.6%.
5. Read the city segment on the premise of a thin sample of around N=11.The prefecture’s city hotel average is made up of 10–12 properties, so a change of course at a single property moves the prefecture average by several percent. Rather than treating a single positive month as the market trend, judge on two to three months of continuity (in 2026, three consecutive positive months: +12.5% in February, +8.5% in March, +8.6% in April).
| Time frame | Action | Decision trigger (figures from this article) | Purpose |
|---|---|---|---|
| Today–this week | Lay out your property’s January–July ADR by month and overlay the market series for the same segment (business ¥6,271–¥6,969 / city ¥8,230–¥9,345) | If any month’s year-on-year change at your property diverges by 3 points or more from the market (business +0.7% / city +5.1%) | Separating market factors from property factors |
| Today–this week | Review day-of-week sell-through focused on Mondays and Sundays, and check price floors and minimum-stay settings | If your Sundays run clearly below market levels (business 84.9% / city 80.6%) | Lifting the in-week trough |
| Within two weeks | Pull out months with high occupancy and low ADR, and revisit settings at the upper end of price (higher-grade rooms and plans) | If your estimated OCC is in line with the market (87.0–92.2% for business, April–July) yet ADR is below the prior year | Recovering headroom for rate increases |
| Within two weeks | Rebuild the competitive set by segment, and for the city segment track individual properties as well, given the thin sample | If the N=10–12 premise for the city segment is not shared across the team | Preventing overreaction to single-month noise |
| Looking to next month | Draw next spring’s (March–May) pricing calendar in advance around the seasonal shape rather than a uniform annual rate | If your property also sank in the same direction as business hotels at −2.7% in March, −4.8% in April and −1.4% in May | Redesigning the shoulder season |
| Looking to next month | Identify in advance the quarters when new openings land, and consider pulling the start of selling forward for those periods | If rooms have been added in your area within the past year (the prefecture’s business classification saw 2 properties and 104 rooms in 2026) | Avoiding lost share during supply increases |
Source: MetroEngines Research, compiled by the HotelBank Editorial Team
Second-half landing range — three scenarios drawn from year-on-year quartiles, and a base-month × YoY sensitivity grid
Everything up to here concerns finalized January–July 2026. So where could the second half (August–December 2026) land? Here we avoid a single-point forecast and instead apply the dispersion of year-on-year changes actually observed in the first half directly to the second half to show a range. The procedure has three steps. (1) Line up the seven monthly year-on-year changes for January–July 2026 by segment and take the first quartile, median and third quartile. (2) Treat those as the pessimistic, mid and optimistic scenarios. (3) Apply each scenario rate to the finalized figures for August–December 2025 to convert them to second-half levels. Because the denominators are finalized figures against finalized figures, this reads on the same footing as the first-half discussion.
Note that the settled ADR estimates currently available for August 2026 onward are a forward snapshot based on present sell-through, not finalized results, and are calculated on a different basis from the finalized figures used for January–July in this article. Placing figures with different bases side by side biases the level structurally upward, so they are not used at all in the calculations in this section. What is used is only the finalized figures (August–December 2025) and the quartiles of year-on-year changes calculated between finalized figures.
| Scenario | YoY applied | August | September | October | November | December | 5-month average |
|---|---|---|---|---|---|---|---|
| Business hotels (base: August–December 2025 average ¥7,042) | |||||||
| Pessimistic (1st quartile) | −2.0% | ¥7,201 | ¥6,996 | ¥7,141 | ¥6,799 | ¥6,366 | ¥6,901 |
| Mid (median) | −0.2% | ¥7,333 | ¥7,125 | ¥7,272 | ¥6,924 | ¥6,483 | ¥7,028 |
| Optimistic (3rd quartile) | +1.4% | ¥7,451 | ¥7,239 | ¥7,389 | ¥7,035 | ¥6,587 | ¥7,140 |
| City hotels (base: August–December 2025 average ¥9,359) | |||||||
| Pessimistic (1st quartile) | +0.8% | ¥9,691 | ¥9,294 | ¥9,818 | ¥10,166 | ¥8,200 | ¥9,434 |
| Mid (median) | +5.6% | ¥10,152 | ¥9,736 | ¥10,285 | ¥10,650 | ¥8,591 | ¥9,883 |
| Optimistic (3rd quartile) | +8.6% | ¥10,441 | ¥10,013 | ¥10,578 | ¥10,952 | ¥8,835 | ¥10,164 |
Here is how to read it. For business hotels, the five-month averages across the three scenarios run ¥6,901–¥7,140 — a span of only ¥239. That is because first-half year-on-year changes, excluding January’s +12.0%, sat in a narrow band of −4.8% to +2.6%, so the higher-confidence scenario for the business segment in the second half is that it does not move much. City hotels, by contrast, run ¥9,434–¥10,164, a ¥730 span — 3.0 times as wide as business. The thin sample of around N=11 shows up directly as uncertainty, and the city segment’s budget has to be held as a range.
One more thing to watch is the step between November and December. The city hotel base falls ¥1,950, from ¥10,085 in November (N=10) to ¥8,135 in December (N=11). That step is preserved under both the pessimistic and the optimistic scenario, so holding the second half as a “five-month average” buries December’s weakness in the average. It is a metric to hold by month.
| YoY | August | September | October | November | December |
|---|---|---|---|---|---|
| −6% | ¥6,907 | ¥6,711 | ¥6,850 | ¥6,522 | ¥6,106 |
| −3% | ¥7,128 | ¥6,925 | ¥7,068 | ¥6,730 | ¥6,301 |
| −0.2% ← mid | ¥7,333 | ¥7,125 | ¥7,272 | ¥6,924 | ¥6,483 |
| +3% | ¥7,568 | ¥7,353 | ¥7,506 | ¥7,146 | ¥6,691 |
| +6% | ¥7,789 | ¥7,567 | ¥7,724 | ¥7,354 | ¥6,886 |
| YoY | August | September | October | November | December |
|---|---|---|---|---|---|
| −3% | ¥9,326 | ¥8,943 | ¥9,448 | ¥9,782 | ¥7,891 |
| 0% | ¥9,614 | ¥9,220 | ¥9,740 | ¥10,085 | ¥8,135 |
| +5.6% ← mid | ¥10,152 | ¥9,736 | ¥10,285 | ¥10,650 | ¥8,591 |
| +9% | ¥10,479 | ¥10,050 | ¥10,617 | ¥10,993 | ¥8,867 |
| +12% | ¥10,768 | ¥10,326 | ¥10,909 | ¥11,295 | ¥9,111 |
Using the grid is simple: it comes down to checking which cell of this table your second-half budget sits in. If, for example, you are projecting ¥7,500 for October in the business segment, that is the +3% row against the market base of ¥7,287 — a level never once reached in the first half (the first-half maximum was January’s +12.0%, but the other six months topped out at +2.6%). Conversely, ¥6,850 is the −6% row, a premise weaker still than the first half’s weakest month (April, −4.8%).The validity of a budget can be checked not by its absolute yen figure but by “where it sits in the distribution of year-on-year changes that actually occurred in the first half.”
Summary — three yardsticks for reading Yamagata
First, the market is invisible unless you split it by segment.In January–July 2026, Yamagata’s business hotels were +0.7% year on year and city hotels +5.1%. The monthly average gap between the segments widened from ¥1,522 to ¥1,893. A single blended prefecture average erases that ¥371 of widening.
Second, look at two years back, not only at the prior year.Business hotels were −2.7% and −4.8% year on year in March–April, but −7.6% and −6.8% versus 2024 — a steeper decline. Conversely, city hotels were +8.5% and +8.6% year on year in March–April yet still −4.4% and −5.0% versus 2024, short of a full rebound. Whether a one-year change is a “recovery” or a “continued drag” can only be told by lining up the level from two years earlier.
Third, do not confuse weak prices with weak demand.Estimated OCC ran from the high 85% range to the low 92% range in both segments from April to July 2026, so inventory was moving even in months when prices fell below the prior year. Months where rooms fill but rates do not rise are exactly the ones to target for design changes ahead of the same month next year.
About the data
■ Data sources
Settled ADR estimates and estimated OCC come from our own monthly area aggregation (MetroEngines Research) covering the business hotel and city hotel classifications within Yamagata Prefecture. The months covered run from January 2024 to July 2026, all finalized figures. Properties covered number 71–81 for business hotels and 10–12 for city hotels (varying by month). Estimated OCC by day of week averages stay dates from April–July 2026 by day of week. Counts of new openings and rooms are on an OTA-listing-confirmed basis, a different population from the building-plan pipeline.
■ Calculation assumptions
The three scenarios for the second half (August–December 2026) were calculated by applying the first quartile, median and third quartile of the seven monthly year-on-year changes for January–July 2026 (business −2.0% / −0.2% / +1.4%; city +0.8% / +5.6% / +8.6%) to the finalized figures for August–December 2025. Each cell of the sensitivity grids is likewise the finalized figure for the same month of 2025 × (1 + year-on-year change); no extrapolation model or seasonal adjustment is used. Forward snapshot values for August 2026 onward are calculated on a different basis from finalized figures and are therefore not used in this article’s calculations.
■ Limitations and caveats
(1) The city hotel sample is thin at N=10–12 properties, and a price revision, closure or reopening at one or two properties can move the prefecture average by several percent. A single month’s change should not be read as the trend of the whole market. (2) The settled ADR estimate is an estimate derived from sales data, with a median error of 6.6% against published operating results. The year-on-year changes treated here compare estimates produced by the same method, and should be read separately from the absolute accuracy of the levels themselves. (3) Estimated OCC is an OTA-listed-inventory-based metric and runs higher than actual room occupancy. (4) The three scenarios and the sensitivity grids are not forecasts; they present the range implied by applying the variation observed in the first half to the second half, and do not incorporate discontinuous changes in the demand environment (major events, disasters, abrupt supply shifts).
· Definition of estimated OCC: OTA-listed-inventory-based occupancy = 100 − 100 × rooms remaining on OTA listings ÷ total rooms. It is an estimate based on the sell-through of inventory offered on OTAs and is defined differently from actual room occupancy (it runs higher). This article aggregates stay dates in Yamagata Prefecture from April to July 2026.
· Booking curve: based on observations from 90 days before the stay date up to the present.
· Definition of the settled ADR estimate: the transaction price level (tax-excluded equivalent) estimated from OTA and other sales data (cheapest-plan level × segment coefficient, ensembled across multiple channels). Past months are finalized figures; the current and future months are estimates based on present sell-through. Median error of 6.6% against published operating results. All months treated in this article, January 2024 to July 2026, are finalized figures, and the year-on-year changes compare finalized figures with finalized figures.
· Breakdown of properties covered (N): for business hotels, N=71–78 properties in January–July 2026, N=77–81 in the same period of 2025 and N=75–77 in the same period of 2024. For city hotels, N=11 properties in January–July 2026, N=11–12 in the same period of 2025 and N=11–12 in the same period of 2024. Estimated OCC covers 43–57 business hotels and 10–11 city hotels. City hotel coverage is thin, and the variation of a small number of properties is strongly reflected in the prefecture average.
· Room counts for new openings aggregate properties in the business hotel and city hotel classifications confirmed to have opened in Yamagata Prefecture in the relevant year.
· Data as of August 24, 2026. Sell-through and inventory change daily, so the figures in this article are a snapshot at the time of retrieval.
Related reading
- Yamagata Hanagasa 2026: Demand Settled 45 Days Out, +9.6pt vs Normal
- North Tohoku’s 2,079 New Rooms: Which Segments Can Absorb the Supply
- Yamaguchi Settled ADR H1 2026: Business +3.4%, City Hotels −6.4%
- Fukushima Settled ADR: Ryokan +4.5%, Resort +4.7%, but −6.9% vs 2024
- Hokkaido Business Hotels Aren’t Weekend-Led: Thu 95.4% Ties Sat 95.4%
- Kanagawa ADR Splits: City Hotels +20.9%, Business −1.7% in June 2026
- Aichi Settled ADR 18 Months: City Swings 25.0pt, Business 14.0pt