

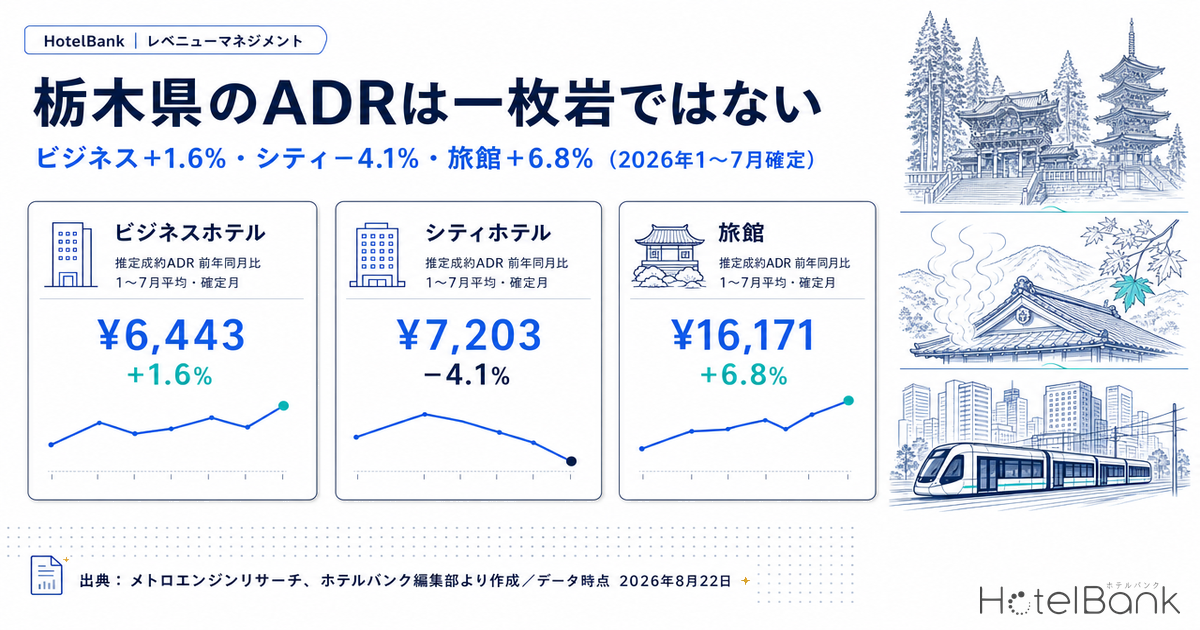
The lodging market in Tochigi Prefecture is not one market right now. Stack up the year-on-year change in the settled ADR estimate across the settled months of January–July 2026 and business hotels average ¥6,443 over the seven months (¥6,344 in the same period of 2025, +1.6%, N=137–140 properties) — positive, if modestly. City hotels land on the other side at ¥7,203 (against ¥7,513, −4.1%, N=15 properties). Stronger still is the ryokan category, which carries much of the inventory in tourist areas such as Nikko and Kinugawa, at ¥16,171 (against ¥15,137, +6.8%, N=201–214 properties). Within a single prefecture, rates are moving in opposite directions depending on the accommodation type. This article sorts that divergence out on settled figures, connects it to booking pace for September and October (estimated occupancy) and day-of-week patterns, and turns it into decisions on rate fences, day-of-week mix and lead-time allocation.
Scope: business hotels (N=137–140 properties) and city hotels (N=15 properties) in Tochigi Prefecture, with ryokan (N=201–214 properties) and resort hotels (N=38–45 properties) as reference comparisons. The price metric in this article is the settled ADR estimate (the transaction price level estimated from OTA and other sales data, roughly tax-exclusive); occupancy is an estimate on an OTA-listed-inventory basis. Definitions for both appear at the end of the article. Data as of August 22, 2026.
- — Business hotels +1.6% — the settled-month average for January–July 2026 was ¥6,443 (¥6,344 in the same period of 2025, N=137–140 properties). Six of the seven months were positive, the largest being +4.2% in May.
- — City hotels −4.1% — ¥7,203 (against ¥7,513, N=15 properties). The drop is steepest in the two most recent months, −8.5% in June and −11.7% in July. The sample is thin enough that this is a read on direction only.
- — Ryokan +6.8% / resort hotels −3.1% — even within the same prefecture, two categories that both serve tourist demand carry opposite signs. Round the prefecture down to a single average and four separate movements disappear.
- — The rate gap has narrowed to ¥760 — the January–July average spread between city and business hotels fell from ¥1,169 a year earlier to ¥760. That makes it worth re-checking whether the steps in your rate fence still match the market.
- — H2 spreads to ¥6,649–¥6,981 — a five-month average calculated by applying the year-on-year range observed in H1 (−0.7% to +4.2%) to the settled August–December 2025 figures for business hotels.
Year-on-Year in the Settled Months — Business Up, City Down
First, set the ground rules. Everything compared here is the settled ADR estimate on a settled (history) basis against another settled figure. Months from August 2026 onward are estimates based on current sales conditions and sit on a different basis, so they are excluded from the year-on-year comparison. That leaves seven months — January through July 2026 — where the year-on-year read holds.
Business hotels were positive in six of those seven months. The largest was May 2026 at ¥7,038 (N=140 properties), or +4.2% against ¥6,754 in the same month a year earlier (N=134 properties). Next came June at ¥6,319 (N=137 properties), +2.8% against ¥6,149 a year earlier (N=134 properties), then July at ¥6,342 (N=138 properties), +1.5% against ¥6,246 (N=136 properties). The only negative month was April at −0.7%, and the margin was small. The level itself stayed inside a ¥6,249–¥7,038 range through the year — less a case of rates spiking than of the floor being lifted.
City hotels are the mirror image. Four of the seven months were negative: June at ¥7,053 (N=15 properties) was −8.5% against ¥7,704 a year earlier (N=14 properties), and July at ¥6,786 (N=15 properties) was −11.7% against ¥7,688 (N=14 properties) — the two most recent months carrying the steepest declines. January, by contrast, was ¥7,508 (N=15 properties), +3.4% against ¥7,264 (N=14 properties), and May was ¥8,097 (N=15 properties), +3.3% against ¥7,842 (N=14 properties). The sign flips from month to month, and that is the defining feature of this category. Note, though, that city hotels here cover N=15 properties — a sample small enough that a change of sales policy, a renovation or a closure at one or two properties will move the median. Read what follows as a tendency, not a conclusion.
| Settled month | Business (N) | YoY | City (N) | YoY | Ryokan YoY (N) | Resort YoY (N) |
|---|---|---|---|---|---|---|
| January 2026 | ¥6,249 (137) | +1.6% | ¥7,508 (15) | +3.4% | +21.8% (201) | −6.6% (38) |
| February 2026 | ¥6,270 (139) | +0.5% | ¥6,671 (15) | −7.0% | +12.8% (210) | −18.0% (39) |
| March 2026 | ¥6,466 (140) | +0.9% | ¥7,104 (15) | +0.3% | +7.2% (214) | +3.4% (42) |
| April 2026 | ¥6,416 (140) | −0.7% | ¥7,205 (15) | −8.1% | +6.7% (212) | −4.3% (44) |
| May 2026 | ¥7,038 (140) | +4.2% | ¥8,097 (15) | +3.3% | +8.5% (214) | +6.2% (45) |
| June 2026 | ¥6,319 (137) | +2.8% | ¥7,053 (15) | −8.5% | −2.3% (209) | +0.8% (45) |
| July 2026 | ¥6,342 (138) | +1.5% | ¥6,786 (15) | −11.7% | −6.7% (206) | −3.2% (44) |
| Jan–Jul average | ¥6,443 | +1.6% | ¥7,203 | −4.1% | +6.8% | −3.1% |
Source: MetroEngines Research and the HotelBank Editorial Team (settled ADR estimate, year-on-year between settled figures)
The ryokan category’s +21.8% in January and +12.8% in February show that rates on the inventory serving tourist demand were lifted sharply. That said, the number of ryokan covered moved between 201 and 220 properties year on year, so turnover in the sample may be influencing the median. Resort hotels ran −3.1% on the January–July average (N=38–45 properties), the opposite direction from ryokan — a reminder that “tourist area equals strong” does not hold as a simple rule. Business and city hotels splitting signs inside one prefecture is not unique to Tochigi either: Yamaguchi’s settled ADR estimate, where H1 2026 ran business +3.4% and city −6.4%, tracks the same shape of divergence on settled months.
Different Seasonal Shapes — the Months With Pricing Headroom Differ by Category
Stack the years on top of each other and the difference in seasonal shape between the two categories becomes clear. Business hotels peak in May and August and again in October–November, a pattern common to all three years, and 2026 duly hit its highest settled month in May at ¥7,038 (N=140 properties). The troughs are January, June and December: January 2026 came in at ¥6,249 (N=137 properties) and June at ¥6,319 (N=137 properties). The gap between peak and trough is roughly ¥790, a range of about 13%.
Source: MetroEngines Research and the HotelBank Editorial Team (Tochigi business hotels, settled ADR estimate, settled months only)
City hotels place their peaks slightly differently. In 2026 the high was May (¥8,097, N=15 properties), while 2024 and 2025 also carried clear peaks in August (¥8,402 with N=13 properties and ¥8,798 with N=14 properties respectively) and November (¥8,636 with N=14 properties and ¥8,791 with N=14 properties). Across the settled months of 2026 the category sank to ¥6,671 in February (N=15 properties) and sat at ¥6,786 in July (N=15 properties) — the usual summer lift does not appear in the settled figures. What the shape shows is that city hotels in 2026 have narrowed their rate gap against business hotels. On the January–July average the spread is ¥760 (¥7,203 against ¥6,443), down from ¥1,169 (¥7,513 against ¥6,344) in the same period a year earlier.
Source: MetroEngines Research and the HotelBank Editorial Team (Tochigi city hotels, settled ADR estimate, settled months only. N=13–15 properties)
Day-of-Week Patterns — Business Leans to Wednesday and Thursday, City to Saturday
Move from rate to the shape of demand. Average the estimated occupancy by day of week (OTA-listed-inventory basis) for the July 2026 actuals and business hotels (around 116 properties covered) run 86.6% for the month, with Wednesday at 89.4% and Tuesday at 88.7% on the high side and Sunday at 80.1% and Monday at 84.2% on the low side. Midweek is strongest, the start of the week and Sunday weakest — the shape you get when business travel is the base of demand. Saturday is high at 90.3% but not far clear of the midweek days.
City hotels (14 properties covered) take a different shape. Against a monthly average of 84.2%, Saturday stands out at 93.5%, followed by Wednesday at 85.2% and Tuesday at 84.4%. Monday at 79.5% and Sunday at 79.2% form the trough. The single-point concentration on Saturday is the city-side signature: on July Saturdays the share of properties with no listed inventory visible averaged 32.7%, above the 28.2% on the business side. June follows the same pattern — city hotels leaned to the weekend at 92.2% on Friday and 90.4% on Saturday, while business hotels leaned midweek at 90.2% on Thursday and 89.5% on Saturday. For more on how the day-of-week trough lands on different days for different categories, neighbouring Gunma’s day-of-week occupancy (July 2026 actuals) breaks down the same month in detail.
| Day | Business est. OCC (June 2026) | Business est. OCC (July 2026) | City est. OCC (June 2026) | City est. OCC (July 2026) |
|---|---|---|---|---|
| Mon | 80.6% | 84.2% | 77.8% | 79.5% |
| Tue | 87.1% | 88.7% | 85.5% | 84.4% |
| Wed | 88.8% | 89.4% | 87.3% | 85.2% |
| Thu | 90.2% | 87.8% | 88.5% | 84.0% |
| Fri | 88.9% | 84.9% | 92.2% | 83.5% |
| Sat | 89.5% | 90.3% | 90.4% | 93.5% |
| Sun | 76.5% | 80.1% | 73.4% | 79.2% |
| Monthly average | 85.8% | 86.6% | 84.8% | 84.2% |
Source: MetroEngines Research and the HotelBank Editorial Team (estimated occupancy, OTA-listed-inventory basis. Business = around 116 properties covered, city = 14 properties covered)
Booking Pace for September and October — Long Weekends and the First October Weekend Start From a Different Place
Next, the stay dates still ahead. Line up Tochigi’s business hotels (117 properties, 10,249 rooms covered) on a booking curve built from observations running from 45 days before the stay date to the latest reading, and weekdays and long weekends start from genuinely different points. Wednesday September 9 goes 62.7% at T-45 to 65.7% at T-30 to 70.6% at the latest reading (T-19), a pickup of +7.9pt from T-45. Saturday September 12 runs 67.4% to 70.8% to 73.5% (T-22), or +6.1pt. Against that, Saturday September 19 — inside the three-day weekend that includes Respect for the Aged Day — is already at 73.0% at T-45, then 78.9% at T-30 and 79.5% at the latest reading (T-29), starting roughly 10pt above the weekday. Sunday September 20, the middle day of the long weekend, goes 74.2% at T-45 to 80.9% at T-30, with the share of properties showing no listed inventory reaching 36.8%. Tochigi’s booking curves by property category for August–September 2026, which lines up stay dates in the same prefecture from a lead time of 45 days, examines the relationship whereby the categories that sit highest at T-45 have the least room left to grow late — worth reading alongside the weekday-versus-long-weekend gap here.
Source: MetroEngines Research and the HotelBank Editorial Team (Tochigi business hotels, estimated occupancy. Based on observations from 45 days before the stay date to the latest reading)
The other thing that stands out is the first weekend of October. Friday October 2 is observed at 82.7% at T-45 and Saturday October 3 at 89.5% — well above every day observed in September (62.7–74.2%). City hotels (14 properties, 1,487 rooms covered) are high too, at 91.9% on October 2 and 95.3% on October 3. Yet Sunday October 4 sits at 69.0% and Monday October 5 at 65.6% (both business), back to normal levels once the week turns over. The current picture is that the days where demand concentrates in this prefecture cluster on particular weekends rather than spreading evenly through the month. For the record, fireworks events have been announced within the prefecture over the same period, in Nikko and Kinugawa Onsen on Saturday October 3 and Saturday October 10 (Nikko Travel Navi). The data in this article does not identify the causes of demand, but this is a cross-section worth checking against the calendar.
| Stay date | Business T-45 | Business latest | City T-45 | City latest |
|---|---|---|---|---|
| Wed Sep 9 | 62.7% | 70.6% (T-19) | 61.7% | 69.0% (T-19) |
| Sat Sep 12 | 67.4% | 73.5% (T-22) | 64.6% | 72.2% (T-22) |
| Wed Sep 16 | 63.8% | 68.0% (T-26) | 64.7% | 71.7% (T-26) |
| Sat Sep 19 | 73.0% | 79.5% (T-29) | 70.5% | 80.6% (T-29) |
| Sun Sep 20 | 74.2% | 80.9% (T-30) | 72.1% | 82.4% (T-30) |
| Sat Sep 26 | 66.2% | 67.6% (T-36) | 67.5% | 71.4% (T-36) |
| Fri Oct 2 | 82.7% | 83.6% (T-42) | 91.9% | 88.8% (T-42) |
| Sat Oct 3 | 89.5% | 90.1% (T-43) | 95.3% | 92.3% (T-43) |
| Mon Oct 5 | 65.6% | 65.6% (T-45) | 74.8% | 74.8% (T-45) |
Source: MetroEngines Research and the HotelBank Editorial Team (estimated occupancy, OTA-listed-inventory basis. Based on observations from 45 days before the stay date to the latest reading. Data as of August 22, 2026)
For Revenue Managers Running Business and City Hotels in Tochigi — Implications and an Action Plan
1. Do not judge your property against “the prefecture average.” Within the same Tochigi Prefecture, the January–July average year-on-year runs business +1.6% (N=137–140 properties), city −4.1% (N=15 properties) and ryokan +6.8% (N=201–214 properties) — the signs diverge. When you hold your own year-on-year up against the market, first decide which category of demand your property mainly serves (business travel, or a receiver of tourist demand) and choose the comparison from there. As long as business demand in Utsunomiya and tourist demand in Nikko and Kinugawa are moving separately inside one prefecture, a single prefecture-wide average is unlikely to be a usable yardstick for any one property.
2. Pricing headroom sits in the floor of the trough months, not in the peaks. Business hotels’ settled months in 2026 fall in a ¥6,249–¥7,038 range, and the improvement showed up as the trough being lifted. Rather than reading May’s +4.2% and setting an aggressive full-year position, check whether the floor rate in the months corresponding to January, June and December has moved from last year — that gives a more practical read on where the headroom is.
3. The narrowing gap between categories matters for rate-fence design. The January–July average spread between city and business hotels is ¥760, down from ¥1,169 in the same period a year earlier. If your upper-grade rooms and plans are drifting into the price band of the tier below, there is room to re-check whether the steps in your fence — room type, meals included or not, cancellation terms — still line up with the market.
4. Treat day-of-week peaks and calendar-date peaks as separate things. In the July day-of-week data, business hotels ran 89.4% on Wednesday against 80.1% on Sunday and city hotels 93.5% on Saturday against 79.2% on Sunday — the ordinary-week shape differs by category. Separately, on dates such as the September 19–20 long weekend or October 2–3, the curve’s starting point shifts by more than 10pt on the date rather than the day of week. Design day-of-week mix for ordinary weeks and date-level inventory and rate settings for long weekends and event weeks, and keep the two apart.
| Time horizon | Action | Decision trigger (figures from this article) | Objective |
|---|---|---|---|
| Today–this week | Audit inventory and rates for Fri Oct 2 and Sat Oct 3 first | Market estimated occupancy at T-45 (business, 117 properties covered) is 89.5% for Sat Oct 3 — more than 20pt above the September Saturdays (67.4% on the 12th, 66.2% on the 26th) — and 82.7% for Fri Oct 2, the day before | Close out any low rates still open on the dates where demand is concentrating |
| Today–this week | Manage remaining inventory for the September 19–21 long weekend on a separate table from an ordinary-week Saturday | The first day of the long weekend starts at 73.0% at T-45, above the 67.4% of Sat Sep 12 | Avoid leaving revenue on the table by reusing ordinary-week Saturday settings for the long weekend |
| Within two weeks | Check your own day-of-week mix against the shape of the market | In July the market ran 89.4% Wednesday and 80.1% Sunday for business hotels, 93.5% Saturday and 79.5% Monday for city hotels. If your trough falls on a different day from the market, isolate why | Bring day-of-week pricing and inventory allocation closer to the shape of market demand |
| Within two weeks | Branch lead-time allocation rules between weekdays and long weekends | A weekday (Sep 9) adds +7.9pt from T-45 to the latest observation, whereas the first day of the long weekend (Sep 19) fills +5.9pt ahead of the curve between T-45 and T-30 | Avoid releasing too much cheap early inventory on dates that fill quickly up front |
| Looking to next month | Reset floor rates for the trough months (the months corresponding to January, June and December) | If your settings for those months still sit below the market settled ADR estimate (the business trough band of ¥6,249–¥6,319, N=137 properties), consider revising them | Lift the bottom of the range and raise the full-year average rate |
| Looking to next month | Re-examine the fence width on upper room grades and meal-inclusive plans | The city-versus-business rate gap averages ¥760 for January–July, down from ¥1,169 in the same period a year earlier | Align price steps between grades with the market and keep upper-grade inventory from being diluted |
Source: MetroEngines Research and the HotelBank Editorial Team
How Might H2 Move — Three Scenarios and a Year-on-Year × Base-Month Sensitivity Grid
Everything up to here has been settled actuals. To close, apply the year-on-year range actually observed in H1 to the settled August–December 2025 figures and place, arithmetically, where the H2 level might land. To be clear up front, this is not a forecasting model — it is an application of an already-observed range.
| Scenario | Year-on-year applied | Business Aug–Dec average | City Aug–Dec average |
|---|---|---|---|
| Pessimistic | Business −0.7% / City −11.7% (observed floor for each category) | ¥6,649 | ¥7,174 |
| Base | Business +1.6% / City −4.1% (Jan–Jul average) | ¥6,806 | ¥7,798 |
| Optimistic | Business +4.2% / City +3.4% (observed ceiling for each category) | ¥6,981 | ¥8,400 |
Source: MetroEngines Research and the HotelBank Editorial Team (an arithmetic calculation applying the range observed in January–July 2026 to the settled August–December 2025 figures. Not a forecast)
For business hotels, the spread between pessimistic and optimistic is only ¥332, about 5%. That follows from the H1 year-on-year sitting inside a narrow −0.7% to +4.2% band, and it makes a large miss in H2 structurally unlikely. City hotels, by contrast, open up to ¥7,174–¥8,400, a spread of ¥1,226 or about 17%. The thinness of an N=15 sample comes straight through as swing, and setting a single point estimate as a plan figure would be risky. On the city side the practical approach is to carry a range and re-apply it each time a month settles.
Break it down one level further and look at sensitivity by base month. The grid below covers business hotels, with the year-on-year applied on the vertical axis and the 2025 base month on the horizontal.
| YoY applied \ base month | August | September | October | November | December | 5-month average |
|---|---|---|---|---|---|---|
| −2.0% | ¥6,623 | ¥6,441 | ¥6,746 | ¥6,805 | ¥6,210 | ¥6,565 |
| ±0.0% | ¥6,758 | ¥6,572 | ¥6,884 | ¥6,944 | ¥6,337 | ¥6,699 |
| +1.6% (base) | ¥6,866 | ¥6,677 | ¥6,994 | ¥7,055 | ¥6,438 | ¥6,806 |
| +2.8% | ¥6,947 | ¥6,756 | ¥7,077 | ¥7,138 | ¥6,514 | ¥6,887 |
| +4.2% (ceiling) | ¥7,042 | ¥6,848 | ¥7,173 | ¥7,236 | ¥6,603 | ¥6,980 |
Source: MetroEngines Research and the HotelBank Editorial Team (an arithmetic calculation multiplying each year-on-year rate by the settled August–December 2025 figures of ¥6,758 / ¥6,572 / ¥6,884 / ¥6,944 / ¥6,337. N=135–137 properties)
What the grid shows is that applying the same year-on-year rate produces absolute levels more than ¥600 apart depending on the month. November has a high base at ¥6,944, so even −2.0% lands at ¥6,805. December, with a low base of ¥6,337, reaches only ¥6,603 even at +4.2%. Put another way, hitting a positive year-on-year in December still leaves you below November’s pessimistic case in absolute terms. Year-on-year and the rate you can actually achieve are two separate yardsticks, and when setting a monthly budget it is better not to judge on the former alone.
Note that this grid is arithmetic based on settled 2025 figures throughout and does not reflect sales conditions from August 2026 onward. As noted earlier, months from August 2026 sit on a different basis (estimates based on current sales conditions), so the analysis is kept within the range where a settled-to-settled comparison holds.
Summary — Three Yardsticks You Can Use in Tochigi
Yardstick 1: choose your comparison by category. On the settled-month average for January–July 2026: business +1.6%, city −4.1%, ryokan +6.8%, resort −3.1%. Benchmark against the year-on-year of the category closest to your own source of demand, not against the prefecture average.
Yardstick 2: watch the bottom of the range. Business hotels’ settled months fall in a ¥6,249–¥7,038 range, and the positive year-on-year showed up as the trough months being lifted. Whether the floor in the trough months has moved is closer to the real picture of rate improvement than the highest figure in the peak month.
Yardstick 3: separate the day-of-week peak from the calendar peak. The ordinary-week peak differs by category (Wednesday for business, Saturday for city), while long weekends and particular weekends start roughly 10pt higher at T-45 independently of that. Hold the calendar in two layers — ordinary weeks, and long-weekend or event weeks — and prepare rate fences and inventory allocation separately for each.
City hotels are a thin sample at N=15 properties, and a change in mix at a single property can move the median. Treat the direction of the numbers as a reference and judge against your own data.
About the Data
- Definition of estimated occupancy: OTA-listed-inventory-based occupancy = 100 − 100 × rooms remaining on OTA listings ÷ total rooms. It is an estimate based on how far the inventory offered for sale on OTAs has been absorbed, and is defined differently from actual room occupancy (it reads high). This article covers the June and July 2026 actuals plus stay dates from September 9 to October 5, 2026.
- Booking curve: based on observations from 45 days before the stay date to the latest reading.
- Definition of the settled ADR estimate: the transaction price level (roughly tax-exclusive) estimated from OTA and other sales data (the cheapest-plan level × a coefficient by property category, ensembled across multiple channels). Past months are settled figures; the current and future months are estimates based on current sales conditions. Cross-checked against published operating results, the median error is 6.6%. The year-on-year comparisons in this article cover only January–July 2025 and January–July 2026, both of which are settled.
- Breakdown of N: business hotels N=137–140 properties (settled months of 2026) / 133–136 properties (same months of 2025); city hotels N=15 properties (2026) / 14 properties (2025); ryokan N=201–214 properties (2026) / 205–220 properties (2025); resort hotels N=38–45 properties (2026) / 37–41 properties (2025). Estimated occupancy covers around 116 business properties with 10,249 rooms and 14 city properties with 1,487 rooms.
- Data as of August 22, 2026. Sales conditions and inventory change daily, so the figures in this article are a snapshot at the time of retrieval.
■ Data sources
The settled ADR estimate was retrieved as monthly aggregates by property category (business hotels, city hotels, ryokan, resort hotels) for Tochigi Prefecture from December 2024 to August 2026, and only months on a settled basis in both years were used for the year-on-year comparison. Estimated occupancy covers daily actual observations in the same prefecture (June and July 2026) plus observations from 45 days out for stay dates from September 9 to October 5, 2026. All figures are aggregated data from MetroEngines Research & Consulting. Event dates are from information published by Nikko Travel Navi (Nikko City Tourism Association) and the official Utsunomiya City website.
■ Calculation assumptions
The three H2 scenarios and the sensitivity grid are an arithmetic calculation applying the year-on-year rates actually observed in January–July 2026 to the settled August–December 2025 figures (¥6,758 / ¥6,572 / ¥6,884 / ¥6,944 / ¥6,337). The pessimistic and optimistic cases use the floor and ceiling of each category’s observed range (business −0.7% to +4.2%, city −11.7% to +3.4%), and the base case uses the January–July average (business +1.6%, city −4.1%). No new demand forecasting model or external assumption has been introduced.
■ Limitations and caveats
City hotels (N=15 properties) and resort hotels (N=38–45 properties) are thin samples, and a double-digit move in a single month can arise from a change in sales policy, a renovation or a closure at one or two properties. The number of ryokan covered also varied between 205 and 220 properties year on year, so turnover in the sample is included in the change in the average. Estimated occupancy is an estimate based on absorption of OTA-listed inventory, is defined differently from actual room occupancy and reads high. The H2 calculation is an application of an observed range rather than a forecast, and the actual level may fall outside that band. This article presents a cross-section of price and demand; it does not identify the causes of any movement in demand.
References and Sources
- Hyakka Ryoran Hanabi — Kinugawa Enka | Nikko Travel Navi (Nikko City Tourism Association) — held Saturday October 3 and Saturday October 10, 2026
- Event listings | Nikko Travel Navi (Nikko City Tourism Association)
- October event information | Official Utsunomiya City website
Related Reading
- Tochigi Booking Curves by Type: Resort 81.1% at T-45, Only +2.6pt Left
- Utsunomiya 300-Room Hotel Plan: LRT, Business Demand & +5% Supply
- Yamaguchi Settled ADR H1 2026: Business +3.4%, City Hotels −6.4%
- Kanagawa ADR Splits: City Hotels +20.9%, Business −1.7% in June 2026
- Hokkaido ADR H1 2026: City −5.7%, Business +4.1%, April the Turn
- Gunma Day-of-Week OCC: Ryokan Trough Wed 78.9%, Business Sun 81.3%
- Ibaraki Sep Booking Curves: Peak Sep 19-21 at 74.9%, Sep 23 55.7%
- Booking Curves Across 47 Prefectures: +4.1pt Median Pickup from T-45