

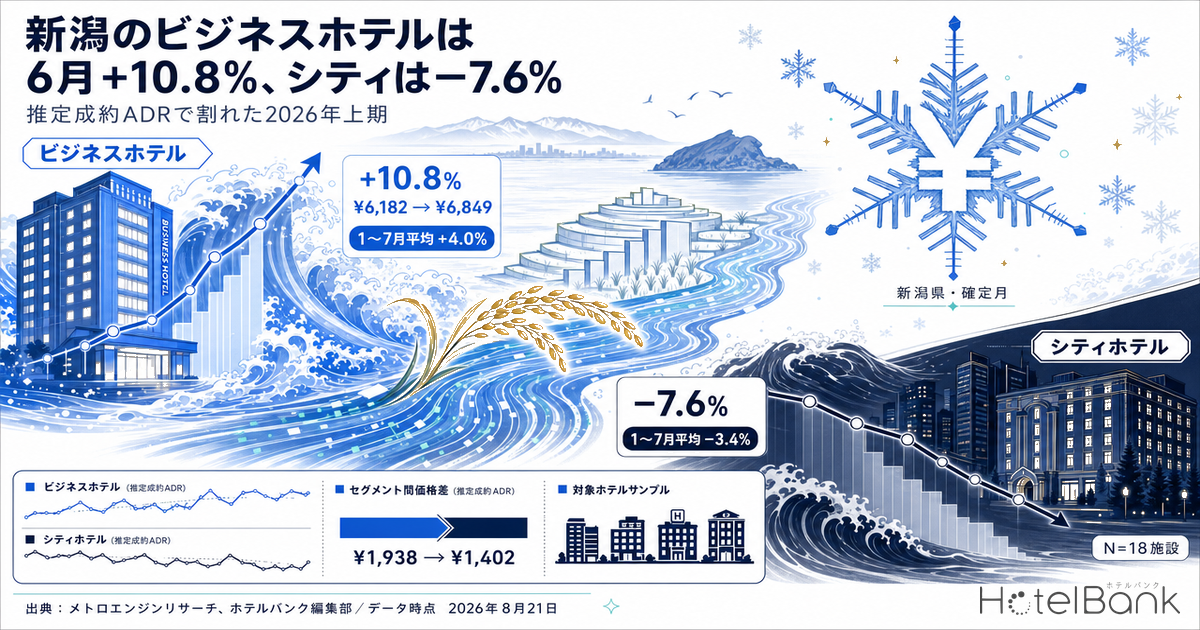
Room rates in Niigata Prefecture split cleanly by hotel category in the first half of 2026. Comparing January–July settled ADR (tax-excluded equivalent) — now that all seven months are settled — against the same months a year earlier, business hotels were up in six of the seven months (January–July average ¥6,384 → ¥6,636, +4.0%), while city hotels were down in six of the seven (¥8,322 → ¥8,038, −3.4%). June is the sharpest split: business hotels climbed ¥6,182 → ¥6,849 (+10.8%, N=128/125) in the very month city hotels fell below the prior year at ¥8,327 → ¥7,694 (−7.6%, N=18/18). Occupancy runs at roughly 90% for both categories, so the divergence sits entirely on the price side. This article compares settled (past) months only; months still carried as current-point estimates rest on a different basis and are excluded.
About the data in this article — Coverage: business hotels in Niigata Prefecture (N=124–135 properties) and city hotels (N=18 properties). The price metric used throughout is settled ADR (an estimated transacted rate level derived from online distribution data, tax-excluded equivalent); occupancy is an estimate based on published online inventory. Definitions for both appear at the end of the article. Data as of August 21, 2026.
- — Business hotels were up in six of the seven settled months — settled ADR for January–July 2026 averaged ¥6,636, against ¥6,384 a year earlier (+4.0%). N=124–133 properties.
- — City hotels fell below the prior year in six of those same seven months — averaging ¥8,038 against ¥8,322 (−3.4%). The sample is small, though: N=18 properties in every month of both years.
- — June’s +10.8% reflects rates not being cut, rather than rates being pushed up — against a June 2025 trough of ¥6,182, June 2026 came in at ¥6,849. Read it as a shallower trough, not a peak.
- — The gap between the two categories narrowed from ¥1,938 to ¥1,402 — closing to ¥845 (a ratio of 1.12x) in June. One step of the price ladder is close to collapsing.
- — Occupancy is level at roughly 90% for both categories — estimated OCC in June 2026 was 90.1% for business hotels and 88.7% for city hotels; in July, 89.1% and 89.3%. Only the price side has diverged.
Business hotels rose in six of seven settled months, with June at +10.8%
Start with business hotels in Niigata, settled months only. January 2026 came in at ¥6,247 (¥5,958 a year earlier, +4.9%), February ¥6,384 (+4.7%), March ¥6,498 (+4.0%), April ¥6,554 (+1.9%) and May ¥7,180 (+3.2%) — five consecutive months in positive territory, if by modest margins. The sample runs N=125–133 properties per month, close to the prior year’s N=128–135.
June’s +10.8% (¥6,182 → ¥6,849) is the figure that catches the eye, but it says as much about the low base it is measured against as about June 2026 itself. Overlaying the two years, 2025 dropped visibly from ¥6,954 in May to ¥6,182 in June — a clear mid-year trough — whereas 2026 ran ¥7,180 in May and ¥6,849 in June, a much shallower dip. In other words, this is less a case of a higher rate clearing in June than of a month that would normally see rates eased not requiring that easing.
July, by contrast, came in at ¥6,740 against ¥6,818 a year earlier — −1.1%, breaking the positive run in its seventh month. The decline itself is slight, but the sign flipped after gains of +1.9% to +10.8% through January–June, and that is not a change to ignore when building second-half pricing.
Source: MetroEngines Research; compiled by the HotelBank Editorial Team
City hotels fell short of last year in six months — on a small N=18 sample
One caveat first. For city hotels in Niigata, only N=18 properties per month carry enough data to compute settled ADR. Because the count holds at 18 in every month of both 2025 and 2026, apparent swings caused by the sample turning over are unlikely — but if one or two of those 18 properties change their pricing, the whole level moves. Read the figures below with that small-sample caveat in mind.
That said, the direction is unambiguous. January 2026 ¥7,496 (−0.8%), February ¥7,472 (−3.1%), April ¥8,444 (−10.0%), May ¥8,686 (−3.3%), June ¥7,694 (−7.6%) and July ¥7,993 (−5.3%) — six of the seven settled months below the prior year. The single gain was March, at ¥7,844 → ¥8,478 (+8.1%).
The steepest fall was April’s −10.0%, and here too the prior-year base was high: April 2025 stood at ¥9,387, the third-highest month of that year behind August (¥11,759) and October (¥9,707). The double-digit decline is the result of not reaching that level, and cannot be read as demand collapsing. What a single month’s base effect does not explain, however, is that January, February, May, June and July — months that were not running high — all came in below the prior year as well.
Source: MetroEngines Research; compiled by the HotelBank Editorial Team
The gap between the categories narrowed from ¥1,938 to ¥1,402 on average
What makes this split matter for day-to-day revenue management is that the distance between the two has shrunk. On a January–July average basis, the spread in settled ADR between city and business hotels (city minus business) narrowed by roughly ¥536, from ¥1,938 in 2025 to ¥1,402 in 2026. By month, the narrowest spread was June, down from ¥2,145 to ¥845. As a ratio, city hotels moved from 1.35x business hotels in June 2025 to 1.12x in June 2026.
The upper category giving up rate while the lower category gained means one step of the price ladder is close to collapsing. When the tier above lowers its pricing, the tier below finds it harder to push its own rates up while preserving the usual differential. July, when both categories turned negative together (business −1.1%, city −5.3%), can be read as a sign that this pressure has begun reaching the lower tier. The same split can carry the opposite signs elsewhere: Kanagawa ADR Splits: City Hotels +20.9%, Business −1.7% in June 2026 covers the inverse pattern, with the upper tier rising and the lower tier sinking.
| Month | Business 2025 |
Business 2026 |
YoY | City 2025 |
City 2026 |
YoY | Gap 2025 |
Gap 2026 |
|---|---|---|---|---|---|---|---|---|
| Jan | ¥5,958 | ¥6,247 | +4.9% | ¥7,559 | ¥7,496 | −0.8% | ¥1,601 | ¥1,249 |
| Feb | ¥6,096 | ¥6,384 | +4.7% | ¥7,708 | ¥7,472 | −3.1% | ¥1,612 | ¥1,088 |
| Mar | ¥6,248 | ¥6,498 | +4.0% | ¥7,844 | ¥8,478 | +8.1% | ¥1,596 | ¥1,980 |
| Apr | ¥6,429 | ¥6,554 | +1.9% | ¥9,387 | ¥8,444 | −10.0% | ¥2,958 | ¥1,890 |
| May | ¥6,954 | ¥7,180 | +3.2% | ¥8,982 | ¥8,686 | −3.3% | ¥2,028 | ¥1,506 |
| Jun | ¥6,182 | ¥6,849 | +10.8% | ¥8,327 | ¥7,694 | −7.6% | ¥2,145 | ¥845 |
| Jul | ¥6,818 | ¥6,740 | −1.1% | ¥8,444 | ¥7,993 | −5.3% | ¥1,626 | ¥1,253 |
| Jan–Jul avg. | ¥6,384 | ¥6,636 | +4.0% | ¥8,322 | ¥8,038 | −3.4% | ¥1,938 | ¥1,402 |
Settled ADR for Niigata Prefecture, settled (past) months. N = business hotels 126–135 properties in 2025 and 124–133 in 2026; city hotels 18 properties per month in both years. Source: MetroEngines Research; compiled by the HotelBank Editorial Team
Source: MetroEngines Research; compiled by the HotelBank Editorial Team
Occupancy is near 90% in both categories — the divergence is on price
It is worth checking the occupancy side for context on why rates diverged. Monthly average estimated OCC in Niigata (based on published online inventory) was 90.1% for business hotels in June 2026 (96–111 properties observable daily, average observation coverage 90.8%) and 88.7% for city hotels (14–17 properties, 96.8%); in July 2026, 89.1% and 89.3% respectively. City hotels edged slightly ahead in July, meaning there is almost no gap between the categories in how fast inventory clears. A year-on-year comparison from the same source is outside this article, but at the level shown, the explanation that “only city hotels are failing to sell, so rates fell” does not hold up well.
The supply side is worth a look as well. Accommodation properties that opened in Niigata Prefecture during 2026 total 13 properties and 577 rooms (based on confirmed online listings). Of these, three properties with 282 rooms are business hotels and one property with 220 rooms is a resort hotel — those two categories alone account for roughly 87% of the new rooms. City hotel openings numbered zero. In other words, the heaviest new supply landed in the business tier, and business settled ADR still held positive through the first half. Added supply does not translate immediately into downward rate pressure: that is the fact this prefecture’s first half establishes. For how to line up the category mix of new supply against ADR movement, Hiroshima 2026: 1,003 New Rooms, City Settled ADR Turns −4.1% in July works through the same procedure.
The opening counts and room counts above are compiled from confirmed online listings. Only about 19% of properties are listed online ahead of opening, and more than half are listed after opening, so counts for recent and future months and years may rise as further listings appear (the figures shown are a floor as of today). We recommend reading them alongside the building-plan pipeline based on construction confirmation applications (MLIT, Survey on Construction Statistics).
If so, the shortfall at city hotels is better explained by how rates were set and how the guest mix is composed than by occupancy or new supply. Given a sample of just 18 properties, it is also entirely possible that a handful of them operating in a lower range than last year is showing through in the prefecture-wide median. Either way, the fact that the rate gap is narrowing means the assumptions behind pricing have changed for operators in both the upper and the lower tier.
For revenue managers running business and city hotels in Niigata — implications and an action plan
(1) First establish which side of the market your own tier sits on. The business tier in Niigata averaged ¥6,636 over January–July, the city tier ¥8,038. Whichever of those your own achieved rate over the same period sits closer to determines whether you had the tailwind or the headwind in the first half. Judge your tier by the actual rate level, not by the category label on the sign.
(2) Treat June’s +10.8% as rates not cut, not rates raised. Against a low June 2025 base of ¥6,182, June 2026 came in at ¥6,849. The double-digit gain comes from not having to ease rates in a month where easing is the norm. That makes it a useful prompt to review how well you held your floor rate in your own soft-demand months.
(3) Carry the narrowing from ¥1,938 to ¥1,402 through into a review of your competitive set. When the upper tier comes down, properties that used to be separated from you by price land on the same shortlist. In the business tier that calls for differentiation on the assumption that the tier above has moved down; in the city tier it calls for redefining what justifies the premium now that the gap to the tier below has closed to ¥845 (June).
(4) Do not judge July’s sign reversal on a single month. July is the first settled month in which both categories turned negative together (business −1.1%, city −5.3%). The direction warrants watching, but the business-side decline is only in the 1% range and is not grounds for an immediate rate cut. Months from August onward are current-point estimates on a different basis, so wait for the settled figures before deciding.
The actions below are laid out by time horizon. Each is a checkpoint for deciding whether to act, read against your own numbers — none of them guarantees a result.
| Horizon | Action | Trigger | Purpose |
|---|---|---|---|
| Today to this week | Lay your own January–July achieved rate out by month and overlay it on the settled market figures (business ¥6,247–¥7,180; city ¥7,472–¥8,686) | If your property sits below the market figure for its tier across several months | Identify the months where headroom to raise remains |
| Today to this week | Rebuild the competitive set by rate band, selecting on prevailing rates rather than the conventional category split | If the gap between categories has narrowed to ¥1,402 (January–July average) while your competitor table is still organized by category | Make visible the properties that now overlap you on price |
| Within two weeks | For upper-tier properties, review how the elements that justify the rate differential — food and beverage, room grade, ancillary services — are presented | If, in a tier where the June gap closed to ¥845, you sense the basis for the price difference is not getting across | Build a reason to be chosen that does not rely on cutting rates |
| Within two weeks | Set a floor on the minimum rate in soft-demand months and document the rules for easing | If the month you eased rates furthest last year coincides with the market trough (June 2025, ¥6,182) | Capture the rate you did not give away when the same month comes round next year |
| Looking to next month | Set the second-half rate-revision calendar in advance, aligned to the seasonal shape of the settled figures | If last year’s in-year peak in August (business ¥7,956; city ¥11,759) also describes your own shape | Avoid setting high-demand months reactively |
| Looking to next month | Switch to evaluating months from August onward only once the settled figures are out | If material circulating internally compares current-point-estimate months directly against prior-year settled figures | Avoid making decisions on figures built to different bases |
Source: MetroEngines Research; compiled by the HotelBank Editorial Team
Summary — three yardsticks to take away from Niigata’s first half
First, the direction split by category. Across seven settled months, business hotels were positive in six (January–July average +4.0%) and city hotels negative in six (−3.4%). In the same prefecture and the same months, the story the market tells reverses depending on the category. For your own decisions, use the figure for the tier you belong to, not the prefecture average.
Second, always check the prior-year base behind an extreme year-on-year figure. Both business hotels’ +10.8% in June and city hotels’ −10.0% in April carry the effect of a prior-year trough or peak. Overlaying the two years on one chart lets you judge how far a month departs from the usual shape — something a single month’s percentage cannot show.
Third, the price ladder is compressing. The spread between city and business hotels moved from ¥1,938 to ¥1,402 on a January–July average, closing to ¥845 in June. Occupancy is level at roughly 90% for both, and new supply landed more heavily in the business tier if anything. Since the divergence arises purely on the price side, the next things to revisit are the competitive set and the basis for the price differential itself. For which rate bands stand in which parts of the prefecture, Niigata Hotel Investment Map: Niigata City, Yuzawa & Sado in 3 Layers sets it out from the geographic side.
About the data
- Definition of estimated OCC (based on published online inventory): published-inventory occupancy = 100 − 100 × rooms still listed online ÷ total rooms. It is an estimate based on how inventory offered online is being taken up, and is defined differently from actual room occupancy (it reads higher). The months used in this article are June 2026 and July 2026, both monthly averages of daily results for elapsed months.
- Booking curve: based on observations from 45 days before the stay date up to the present.
- Definition of settled ADR: an estimated transacted rate level (tax-excluded equivalent) derived from online distribution data — the lowest-plan rate level multiplied by a category-specific coefficient, ensembled across multiple channels. Past months are settled figures; current and future months are estimates based on present booking conditions. Reconciled against published operating results, the median error is 6.6%. The year-on-year comparisons in this article use settled (past) months only; months from August 2026 onward rest on a different basis and are not used in comparison.
- Breakdown of N: Niigata business hotels — 126–135 properties in 2025 and 124–133 in 2026 within scope for the settled ADR calculation. Niigata city hotels — 18 properties per month in both years (a small sample, so a pricing change at a few properties readily moves the prefecture-wide level). Properties observed for estimated OCC: June 2026, 96–111 business and 14–17 city; July 2026, 96–110 business and 15–17 city. New openings: 13 properties and 577 rooms opened in Niigata Prefecture in 2026 (based on confirmed online listings; listings appear anywhere from several months before opening to after it, so this is a floor as of today).
- Data as of August 21, 2026. Booking conditions and inventory shift daily, so the figures in this article are a snapshot at the time of retrieval.
■ Data sources
Settled ADR, estimated OCC and new openings all come from MetroEngines Research, compiled by the HotelBank Editorial Team. Coverage is business hotels in Niigata Prefecture (N=126–135 properties in 2025 and N=124–133 in 2026 within scope for settled ADR) and city hotels (N=18 properties per month in both years). The price series uses settled months from January 2025 through July 2026; estimated OCC uses monthly averages of daily observations for June and July 2026; new openings use the 13 properties and 577 rooms that opened in Niigata Prefecture in 2026 (based on confirmed online listings). Data as of August 21, 2026.
■ Calculation assumptions
Year-on-year comparisons are restricted to settled (past) months; months from August 2026 onward, which are estimates based on present booking conditions, are excluded from the calculation. The January–July average is a simple mean of each month’s settled ADR, with no weighting by property count or rooms sold. The gap between categories (city minus business) and the ratio are arithmetic derived from the same simple-mean series, and include no demand-forecasting model or probability weighting. Supply figures are compiled on an opening-year basis and do not reflect room additions or reductions from renovation or extension of existing properties.
■ Limitations and caveats
Settled ADR carries a median error of 6.6% (tax-excluded equivalent) when reconciled against published operating results, and does not match the achieved ADR of any individual property. Niigata city hotels are a small sample at N=18 properties per month, leaving considerable room for a pricing change at one or two properties to move the prefecture-wide level — the rates of change on the city side in this article need to be read on that basis. Estimated OCC is a metric based on published online inventory, reads higher than an actual-room basis, and is compiled on a different cut from the price series, so the property counts do not match. New openings are a floor based on confirmed listings, and draw on a different population from the pipeline based on construction confirmation applications (MLIT, Survey on Construction Statistics).
Related reading
- Kanagawa ADR Splits: City Hotels +20.9%, Business −1.7% in June 2026
- Hokkaido ADR H1 2026: City −5.7%, Business +4.1%, April the Turn
- Yamaguchi Settled ADR H1 2026: Business +3.4%, City Hotels −6.4%
- Fukui Settled ADR H1 2026: Business +4.4%, City +7.0%, Gains in Q2
- Ishikawa ADR H1 2026: City +3.6%, Business −1.3%, a 14.2pt Gap
- Shiga Settled ADR H1 2026: Business Hotels +4.8%, Resort Hotels −2.9%
- Hiroshima 2026: 1,003 New Rooms, City Settled ADR Turns −4.1% in July
- Niigata Hotel Investment Map: Niigata City, Yuzawa & Sado in 3 Layers