

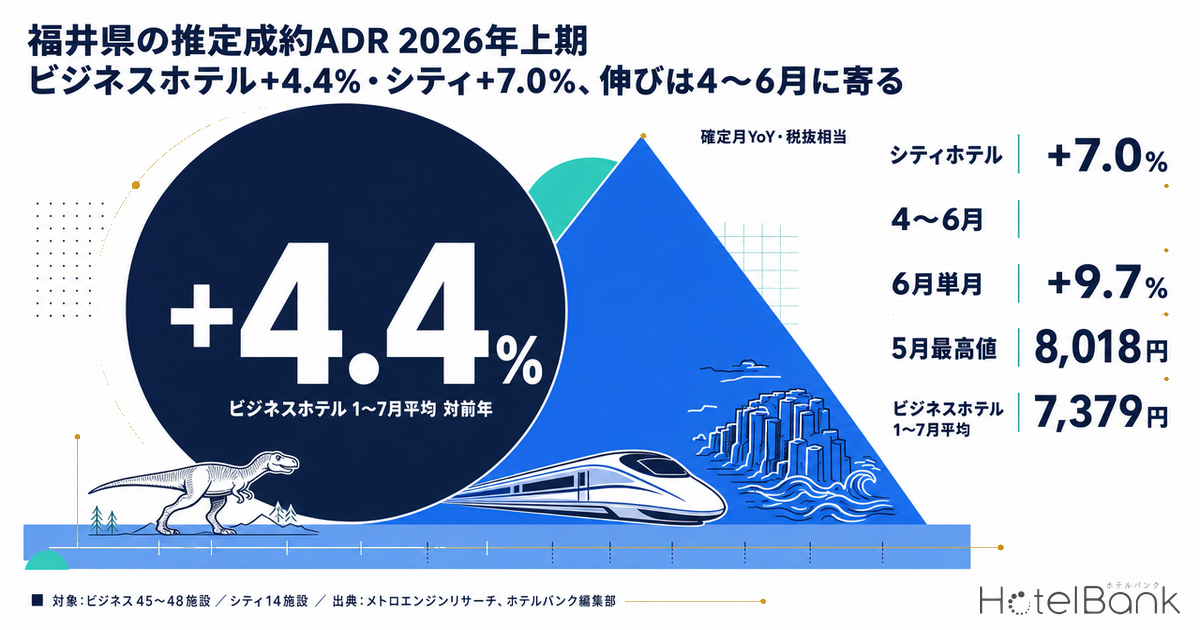
In Fukui’s accommodation market, estimated settled ADR for the first half of 2026 (January–July, final months) averaged ¥7,379 for business hotels (coverage: 45–48 properties), up +4.4% year on year, and ¥7,977 for city hotels (coverage: 14 properties), up +7.0%. Split by quarter, business hotels ran +1.7% in January–March and +6.3% in April–June — the year-on-year level is larger in the back half of the period. On a single-month basis, June was +9.7% (¥7,595) and July +6.3% (¥7,811). The ¥8,018 recorded by business hotels in May is the highest level among the final months from January 2024 onward that this article draws on. Below, we break down how Fukui’s rate increases have actually been passed through, using only year-on-year comparisons between final months, and read that alongside the most recent demand-side observations.
Coverage: Fukui business hotels N=45–48 properties / city hotels N=14 properties. The price metric in this article is estimated settled ADR (the settled price level inferred from OTA and other sales data, on a pre-tax-equivalent basis); occupancy is an estimate based on OTA-listed inventory. Full definitions appear at the end of the article. Data as of 13 August 2026.
- — Business hotels +4.4%, city hotels +7.0% — estimated settled ADR for January–July 2026 (final months) averaged ¥7,379 and ¥7,977 respectively. Coverage is 45–48 business properties and 14 city properties.
- — The gains sit in the back half of the period — business hotels ran +1.7% in January–March against +6.3% in April–June. Only January was negative at −5.3%; every month from February onward was positive.
- — The largest year-on-year gain came in June, a trough month, at +9.7% — the shoulder month of June moved from ¥6,926 to ¥7,595. Rates are rising not by pushing peak months higher, but by lifting the floor in quiet months.
- — The gap between the two categories opens and closes by month — from April to June, business and city hotels sat within ¥110–161 of each other; in July the gap widened to ¥625. In July of the prior year the order was reversed, with business ¥30 above city.
- — On the demand side, Saturday stands out while Sunday and Monday sag — estimated OCC for July 2026 was 95.9% on Saturdays and 86.2% on Sundays for business hotels. Saturday 19 September stood at 88.4% at 45 days out, versus 71.2% for Thursday 10 September — a starting point more than 17 points apart.
H1 2026 through final-month YoY — business +4.4%, city +7.0%
First, the premises. The price metric used here is estimated settled ADR, meaning the level of settled prices inferred from OTA and other sales data (on a pre-tax-equivalent basis). Comparisons are made only between months that have been calculated as final figures. Because 2026 is final through July, the comparison set is January–July 2025.
Estimated settled ADR for Fukui’s business hotels (coverage: 45–48 properties) was ¥6,415 in January 2026, down −5.3% year on year — the half opened on the negative side. From there it moved to +7.9% in February (¥7,170), +2.6% in March (¥7,261), +4.7% in April (¥7,386), +4.7% in May (¥8,018), +9.7% in June (¥7,595) and +6.3% in July (¥7,811). The simple average for January–July is ¥7,379, or +4.4% against the same period a year earlier (¥7,068). With demand conditions after the Hokuriku Shinkansen extension now entering their second and third year, the prefecture-wide settled price level has continued to run above the prior year. There was also a phase in the second year after the extension when overnight guest numbers fell below the prior year; reading that demand-side movement alongside the price trend shown here makes the relationship between demand and unit price easier to see.
City hotels (coverage: 14 properties) recorded ¥8,570 in January (+19.7%), ¥7,103 in February (−4.5%), ¥8,310 in March (+5.5%), ¥7,496 in April (+0.5%), ¥8,179 in May (+5.0%), ¥7,748 in June (+8.6%) and ¥8,436 in July (+15.3%). The January–July average is ¥7,977, or +7.0% against the same period a year earlier (¥7,452). That said, city hotel coverage is thin at 14 properties, so a change in the sales policy of a single property can move the monthly figure. The single-month swing (−4.5% to +19.7%) should be read as reflecting the thin base as much as any market-wide direction.
Source: MetroEngines Research; compiled by the HotelBank Editorial Team
Plotted year over year, business hotels share the same seasonal shape across 2025 and 2026 — falling in winter, rising from March, peaking in May, then easing in June (city hotels do not fit this shape, as their highest first-half figure is ¥8,570 in January 2026). The 2026 line runs above the 2025 line in almost every month from February onward. In other words, Fukui’s first half was less a case of one month spiking above the prior year, and closer to the whole level being lifted while the seasonal shape stayed intact.
| Month | Business 2025 | Business 2026 | YoY | City 2025 | City 2026 | YoY |
|---|---|---|---|---|---|---|
| January | ¥6,773 | ¥6,415 | −5.3% | ¥7,157 | ¥8,570 | +19.7% |
| February | ¥6,646 | ¥7,170 | +7.9% | ¥7,434 | ¥7,103 | −4.5% |
| March | ¥7,074 | ¥7,261 | +2.6% | ¥7,874 | ¥8,310 | +5.5% |
| April | ¥7,055 | ¥7,386 | +4.7% | ¥7,458 | ¥7,496 | +0.5% |
| May | ¥7,656 | ¥8,018 | +4.7% | ¥7,791 | ¥8,179 | +5.0% |
| June | ¥6,926 | ¥7,595 | +9.7% | ¥7,134 | ¥7,748 | +8.6% |
| July | ¥7,349 | ¥7,811 | +6.3% | ¥7,319 | ¥8,436 | +15.3% |
| Jan–Jul average | ¥7,068 | ¥7,379 | +4.4% | ¥7,452 | ¥7,977 | +7.0% |
Estimated settled ADR (pre-tax-equivalent, final figures). Coverage is 45–48 business properties and 14 city properties (varies by month). Source: MetroEngines Research; compiled by the HotelBank Editorial Team
Business hotel gains are concentrated in April–June
Splitting the half into January–March and April–June and computing year-on-year change for each brings out the difference in character between the two categories. Business hotels ran +1.7% in January–March and +6.3% in April–June: the first stretch stayed close to the prior-year level, while the second clearly moved above it. City hotels, by contrast, ran +6.8% in January–March and +4.6% in April–June, with the first stretch the larger of the two. As noted above, though, the city side covers only 14 properties, and January’s +19.7% pulls up the first-stretch average — a point to discount when reading it.
Following the business hotel side month by month: apart from January’s −5.3%, every month from February onward is positive. June’s +9.7% in particular is the largest year-on-year gain in the half. For Fukui’s business hotels, June is a shoulder month that falls after the May holiday demand recedes, and the prior-year level (June 2025) of ¥6,926 was among the lower readings of that half. Reaching ¥7,595 in that month means the floor pricing for the shoulder period was set higher than a year earlier. Rate increases have been passed through by making trough months shallower rather than by pushing peak months higher — that is the defining feature of this first half.
Source: MetroEngines Research; compiled by the HotelBank Editorial Team
The level gap between the two categories is also worth noting. In June 2026, business hotels stood at ¥7,595 against city hotels at ¥7,748, a gap of ¥153; in May the figures were ¥8,018 and ¥8,179, a gap of ¥161; in April, ¥7,386 and ¥7,496, a gap of ¥110. From spring into early summer, the two sit very close together on estimated settled ADR. July, by contrast, shows business at ¥7,811 and city at ¥8,436, a gap of ¥625 — a different picture from July of the prior year (business ¥7,349 and city ¥7,319, with business ¥30 ahead). With the city side thin at 14 properties this cannot be stated definitively, but one reading is that months in which the upper price tier moves first heading into summer coexist with months in which the two categories sit level. In neighbouring Ishikawa, within the same Hokuriku region, the signs for city and business hotels diverged outright; that case is broken down in Ishikawa ADR H1 2026: City +3.6%, Business −1.3%.
Demand-side observations — day-of-week estimated OCC in July and September booking pace
To see what lies behind rates clearing above the prior year, it helps to check the demand side as well. For July 2026, the most recent final month, Fukui’s estimated OCC (based on OTA-listed inventory) averaged 91.2% for business hotels (39 properties observed, 4,361 rooms in total) and 89.7% for city hotels (13 properties observed, 1,639 rooms in total). Averaged by day of week, the distribution is as follows.
| Day of week (July 2026) | Business hotels, estimated OCC | City hotels, estimated OCC |
|---|---|---|
| Monday | 87.6% | 87.5% |
| Tuesday | 91.8% | 89.5% |
| Wednesday | 92.5% | 88.9% |
| Thursday | 93.5% | 90.2% |
| Friday | 90.1% | 89.5% |
| Saturday | 95.9% | 95.0% |
| Sunday | 86.2% | 87.0% |
| Monthly average | 91.2% | 89.7% |
Estimated OCC (based on OTA-listed inventory). Target month July 2026; 39 business properties and 13 city properties observed. Source: MetroEngines Research; compiled by the HotelBank Editorial Team
For business hotels, Saturday is the highest at 95.9%, followed by Thursday at 93.5% and Wednesday at 92.5%. The troughs are Sunday at 86.2% and Monday at 87.6%. Mid-week days clustered in the low 90s, a Saturday that stands out, and a Sunday–Monday dip together form the pattern typical of a prefecture where business travel demand overlaps with weekend leisure and event demand. City hotels also peak on Saturday at 95.0%, with the remaining days contained in the 87–90% range and less day-of-week spread than business hotels. How far this “Saturday spikes, Sunday and Monday sag” shape holds in other prefectures varies, so it is worth checking your own market’s day-of-week profile rather than assuming Fukui’s shape carries over.
Next, the pace of bookings for arrival dates still ahead. Plotting booking curves for Fukui’s business hotels from 45 days before the stay date through to the most recent observation shows clear differences between arrival dates.
Estimated OCC (based on OTA-listed inventory), Fukui business hotels. Source: MetroEngines Research; compiled by the HotelBank Editorial Team
Read at fixed points, the picture is as follows. Saturday 19 September stood at 88.4% at 45 days out (39 properties observed) and 91.4% at the most recent observation point, 38 days out (36 properties observed). Saturday 5 September was at 82.2% at 45 days out (36 properties observed), 88.3% at 30 days out (39 properties observed) and 88.4% at the most recent point, 24 days out (36 properties observed). Saturday 22 August was at 77.2% at 45 days out (38 properties observed), 80.6% at 30 days out (38 properties observed) and 86.9% at the most recent point, 10 days out (36 properties observed) — building roughly 9.7 points over the 35 days from 45 days out to 10 days out. By contrast, the weekday of Thursday 10 September was at 71.2% at 45 days out (38 properties observed), 75.3% at 30 days out (39 properties observed) and still 75.3% at the most recent point, 29 days out (36 properties observed), tracking more than 10 points below the September Saturdays (the 5th and the 19th).
The point worth holding onto here is that arrival dates like Saturday 19 September, where the starting point itself is high, call for a different approach to pricing than dates like Saturday 22 August, where the starting point is low but the build is steady into the final stretch. The former is a case where inventory is already being absorbed at an early stage; for the latter, the size of the late-stage build is what informs the pricing decision. Note that the observations in this article run from 45 days out to the most recent point, and do not cover demand formation earlier than that.
For revenue managers running business and city hotels in Fukui — implications and an action plan
1. The market’s rate increases are passing through in the trough months. The largest year-on-year gain in the business hotel first half was June’s +9.7% (¥7,595). June is the shoulder month after May holiday demand recedes, and the prior-year level of ¥6,926 was among the lower readings of that half. The market has raised unit price not by pushing peak months higher, but by lifting the floor in trough months. When reviewing your annual rate calendar, it is worth checking where you have set the floor for quiet months before you look at the ceiling for busy ones.
2. The year-on-year level differs between the front and back halves of the period. Business hotels ran +1.7% in January–March against +6.3% in April–June. January alone came in below the prior year at −5.3%. In other words, rate setting passes through differently across January–March, which straddles the fiscal year end, than it does from April onward — so building next term’s budget on the average alone (“roughly +4.4% for the half”) risks diverging from how each month actually feels. Switching benchmarks on a quarterly basis fits practice better.
3. The level gap between categories opens and closes by month. From April to June the difference in estimated settled ADR between business and city hotels was ¥110–161, essentially level, whereas in July it opened to ¥625. In July of the prior year the order was reversed, with business ¥30 ahead. If you sit on the city side, this becomes a month-by-month question of how to differentiate and defend unit price in the months where the two are level; if you sit on the business side, whether there is room to chase the upper price tier in the months where the gap opens. Because the city side is thin at 14 properties, however, a single month’s gap should not be used as a benchmark on its own — judge it against a run of several months.
4. The day-of-week trough sits on Sunday and Monday. Estimated OCC for July 2026 was 95.9% on Saturdays for business hotels, against 86.2% on Sundays and 87.6% on Mondays — a spread of roughly 10 points between Saturday and Sunday. How to fill Sunday and Monday inventory is the main battleground for building weekly RevPAR while defending unit price, and there is room to consider multi-night conditions and where to draw demand with different trip purposes.
Below is an action plan by time horizon based on the above. None of these guarantee results; they are offered as material to consider in light of your own property’s situation.
| Time horizon | Action | Decision trigger (figures from this article) | Aim |
|---|---|---|---|
| Today to this week | Compare inventory absorption on the nearest Saturday against your own pace | For Saturday 22 August the market stood at 80.6% at 30 days out and 86.9% at 10 days out. If your own pace for that date sits clearly below this band, review both how remaining inventory is presented and the rate | Reduce late-stage missed pickup |
| Today to this week | Set rate and inventory policy separately for Sundays and Mondays | Estimated OCC for July 2026 was 95.9% on Saturdays against 86.2% on Sundays and 87.6% on Mondays. If your property shows the same trough shape, there is room to revisit uniform day-of-week settings | Lift RevPAR on a weekly basis |
| Within two weeks | Split September weekend and holiday pricing between dates with fast and slow pace | Saturday 19 September was at 88.4% at 45 days out and 91.4% at 38 days out; the weekday of Thursday 10 September was at 71.2% at 45 days out and 75.3% at 30 days out — a spread of more than 17 points within the same month at 45 days out | Secure unit price on fast-pace dates |
| Within two weeks | Take stock of your most recent final-month ADR alongside the market level | Market estimated settled ADR for July 2026 was ¥7,811 for business and ¥8,436 for city hotels. If your own result sits away from this level, break down whether the cause is rate-range design or mix | Clarify where your unit price stands |
| Looking to next month | Redraw the floor rate for quiet months across the annual calendar | The market posted +9.7% in June, the largest gain of the half. If your own shoulder-period floor is unchanged from a year earlier, there is room to consider raising it | Lift unit price in trough months |
| Looking to next month | Rebuild next term’s budget assumptions on quarterly benchmarks | Business hotels ran +1.7% in January–March against +6.3% in April–June, a front-half/back-half split. If a budget applies the +4.4% first-half average uniformly across all months, divide it | Narrow the gap between budget and monthly results |
Source: MetroEngines Research; compiled by the HotelBank Editorial Team
Summary — three yardsticks to take away from Fukui’s first half
Yardstick 1: the year-on-year change for the half differs by category. Comparing final months against each other, Fukui’s business hotels averaged ¥7,379 for January–July, +4.4% year on year (coverage: 45–48 properties), while city hotels averaged ¥7,977, +7.0% (coverage: 14 properties). Decide first which band your property sits in, then line up your own year-on-year change against the market’s. When the market is moving in the +4% range and your property is flat, there is a chance you are on the side where the gap has not narrowed.
Yardstick 2: the gains show up in the trough months. The largest gain in the business hotel first half was June’s +9.7%. Year-on-year increases concentrated in the shoulder month rather than the peak months. Searching for headroom starting from the floor on quiet days, rather than the ceiling on busy ones, is more in line with how the market is moving.
Yardstick 3: weekends and weekdays start from different points. Saturday 19 September stood at 88.4% at 45 days out; the weekday of Thursday 10 September stood at 71.2%. Even within the same month, the height at 45 days out differs by arrival date. Looking first at where the curve begins, not only at its slope, makes it easier to separate the dates where you should move price from the dates where you should wait.
About the data in this article
■ Data sources
Estimated settled ADR is a monthly aggregation by category for business hotels and city hotels in Fukui, referencing final months from January 2024 onward. Estimated OCC is based on daily observations for July 2026, and the booking curves on observations from 45 days before the stay date through to the most recent point. All are aggregated figures from MetroEngines Research (data as of 13 August 2026).
■ Calculation assumptions
Year-on-year comparisons are constructed only between months calculated as final figures; months that are not final (August 2026 onward) are excluded entirely. The first-half average (January–July) and the quarterly averages (January–March / April–June) are simple averages of the monthly values, with no weighting by the number of properties covered in each month. Day-of-week estimated OCC is a simple average of the daily values for the same day of week within the month in question.
■ Limitations and caveats
City hotel coverage is thin at 14 properties, and a change in the sales policy of a single property can move the monthly value, so single-month year-on-year figures should be interpreted with a margin. Estimated OCC is based on OTA-listed inventory and therefore reads higher than actual room occupancy. The booking curves do not include demand formation earlier than 45 days out. This article describes market-level conditions and does not guarantee the results of any individual property or of any measure taken.
・Definition of estimated OCC (based on OTA-listed inventory): occupancy based on OTA-listed inventory = 100 − 100 × rooms remaining on OTA listings ÷ total rooms. It is an estimate based on the absorption of inventory sold on OTAs and differs in definition from actual room occupancy (it reads higher). This article covers the target month of July 2026 (Fukui; 39 business properties observed / 13 city properties observed).
・Booking curves: based on observations from 45 days before the stay date through to the most recent point. Coverage is Fukui business hotels (36–39 properties observed), with stay dates of 22 August, 5 September, 10 September and 19 September 2026.
・Definition of estimated settled ADR: the settled price level (pre-tax-equivalent) inferred from OTA and other sales data (lowest-plan level × category coefficient, ensembled across multiple channels). Past months are final figures; current and future months are estimates based on sales conditions at the present time. Median error against published operating results is 6.6%. All year-on-year comparisons in this article are made between months calculated as final figures.
・Breakdown of properties covered: for Fukui business hotels, estimated settled ADR covers 45–48 properties for January–July 2026 (41–43 properties in the same period of 2025). City hotels cover 14 properties for January–July 2026 (12–14 properties in the same period of 2025). Because the city hotel base is thin, a change in the sales policy of a single property readily affects the monthly value, so single-month changes should be interpreted with a margin.
・Data as of: 13 August 2026. Because sales conditions and inventory change daily, the figures in this article are a snapshot at the time of retrieval.
Related Reading
- Fukui’s 3 Hotel Clusters: 2.5x ADR Gap and the Upper-Mid Whitespace
- Hokuriku Shinkansen Year 3: Fukui, Tsuruga, Komatsu & Kanazawa ADR Compared
- Ishikawa ADR H1 2026: City +3.6%, Business −1.3%, a 14.2pt Gap
- Chiba Settled ADR: H1 2026 Beats Last Year, July Turns −8.2%
- H1 2026 ADR YoY: 16 Prefectures Aligned, 31 Split Across 4 Categories