

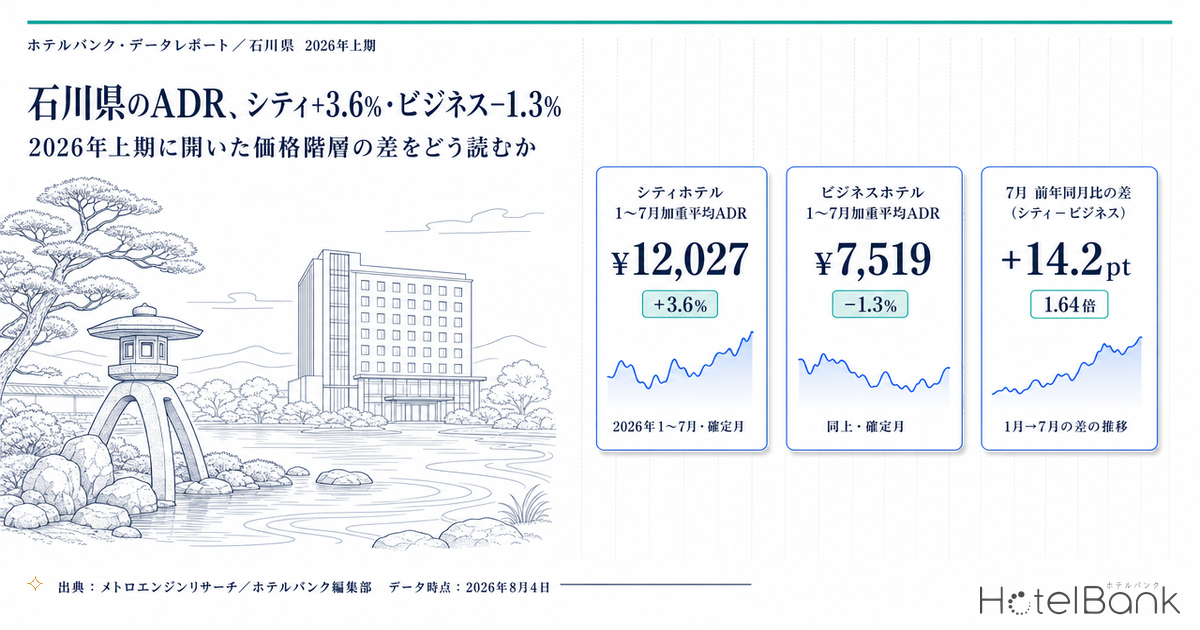
In Ishikawa, city hotels and business hotels moved in opposite directions on estimated settled ADR during the first half of 2026. Comparing final months against each other (January–July 2026 vs the same months of 2025), city hotels came in at a day-weighted average of roughly ¥12,000 (¥11,600 a year earlier, +3.6%), above the prior year, while business hotels landed at roughly ¥7,500 (¥7,600 a year earlier, −1.3%), marginally below. The gap between the two has widened broadly since March, and by July the difference in year-on-year change reached 14.2 points (city +7.4% vs business −6.8%). Why did the same prefecture, over the same seven months, split this far apart? Using final figures and the most recent booking curves, we build three “yardsticks” that can be applied when resetting rate ranges for the second half.
Coverage: Ishikawa city hotels N=10 properties / business hotels N=109–110 properties (estimated settled ADR, final months); occupancy covers city N=10 properties and business N=98–103 properties. The price metric in this article is estimated settled ADR (a settled price level estimated from OTA and similar sales data, tax-exclusive equivalent); occupancy is an estimate based on OTA-listed inventory. Definitions for both appear at the end of the article. Data as of 4 August 2026.
- — Final figures for January–July 2026 (day-weighted average) are city ¥12,027 (+3.6% YoY) and business ¥7,519 (−1.3%). Within the same prefecture, over the same seven months, the two categories moved in opposite directions in the first half.
- — The “gap” in year-on-year change went from −6.4pt in January to +14.2pt in July. Apart from a single narrowing in April (+0.7pt), it has widened broadly since March.
- — Seasonal amplitude (highest ÷ lowest among final months) is 1.71x for city and 1.28x for business. Business hotels have structurally less room to lift rates in peak months.
- — For arrivals on Wednesday 5 August 2026, estimated OCC from 45 days out to the latest observation rose +10.3pt for city and +25.2pt for business. The same “70% at 45 days out” means different things by category.
- — The city ÷ business ratio went from 1.43x in July 2025 to 1.64x in July 2026. In yen terms the gap widened from about ¥3,300 to about ¥4,700.
H1 2026 in final months — city turned in March, business sank again in June
Start with only the final months for which a year-on-year comparison is available (January–July 2026). Both city and business hotels share one feature: they opened the year below the prior year. City hotels were at about ¥9,200 in January 2026 (about ¥9,900 a year earlier, −7.3%) and −7.6% in February. Business hotels were also soft, at −0.9% in January and −3.8% in February.
The turning point was March. City hotels flipped above the prior year at +4.3% in March and have not returned to negative territory through July. May recorded the largest gain of the first half at +11.6%, roughly ¥15,700 against about ¥14,000 a year earlier, and the category held positive year-on-year even in demand-trough months, at +7.8% in June and +7.4% in July. Business hotels, by contrast, did move above the prior year in April (+3.9%) and May (+2.8%), but slipped back into negative territory at −4.7% in June and −6.8% in July.
| Final month | City 2026 | City 2025 | YoY | Business 2026 | Business 2025 | YoY | Gap |
|---|---|---|---|---|---|---|---|
| January | ¥9,176 | ¥9,902 | −7.3% | ¥6,837 | ¥6,899 | −0.9% | −6.4pt |
| February | ¥9,678 | ¥10,476 | −7.6% | ¥6,900 | ¥7,173 | −3.8% | −3.8pt |
| March | ¥12,528 | ¥12,006 | +4.3% | ¥7,535 | ¥7,580 | −0.6% | +4.9pt |
| April | ¥14,972 | ¥14,313 | +4.6% | ¥8,344 | ¥8,028 | +3.9% | +0.7pt |
| May | ¥15,680 | ¥14,046 | +11.6% | ¥8,750 | ¥8,511 | +2.8% | +8.8pt |
| June | ¥10,081 | ¥9,350 | +7.8% | ¥6,994 | ¥7,338 | −4.7% | +12.5pt |
| July | ¥11,878 | ¥11,063 | +7.4% | ¥7,224 | ¥7,755 | −6.8% | +14.2pt |
| Jan–Jul weighted average | ¥12,027 | ¥11,607 | +3.6% | ¥7,519 | ¥7,618 | −1.3% | +4.9pt |
Ishikawa, estimated settled ADR (tax-exclusive equivalent). All comparisons are final figures against final figures (based on past actuals). City N=10 properties (10 properties in both 2025 and 2026); business N=109–110 properties (107–111 properties in 2025). “Gap” is the city YoY minus the business YoY, in points. The weighted average is weighted by the number of days in each month. City figures are a median-based aggregate of 10 properties, so the level should be read as a range rather than a point.
Source: Compiled by the HotelBank Editorial Team from MetroEngines Research.
The column worth watching is “Gap” on the far right. From a floor of −6.4 points in January, it ran −3.8 in February → +4.9 in March → +8.8 in May → +12.5 in June → +14.2 in July, widening throughout, with one narrowing in April (+0.7 points). Averaged across the first half it is +4.9 points, but that average simply smooths together “balance in the early months” and “divergence in the later ones”. The current reality is far more split than the average suggests.
Laying the years on top of one another shows that the seasonal shape of city hotels has itself changed. In 2024, October and November were the annual peaks at ¥17,112 and ¥17,900; in 2025 those levels fell to ¥14,126 and ¥15,586. In 2026 the year opened below the prior year, but from March onwards the line runs above the 2025 curve, and by May it had recovered to ¥15,680 — above even May 2024 (¥14,984).
Estimated settled ADR for Ishikawa city hotels (N=10–11 properties). August–December 2026 (dotted) are not final figures but current estimates based on the present sales position.
Source: Compiled by the HotelBank Editorial Team from MetroEngines Research.
Business hotels have a “flat shape” — the constraint of a 1.28x seasonal amplitude
Overlaying the years for business hotels, the lines lie flat compared with city hotels. Taking the range across final months for January–July 2026, the low is ¥6,837 in January and the high is ¥8,750 in May, so highest ÷ lowest is just 1.28x. Over the same period, city hotels ran from a low of ¥9,176 in January to a high of ¥15,680 in May — 1.71x. Same prefecture, same seven months, and the swing in price differs by more than 1.3x.
This difference in shape feeds directly into the year-on-year gap. Because city hotels have room to lift substantially in peak months, they can overtake the prior year decisively in any month when demand returns. Business hotels face a ceiling even in peak months, so there is little material to push year-on-year higher. In the first half, business hotels recovered ground in only two months, April and May, and by narrow margins of +3.9% and +2.8%.
Estimated settled ADR for Ishikawa business hotels (N=92–118 properties). August–December 2026 (dotted) are not final figures but current estimates based on the present sales position.
Source: Compiled by the HotelBank Editorial Team from MetroEngines Research.
Taking the level ratio between the two (city ÷ business) across final months makes the widening tier gap even more direct. June 2025 was 1.27x and June 2026 was 1.44x; July 2025 was 1.43x and July 2026 was 1.64x. In yen, the June gap widened from about ¥2,000 to about ¥3,100, and the July gap from about ¥3,300 to about ¥4,700. Accommodation pricing in the prefecture is shifting from a “two-storey” structure to a “two-storey structure with a higher upper floor” — that is the reality of the first half. This divergence between categories is not unique to Ishikawa; it also appears as a nationwide pattern in our breakdown of year-on-year change by prefecture and category, Japan Hotel ADR Polarization 2026.
Demand arrives differently — booking curves at 45 days out, 30 days out and the latest observation
To see where the price gap comes from, look at recent booking progress. Plotting booking curves from 45 days before the stay date through to the latest observation, city and business hotels clearly differ in “when inventory fills”.
For arrivals on Wednesday 5 August 2026, for example, estimated OCC (based on OTA-listed inventory) for city hotels ran 69.6% at 45 days out → 70.6% at 30 days out → 79.9% at the latest observation (2 days out; as of 4 August 2026, N=10 properties), a build over the period of +10.3 points. Business hotels on the same date ran 60.8% at 45 days out → 64.2% at 30 days out → 86.0% at the latest observation (2 days out; as of 4 August 2026, 83–101 properties observed), a build of +25.2 points. City hotels have already secured close to 70% at 45 days out, and the late-stage gain is small. Business hotels sit at 60% at 45 days out and then stack up sharply in the final two weeks. This pattern — inventory filling differently by category — is not specific to Ishikawa: the same directional difference has been observed in the Tokyo market, where business hotels gained +25.7 points against +14.5 points for city hotels over the same window.
Estimated OCC (based on OTA-listed inventory) for arrivals on Wednesday 5 August 2026. The x-axis is days remaining until the stay date. City N=10 properties; business 83–101 properties observed.
Source: Compiled by the HotelBank Editorial Team from MetroEngines Research.
This asymmetry is not confined to a single date. Taking fixed points (45 days out, 30 days out, latest observation) across several August and September arrival dates, the business build exceeded the city build on every date.
| Stay date | City 45 days out | 30 days out | Latest obs. | Build | Business 45 days out | 30 days out | Latest obs. | Build |
|---|---|---|---|---|---|---|---|---|
| Aug 5 (Wed) | 69.6% | 70.6% | 79.9% | +10.3pt | 60.8% | 64.2% | 86.0% | +25.2pt |
| Aug 8 (Sat) | 83.6% | 84.7% | 91.0% | +7.4pt | 77.2% | 81.1% | 91.7% | +14.5pt |
| Aug 14 (Fri) | 80.0% | 83.2% | 88.6% | +8.6pt | 69.8% | 73.1% | 83.7% | +13.9pt |
| Aug 17 (Mon) | 72.5% | 71.5% | 74.4% | +1.9pt | 59.0% | 62.3% | 70.8% | +11.8pt |
| Aug 29 (Sat) | 75.3% | 78.4% | 79.1% | +3.8pt | 68.6% | 74.6% | 76.3% | +7.7pt |
| Sep 1 (Tue) | 72.0% | 71.8% | 72.1% | +0.1pt | 57.6% | 60.5% | 60.8% | +3.2pt |
Estimated OCC (based on OTA-listed inventory), from observations running from 45 days before the stay date through to the most recent reading. “Latest obs.” is the most recent observation point for each stay date (Aug 5: 2 days out; Aug 8: 5–6 days out; Aug 14: 11 days out; Aug 17: 14 days out; Aug 29: 26 days out; Sep 1: 29 days out). “Build” is the point difference from 45 days out to the latest observation. Properties observed: city 9–10, business 82–101. Data as of 4 August 2026.
Source: Compiled by the HotelBank Editorial Team from MetroEngines Research.
The day-of-week shape also differs between the two. Averaging the daily actuals for July 2026 — a final month — by day of week, the monthly averages are close: 82.8% for city (July 2026, final month / N=10 properties) and 82.0% for business (July 2026, final month / N=98–103 properties). But the peaks and troughs within that are larger for business hotels. Business runs 90.3% on Saturday against 75.1% on Monday and 78.1% on Sunday, a maximum spread of 15.2 points. City runs 87.8% on Saturday and 79.3% on Monday, a maximum spread of just 8.5 points. Business hotels lean more heavily on weekends and fall further at the start of the week. Which day the trough lands on varies by region — in some markets, such as Aichi and Hiroshima, the trough falls on Sunday rather than Monday.
| Day of week (July 2026) | Mon | Tue | Wed | Thu | Fri | Sat | Sun | Monthly avg. |
|---|---|---|---|---|---|---|---|---|
| City (N=10 properties) | 79.3% | 81.7% | 82.1% | 85.0% | 83.0% | 87.8% | 80.2% | 82.8% |
| Business (N=98–103 properties) | 75.1% | 81.3% | 83.0% | 83.7% | 81.9% | 90.3% | 78.1% | 82.0% |
Estimated OCC (based on OTA-listed inventory) for Ishikawa, calculated as a simple average by day of week of the daily actuals for July 2026 (a final month). Includes the three-day weekend of 18–20 July (Sat–Mon) containing the Monday 20 July public holiday.
Source: Compiled by the HotelBank Editorial Team from MetroEngines Research.
The composition of that long weekend is telling in itself. Saturday 18 July 2026 was almost full at 99.4% for city and 99.4% for business, and Sunday the 19th held high at 90.2% for city and 94.7% for business. Yet the final night of the break, Monday the 20th (a public holiday), fell to 75.3% for city and 69.4% for business. It was a month in which Ishikawa’s pattern showed up clearly: inventory absorption on “the nights up to the middle of a long weekend” and on “the final night” are entirely different things.
Current estimates for the second half (August–December 2026)
For future months, what is available is not final figures but current estimates based on the present sales position. City hotels stand at ¥12,887 for August and ¥15,288 for October; business hotels at ¥9,689 for August, ¥12,146 for October and ¥12,212 for November. All of these can move with future sales activity, and because the basis of calculation differs from that of final months, any straight comparison against prior-year final figures should wait until month-end finalisation. Here we limit ourselves to confirming the shape — which months of the second half are expected to peak.
| Stay month (current estimate) | Aug | Sep | Oct | Nov | Dec |
|---|---|---|---|---|---|
| City (N=10 properties) | ¥12,887 | ¥12,710 | ¥15,288 | ¥14,456 | ¥13,197 |
| Business (N=92–109 properties) | ¥9,689 | ¥10,821 | ¥12,146 | ¥12,212 | ¥9,276 |
Current estimates of estimated settled ADR (tax-exclusive equivalent). These are not final figures and may move with future sales activity. A straight comparison against final figures requires waiting for month-end finalisation. Data as of 4 August 2026.
Source: Compiled by the HotelBank Editorial Team from MetroEngines Research.
These current estimates cannot be read straight across as year-on-year change, because the basis differs (final figures are built on past actuals; current estimates on inventory still on sale). Even so, setting out “what level the final figures reached over the past two years” gives a useful bearing when redrawing second-half ranges.
| Stay month | City 2024 final | 2025 final | 2026 current est. | Business 2024 final | 2025 final | 2026 current est. |
|---|---|---|---|---|---|---|
| August | ¥14,319 | ¥13,519 | ¥12,887 | ¥8,599 | ¥8,486 | ¥9,689 |
| September | ¥12,680 | ¥12,139 | ¥12,710 | ¥8,316 | ¥8,058 | ¥10,821 |
| October | ¥17,112 | ¥14,126 | ¥15,288 | ¥9,170 | ¥8,891 | ¥12,146 |
| November | ¥17,900 | ¥15,586 | ¥14,456 | ¥9,453 | ¥9,465 | ¥12,212 |
| December | ¥10,514 | ¥9,858 | ¥13,197 | ¥7,192 | ¥6,849 | ¥9,276 |
Ishikawa, estimated settled ADR (tax-exclusive equivalent). The 2024 and 2025 columns are final figures (based on past actuals); the 2026 column is a current estimate (based on inventory still on sale), so the basis of calculation differs. The difference between the right-hand column and the two left-hand columns therefore cannot be interpreted as a year-on-year change. City N=10–11 properties; business N=92–118 properties. Data as of 4 August 2026.
Source: Compiled by the HotelBank Editorial Team from MetroEngines Research.
What the comparison shows is that the size of the basis difference varies by category. The city current estimates (¥12,887 for August, ¥15,288 for October) sit in the same band as the 2025 final figures (¥13,519 and ¥14,126). The business current estimates (¥12,146 for October, ¥12,212 for November), by contrast, run roughly 30% above the 2025 final figures (¥8,891 and ¥9,465). The safer reading is that business hotels carry considerably more room for the level to come down as the month finalises. Setting second-half range ceilings directly to the current estimates risks aiming too high, particularly in the business category.
For revenue managers running city and business hotels in Ishikawa — implications and an action plan
(a) Operational insights
1. Hold your yardstick at the level of “the tier your property belongs to”, not the “prefecture average”. The July 2026 final figures are ¥11,878 for city and ¥7,224 for business, a ratio of 1.64x. Accommodation pricing in Ishikawa split into two bands through the first half, and the distance between them widened. Which band your July performance sits closest to changes the benchmark you should be referencing. Adopting the prefecture-wide average as your own target makes misjudgement most likely for properties sitting between the tiers.
2. The year-on-year “gap” has been widening broadly since March. It moved from −6.4 points in January to +14.2 points in July, trending wider apart from the single narrowing in April. This reads less as a single-month wobble than as a direction sustained through the first half. If you operate in the business category, the first check is whether the prefecture-wide softness of −4.7% in June and −6.8% in July also shows up at your property, on a final-month basis. If you are holding flat against the prior year, that in itself is a relative advantage against the market.
3. If bookings arrive differently, the timing of rate changes should differ too. For 5 August (Wed) arrivals, city ran 69.6% at 45 days out → 79.9% at the latest observation (+10.3 points), while business ran 60.8% → 86.0% (+25.2 points). Business hotels stack up heavily in the final stretch, so the inventory position at 45 days out alone is a poor guide to where the date will land. City hotels, conversely, are close to their final shape at 45 days out, which leaves room to act early on dates that are short of target at that checkpoint. Note too that 1 September (Tue) barely moved through to the latest observation (29 days out), at +0.1 points for city and +3.2 points for business — worth registering as the current state of the weekday shoulder.
4. There are distinct troughs by day of week and on the final night of long weekends. In the July 2026 day-of-week figures, the spread between Saturday at 90.3% and Monday at 75.1% is 15.2 points for business, against 8.5 points for city. On top of that, during July’s three-day weekend, Saturday the 18th ran 99.4% and Sunday the 19th 90.2–94.7%, while the final night — Monday the 20th, a public holiday — fell to 75.3% for city and 69.4% for business. If your day-of-week calendar runs on a two-way weekday/weekend split, this “final-night trough” stays invisible.
(b) Action plan
| Horizon | Action | Decision trigger | Purpose |
|---|---|---|---|
| Today–this week | Re-lay your own final results for January–July 2026 month by month against the same months a year earlier | Check whether your first half sits above or below the prefecture’s city +3.6% / business −1.3% (Jan–Jul weighted average) | Separate “the market was weak” from “we left business on the table” |
| Today–this week | Review your settings for near-term weekday shoulder dates (Tuesdays around 1 September, for example) | If 1 September (Tue) has moved only +0.1pt for city and +3.2pt for business from 45 days out to the latest observation, and your property is similarly stalled | Preserve room to work the weekday shoulder before resorting to a blanket late-stage discount |
| Within two weeks | Restructure the day-of-week calendar into three buckets: weekday / Fri–Sat / final night of a long weekend | If the July pattern — the final night of the long weekend (Monday the 20th, a public holiday) at 75.3% for city and 69.4% for business, well down on the previous day — also reproduces at your property | Stop treating a long weekend as a single block, so the final night can take a separate action |
| Within two weeks | Reset your 45-days-out checkpoint to match your category’s pattern | For a city-type property, judge a shortfall at 45 days out (the prefecture level of 69.6% for 5 August arrivals is one reference); for a business-type property, judge it after allowing for the late-stage build (+25.2pt on the same date) | Avoid both discounting too early and acting too late |
| Looking to next month | Redraw the ceiling and floor of your second-half range in light of the first half’s seasonal amplitude | If your annual range is narrower than the prefecture’s shape of 1.71x for city and 1.28x for business in the first half | Raise the ceiling in peak months and secure the headroom to hold the floor in quiet ones |
| Looking to next month | Match your October and November settings against the shape of the current estimates | Against a shape in which city peaks in October (¥15,288) and business in November (¥12,212), check whether your settings place their peak in the same month | Catch any missed peak-month settings before the figures finalise |
All figures in this table are the Ishikawa aggregates presented in this article. How well they apply will vary with each property’s circumstances.
Summary — three yardsticks to take away from Ishikawa’s first half
Yardstick 1: read the tier gap as a ratio. Ishikawa’s city ÷ business ratio went from 1.43x in July 2025 to 1.64x in July 2026. In yen, the gap widened from about ¥3,300 to about ¥4,700. Check where your property sits within its band using the ratio, not the prefecture average.
Yardstick 2: read seasonal amplitude as highest ÷ lowest. On final figures for January–July 2026, city is 1.71x and business 1.28x. If that spread is wider than your own annual range, there may still be headroom in your peak-month ceiling.
Yardstick 3: the level at 45 days out means different things by category. For 5 August (Wed) arrivals, city gained +10.3 points from 45 days out to the latest observation, business +25.2 points. The same “70% at 45 days out” is close to the final shape for a city hotel but still has room to move for a business hotel. Comparing your progress with another property’s without knowing your own category’s pattern gives you nothing to decide on.
Ishikawa’s first half was seven months in which city hotels grew and business hotels could not quite follow. But that difference is not a matter of one category being superior to the other; it arises from differences in how bookings arrive and in the shape of the price range. If you are redrawing your range for the second half, start by confirming which pattern your own property is running on, at the three points of 45 days out, 30 days out and the latest observation.
About the data
| Definition of estimated OCC | Occupancy on an OTA-listed inventory basis = 100 − 100 × rooms remaining on OTA listings ÷ total rooms. It is an estimate based on how inventory sold on OTAs is absorbed, and is defined differently from actual room occupancy (it reads higher). This article labels it “estimated OCC (based on OTA-listed inventory)”. Coverage is Ishikawa city hotels (N=10 properties, 1,748 rooms in total) and business hotels (N=98–103 properties, 12,309–12,508 rooms in total). The observation windows are July 2026 (daily actuals for a final month) and arrivals from 5 August to 16 September 2026 (progress snapshots). |
| Booking curve | Based on observations running from 45 days before the stay date through to the most recent reading. “Latest observation” is the most recent observation point for each stay date, so the number of days remaining differs by stay date (2 days out for 5 August 2026 arrivals; 29 days out for 1 September 2026 arrivals). |
| Definition of estimated settled ADR | A settled price level (tax-exclusive equivalent) estimated from OTA and similar sales data (lowest-plan level × category coefficient, ensembled across multiple channels). Past months are final figures; the current and future months are estimates based on the present sales position. Reconciliation against published operating results gives a median error of 6.6%. |
| Breakdown of N | For estimated settled ADR, Ishikawa city hotels N=10 properties (11 properties in 2024; 10 properties in 2025 and 2026) and business hotels N=106–118 properties (109–110 properties for the final months of January–July 2026; 92–109 properties for the current estimates of August–December 2026). Because the city hotel aggregate covers only about 10 properties, its level needs to be read as a range. |
| Data as of | 4 August 2026. Sales activity and inventory change daily, so the figures in this article are a snapshot at the time of retrieval. |
Source: Compiled by the HotelBank Editorial Team from MetroEngines Research.
■ Data source
MetroEngines Research’s proprietary database, which collects and aggregates publicly listed inventory and listed prices on OTAs on a daily basis. For the two Ishikawa categories of city hotels and business hotels, monthly series by prefecture and category (estimated settled ADR, tax-exclusive equivalent) were retrieved for the range from January 2024 to December 2026, and rooms remaining on listings and total rooms for each stay date were observed daily from 45 days before the stay date through to the most recent reading. The 62 monthly values for 2024–2026 presented in this article were confirmed to match the aggregates at the time of publication in every case.
■ Calculation assumptions
Year-on-year change is calculated only between final figures (on a past-actuals basis); no straight comparison is made between current estimates and prior-year final figures. The January–July weighted average is weighted by the number of days in each month. Seasonal amplitude is the highest value divided by the lowest among final months. “Gap” is the city year-on-year change minus the business year-on-year change, in points. Estimated OCC is calculated as “100 − 100 × rooms remaining on listings ÷ total rooms”, and the day-of-week aggregation is a simple average of each day falling on that weekday. The 2026 column of Table 5 is a current estimate (based on inventory still on sale) and uses a different basis of calculation from the final figures in the 2024 and 2025 columns.
■ Limitations and caveats
City hotel coverage is thin at N=10 properties, so a rate change at a single property can move the prefecture average. The level needs to be read as a range rather than a point. Estimated OCC is an estimate based on how inventory sold on OTAs is absorbed, and is defined differently from actual room occupancy, which includes direct and corporate-contract bookings (it reads higher). Year-on-year change in occupancy is not covered in this article, as the accumulated history is under two years. Because the days remaining at “latest observation” differ by stay date, the build figures are not strictly equivalent across stay dates. No reconciliation has been made against external official statistics such as the Overnight Travel Statistics Survey.
Related Reading
- Aichi Settled ADR 18 Months: City Swings 25.0pt, Business 14.0pt
- Kyoto Hotel ADR Falls YoY in June 2026: City −14.6%, Business −9.8%
- Japan Hotel ADR Polarization 2026: 57.6pt Prefecture×Category Gap
- Hokkaido City Hotels: Only Aug 15 Trails at 78.7% OCC, 45 Days Out
- Tochigi Booking Curves by Type: Resort 81.1% at T-45, Only +2.6pt Left
- Hokuriku Shinkansen Year 3: Fukui, Tsuruga, Komatsu & Kanazawa ADR Compared