

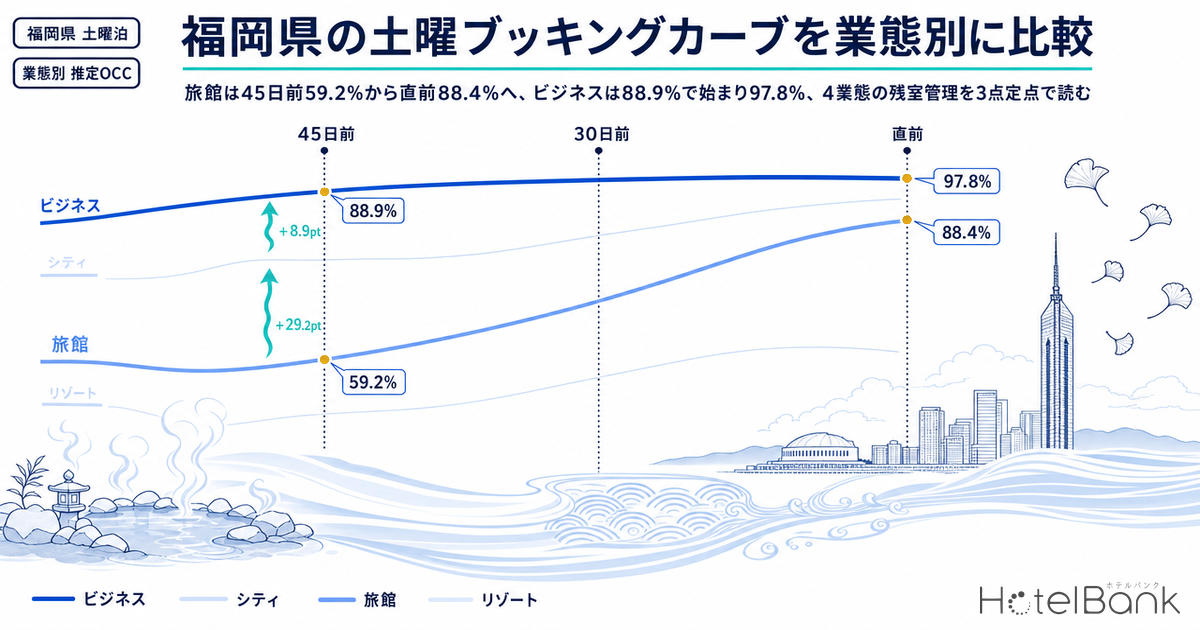
Splitting Fukuoka Prefecture’s lodging supply by property type and tracking booking pace for Saturday October 24, Saturday October 31 and Saturday November 7 through estimated OCC (based on OTA-listed inventory) reveals clearly distinct fill patterns by type. For Saturday October 24, business hotels were already at 88.9% 45 days before the stay date (N=178 properties / 22,797 rooms), reached 94.2% at 30 days out and 97.8% at the latest reading (8 days out) — a total gain of only 8.9pt. Ryokan, by contrast, climbed from 59.2% at 45 days out (N=52 properties / 952 rooms) to 78.8% at 30 days out and 88.4% at the latest reading, adding 29.2pt. Even on the same Saturday, the gap between “types that fill early” and “types that catch up later” stands out. This article lines up three fixed checkpoints (45 days out, 30 days out, latest) for four property types across three Saturdays, adds a weekday comparison, September actuals by day of week and monthly estimated settled ADR, and sets out a yardstick for inventory management by property type.
Coverage: Fukuoka Prefecture business hotels N=178–179 properties (22,797–22,829 rooms), city hotels N=24 properties (3,331 rooms), ryokan N=51–52 properties (948–952 rooms), resort hotels N=13–14 properties (742–757 rooms; small sample). The price metric in this article is estimated settled ADR (the settled price level estimated from OTA and other sales data, tax-excluded equivalent); occupancy is an estimate based on OTA-listed inventory. Definitions for both are at the end of the article. Data as of: October 17, 2026.
• ADR (average daily rate) = an estimated settled rate (tax-excluded equivalent), calculated by applying a property-type-specific adjustment factor to the lowest plan level each property publishes on OTAs (per room, 2 guests per room, tax included). Checked against property-level results disclosed by listed hotel REITs (91 properties, most recent 3 months), the median error is about 7%. These are estimates and differ from each property’s actual settled prices and accounting figures.
• ADR at the area level (prefecture, city/ward) is the median of the estimated settled rates of the covered properties (the level of a typical property in the area).
• Where listed prices are mentioned, they are per-room rates for 2 guests per room (tax included).
• OCC (occupancy) = rooms sold as a share of total rooms in the area (an estimate based on OTA sales inventory).
• Source: MetroEngines Research (continuously tracks OTA published prices for about 168,000 properties in Japan, of which about 27,000 are confirmed operating)
- — Ryokan went from 59.2% at 45 days out to 88.4% at the latest reading (+29.2pt): stays on Saturday, October 24, 2026; N=52 properties / 952 rooms. Business hotels started at 88.9% and reached only 97.8% (+8.9pt).
- — The 45→30-day gain falls in a band specific to each type: across three Saturdays, ryokan added +15.4 to +19.6pt, business hotels about +9pt excluding the concert date, and city hotels +5.3 to +8.4pt.
- — Business-hotel weekdays build late: stays on Wednesday, October 28, 2026 rose from 62.6% at 45 days out to 90.0% at 12 days out, +27.4pt — about three times the Saturday gain.
- — In September 2026 actuals, Saturday was the peak day of the week for all four types: ryokan were at 82.3% on Saturday vs 64.3% on Thursday, an 18.0pt gap; business hotels showed a 5.0pt gap between Saturday and Wednesday.
- — September 2026 estimated settled ADR: city hotels +21.9%, business hotels +9.9% (YoY, tax-excluded equivalent; ryokan −4.9%). For November Saturdays, rate capture rather than occupancy becomes the main lever.
Three Checkpoints for Saturday, October 24 — Ryokan Climb from 59.2% to 88.4%; Business Hotels Start at 88.9% and Reach 97.8%
First, look at the nearest Saturday, October 24, at three points: 45 days out (observed September 9), 30 days out (observed September 24) and latest (observed October 16, 8 days out). A large concert was scheduled at the dome stadium in Fukuoka City that day (Reference ①), and a defining feature was that all four types started from high levels at 45 days out. Business hotels moved 88.9%→94.2%→97.8%, adding +5.3pt from 45 to 30 days out and +3.6pt from 30 days out to the latest reading — steadily absorbing the remaining inventory. At the latest reading, the share of properties with no listed inventory visible on OTAs and other channels (sold-out property rate, estimated) reached 64.6%, and remaining inventory had narrowed to 495 of 22,797 rooms.
The ryokan curve has a different shape. At 59.2% at 45 days out, 78.8% at 30 days out and 88.4% at the latest reading, ryokan added +19.6pt from 45 to 30 days out and +9.6pt from 30 days out to the latest reading, for a total gain of 29.2pt — more than three times that of business hotels. City hotels sat in between at 82.7%→89.8%→96.5% (N=24 properties / 3,331 rooms), adding +7.1pt and +6.7pt evenly and approaching business-hotel levels at the latest reading. Resort hotels stayed high at 87.5%→90.9%→95.9% (N=14 properties / 757 rooms), but swings are large because of the small sample — the figure fell to 79.7% the day after the 45-day reading — so these readings should be treated with a margin.
Source: Compiled by HotelBank Editorial Team from MetroEngines Research (Fukuoka Prefecture; stays on October 24, 2026; estimated OCC = based on OTA-listed inventory; observations from 45 to 8 days before the stay date)
The key point is that even on the same Saturday under the same demand event, “when rooms fill” differs by property type. Business and resort hotels had already secured the high-80% range at 45 days out; for this pattern, actions from 30 days out narrow down to how to sell the last few percent of inventory. Ryokan still had 40% of inventory open at 45 days out and follow a pattern of adding close to 20% in the two weeks to 30 days out, so turning cautious based on the 45-day figure alone makes it easy to miss opportunities. For the distribution of property-level inventory depletion for October 24 stays, see our separate analysis, which classifies properties by depletion pattern.
Extending to October 31 and November 7 — The 45→30-Day Gain Holds at +15pt for Ryokan and About +9pt for Business Hotels
To strip out the special factor of the concert date, the next table lines up the following Saturdays, October 31 and November 7, at the same three points. Because the latest reading shares a common observation date (October 16), it represents 15 days out for October 31 stays and 22 days out for November 7 stays.
| Stay date | Type (N = properties / rooms) | 45 days out | 30 days out | Latest (LT) | 45→30 days | 30 days→latest | Remaining (rooms) | Sold-out property rate |
|---|---|---|---|---|---|---|---|---|
| 10/24 (Sat) | Business (178 / 22,797) | 88.9% | 94.2% | 97.8% (8 days) | +5.3pt | +3.6pt | 495 | 64.6% |
| City (24 / 3,331) | 82.7% | 89.8% | 96.5% (8 days) | +7.1pt | +6.7pt | 116 | 45.8% | |
| Ryokan (52 / 952) | 59.2% | 78.8% | 88.4% (8 days) | +19.6pt | +9.6pt | 110 | 44.2% | |
| Resort (14 / 757) | 87.5% | 90.9% | 95.9% (8 days) | +3.4pt | +5.0pt | 31 | 35.7% | |
| 10/31 (Sat) | Business (179 / 22,829) | 73.8% | 82.7% | 91.5% (15 days) | +8.9pt | +8.8pt | 1,933 | 34.6% |
| City (24 / 3,331) | 77.9% | 86.3% | 90.3% (15 days) | +8.4pt | +4.0pt | 324 | 41.7% | |
| Ryokan (52 / 952) | 68.6% | 84.0% | 89.2% (15 days) | +15.4pt | +5.2pt | 103 | 46.2% | |
| Resort (14 / 757) | 80.6% | 91.1% | 94.3% (15 days) | +10.5pt | +3.2pt | 43 | 21.4% | |
| 11/7 (Sat) | Business (179 / 22,829) | 75.1% | 83.9% | 87.8% (22 days) | +8.8pt | +3.9pt | 2,780 | 38.0% |
| City (24 / 3,331) | 80.5% | 85.8% | 87.9% (22 days) | +5.3pt | +2.1pt | 403 | 29.2% | |
| Ryokan (52 / 952) | 71.0% | 86.7% | 91.1% (22 days) | +15.7pt | +4.4pt | 85 | 51.9% | |
| Resort (13 / 742) | 75.3% | 93.5% | 96.2% (22 days) | +18.2pt | +2.7pt | 28 | 46.2% |
Source: Compiled by HotelBank Editorial Team from MetroEngines Research (estimated OCC = based on OTA-listed inventory. Sold-out property rate = share of properties with no listed inventory visible on OTAs and other channels, estimated. Latest reading observed October 16, 2026)
Across the three Saturdays, the 45→30-day gain stays within a roughly constant band for each type. Business hotels added +5.3pt, +8.9pt and +8.8pt — about +9pt once the concert date is excluded — while city hotels were somewhat smaller at +7.1pt, +8.4pt and +5.3pt. Ryokan added +19.6pt, +15.4pt and +15.7pt, at least +15pt in all three weeks, showing that the two weeks from 45 to 30 days out are the biggest booking window for ryokan. Resort hotels varied widely at +3.4pt, +10.5pt and +18.2pt, but this reflects the small sample (13–14 properties), in which a change in a single property’s listed inventory shows up directly in the figures, so we refrain from describing it as a trend.
In the stretch from 30 days out to the latest reading, the order flips. For October 31 stays, business hotels added +8.8pt, from 82.7% at 30 days out to 91.5% at 15 days out, outpacing ryokan (+5.2pt) and city hotels (+4.0pt) over the same stretch. Business-hotel Saturdays gain little when the 45-day level is high, but keep growing after 30 days out when the 45-day level is in the 70% range — a pattern that could be described as “picking up the unfilled rooms close in.” Remaining inventory at the latest reading also shows business hotels with the largest absolute numbers, 1,933 rooms for October 31 stays and 2,780 rooms for November 7 stays, making them the type with the most room to sell over the remaining two to three weeks.
Weekday Comparison — Business-Hotel Wednesdays Go from 62.6% at 45 Days Out to 90.0% Close In, Three Times the Saturday Gain
Saturday patterns split by property type — but what about weekdays? Lining up Wednesday, October 28 and Wednesday, November 11 at the same three points, the business-hotel weekday curve looks completely different from Saturday. For October 28 stays, business hotels were at 62.6% at 45 days out, 71.1% at 30 days out and 90.0% at the latest reading (12 days out), adding 27.4pt from 45 days out. Compared with the same type on Saturday, October 24, which moved only 8.9pt from 88.9% at 45 days out to 97.8% at the latest reading, the weekday gain is three times larger. At 12 days out, the gap to Saturday had narrowed to 7.4pt (97.4% vs 90.0%), showing that business-hotel weekday demand concentrates in the final two weeks.
| Stay date | Type (N = properties / rooms) | 45 days out | 30 days out | Latest (LT) | 45 days→latest | Remaining (rooms) |
|---|---|---|---|---|---|---|
| 10/28 (Wed) | Business (179 / 22,829) | 62.6% | 71.1% | 90.0% (12 days) | +27.4pt | 2,275 |
| City (24 / 3,331) | 75.0% | 80.6% | 87.6% (12 days) | +12.6pt | 414 | |
| Ryokan (52 / 952) | 53.4% | 64.2% | 75.6% (12 days) | +22.2pt | 232 | |
| Resort (14 / 757) | 60.0% | 69.3% | 77.5% (12 days) | +17.5pt | 170 | |
| 11/11 (Wed) | Business (179 / 22,829) | 61.8% | 70.9% | 74.2% (26 days) | +12.4pt | 5,889 |
| City (24 / 3,331) | 70.4% | 78.4% | 80.2% (26 days) | +9.8pt | 659 | |
| Ryokan (52 / 952) | 60.5% | 73.0% | 74.3% (26 days) | +13.8pt | 245 | |
| Resort (13 / 742) | 66.3% | 75.6% | 75.1% (26 days) | +8.8pt | 185 |
Source: Compiled by HotelBank Editorial Team from MetroEngines Research (estimated OCC = based on OTA-listed inventory. Latest reading observed October 16, 2026)
What this comparison shows is a two-tier structure for business hotels: “Saturdays fill early, weekdays fill late.” Saturdays are already in the mid-70% to near-90% range at 45 days out, while Wednesdays stay in the low 60s at 45 days out and around 70% even at 30 days out, selling the last 30% of inventory in the final four weeks. November 11 stays were at 74.2% at 26 days out with a large 5,889 rooms remaining; whether progress from here follows the same trajectory as October 28 stays is the key read for November weekdays. Ryokan added +22.2pt from 45 days out to the latest reading even on a Wednesday, confirming they are a type that builds late regardless of day of week. For a case that reads the 45-day snapshot of Fukuoka business and city hotels through the skew of weekend demand, see also Hakozakigu Hojoya 2026: Fukuoka Demand Peaks Opening Weekend.
Day-of-Week Pattern in September Actuals — Saturday Peaks for All Four Types; Ryokan Open an 18pt Gap with Thursday at 64.3%
As a baseline for reading forward curves, the next chart averages daily actuals (estimated OCC, based on OTA-listed inventory) for the completed month of September 2026 by day of week. Note that September included a five-day holiday stretch on the 19th–23rd, which pushes up the Monday and Tuesday averages somewhat. Even so, Saturday was the week’s highest day for all four types: business hotels 92.8% (N=175–181 properties), city hotels 92.8% (N=21–25 properties), ryokan 82.3% (N=47–57 properties) and resort hotels 86.1% (N=11–14 properties).
Source: Compiled by HotelBank Editorial Team from MetroEngines Research (Fukuoka Prefecture; daily estimated OCC for September 2026 (based on OTA-listed inventory) averaged by day of week. Monthly averages: business 90.0%, city 87.1%, ryokan 72.6%, resort 77.8%)
What stands out is the gap between Saturday and the week’s lowest day. Business hotels were at 92.8% on Saturday vs 87.8% on Wednesday, a gap of just 5.0pt, and city hotels 92.8% on Saturday vs 83.8% on Wednesday, only 9.0pt. Ryokan, by contrast, showed an 18.0pt spread, 82.3% on Saturday vs 64.3% on Thursday, and resort hotels a 12.3pt gap, 86.1% on Saturday vs 73.8% on Friday. In other words, ryokan and resorts are types that “earn on Saturday and sit empty on weekdays,” and a weekend curve that fails to rise early directly affects revenue for the whole week. The level gap in September monthly averages — business hotels 90.0% and city hotels 87.1% vs ryokan 72.6% and resorts 77.8% — can be understood as the accumulation of this day-of-week disparity.
Saturdays from Mid-November and Estimated Settled ADR — 11/14 Is Above 87% for All Four Types at 45 Days Out; September Settled Rates Show City Hotels +21.9%
So how do November Saturdays look? Saturday, November 14 has a two-day concert scheduled at the dome stadium in Fukuoka City (Reference ②). At 45 days out, all four types started above 87% — business 91.2%, city 93.5%, ryokan 87.5%, resort 91.1% — and at the latest reading (29 days out) had reached business 95.8% (961 rooms remaining), city 95.8% (141 rooms remaining), ryokan 96.7% (31 rooms remaining) and resort 96.1% (29 rooms remaining). Saturday, November 21 is the first day of a three-day weekend running through Monday the 23rd (national holiday); at 36 days out, ryokan were at 98.5% (14 rooms remaining), resorts 95.4%, business hotels 90.5% and city hotels 90.0% — an unusual pattern in which ryokan lead. Saturday, November 28 also has a two-day concert at the same venue (Reference ③); at 43 days out, business hotels were at 89.7%, city 90.3%, ryokan 85.0% (N=51 properties / 948 rooms) and resort 93.0%, already close to the 30-day levels of the October Saturdays.
Now the rate side. Comparing completed months on monthly estimated settled ADR (tax-excluded equivalent), business hotels in September 2026 were at ¥10,958 (N=342 properties), +9.9% from ¥9,972 (N=331 properties) a year earlier, and city hotels at ¥18,547 (N=43 properties), +21.9% from ¥15,212 (N=37 properties) — rates for both urban types clearly exceeded the prior year. Ryokan were at ¥12,262 (N=72 properties), −4.9% from ¥12,900 (N=74 properties), and resort hotels at ¥16,585 (N=14 properties), +18.7% from ¥13,967 (N=13 properties). October and November are estimates based on current sales: business hotels ¥14,533 (October, N=337 properties) and ¥14,796 (November, N=336 properties), city hotels ¥21,367 (October, N=43 properties) and ¥23,484 (November, N=42 properties) — higher than the September settled figures — but these can shift with sales through month-end, so a direct comparison with the prior year’s settled figures should wait for the month to close.
| Type | Sep 2025 settled | Sep 2026 settled | YoY | Oct 2026 current estimate | Nov 2026 current estimate |
|---|---|---|---|---|---|
| Business hotels | ¥9,972 (N=331) | ¥10,958 (N=342) | +9.9% | ¥14,533 (N=337) | ¥14,796 (N=336) |
| City hotels | ¥15,212 (N=37) | ¥18,547 (N=43) | +21.9% | ¥21,367 (N=43) | ¥23,484 (N=42) |
| Ryokan | ¥12,900 (N=74) | ¥12,262 (N=72) | −4.9% | ¥13,040 (N=72) | ¥13,409 (N=71) |
| Resort hotels | ¥13,967 (N=13) | ¥16,585 (N=14) | +18.7% | ¥19,378 (N=15) | ¥19,241 (N=15) |
Source: Compiled by HotelBank Editorial Team from MetroEngines Research (estimated settled ADR, tax-excluded equivalent. October and November are estimates based on current sales and may change)
Source: Compiled by HotelBank Editorial Team from MetroEngines Research (Fukuoka Prefecture; estimated settled ADR, tax-excluded equivalent. Solid line = settled figures; dashed line = estimates based on current sales)
Viewed year over year, business hotels have exceeded the prior-year month in every month from January to September 2026, and city hotels have also topped the prior year in most months, including June and September. November was the annual peak month for both types last year (business ¥12,368, city ¥20,829), and current 2026 estimates follow the same pattern. Since this is a month where the curve-side fact that “November Saturdays are high from 45 days out” overlaps with the rate-side fact that “November is the annual peak,” the focus of selling remaining inventory shifts from adding occupancy to capturing rate. For how YoY on a settled-month basis has diverged by property type, Fukuoka ADR Splits: City +6.2%, Business +2.2% tracks January–August 2026.
For Revenue Managers Running Business, City, Ryokan and Resort Properties in Fukuoka Prefecture — Implications and Action Plan
Operational Insights
1. Read your 45-day figure against the pattern for your property type. On Fukuoka Prefecture Saturdays, business and resort hotels start in the mid-70% to high-80% range at 45 days out, while ryokan start around 60% and add +15pt or more by 30 days out. If a ryokan is at the market-level 59–71% at 45 days out, it is on a normal trajectory, not lagging. Conversely, if a business hotel is well below the market’s 73.8–75.1% (10/31, 11/7) at 45 days out, consider actions to close the gap in the two weeks to 30 days out.
2. At 30 days out, switch decisions based on the absolute number of remaining rooms. The Saturday gain from 30 days out to the latest reading — business +3.6 to +8.8pt, city +2.1 to +6.7pt, ryokan +4.4 to +9.6pt — is smaller than the 45→30-day gain. A practical approach is to count how many rooms separate you at 30 days out from the market’s endpoint (latest reading: business 87.8–97.8%, ryokan 88.4–91.1%), and decide whether to hold rate or chase occupancy depending on whether that number can be filled by an average close-in two-week gain.
3. Business hotels build late on weekdays. Stays on Wednesday, October 28 rose +27.4pt from 62.6% at 45 days out to 90.0% at 12 days out. Even when weekday occupancy is in the 60s at 45 days out, the market adds close to 30% from there in the final stretch. Selling weekdays early with the same mindset as fast-filling Saturdays tends to leave rate on the table.
4. November is a rate month, not an occupancy month. The Saturdays of November 14, 21 and 28 start at around 85% or higher for all four types at 45 days out, and monthly estimated settled ADR peaked for the year last November at ¥12,368 for business hotels and ¥20,829 for city hotels. The fewer rooms remain on a date, the more revenue is decided by how rate is captured rather than by adding occupancy. For how to capture weekday rates in November, Sumo Kyushu Basho 2026: How Far Can Fukuoka Weekday Rates Go? examines the gap between last year’s results and current listed prices.
| Time horizon | Action | Decision trigger tied to article figures | Objective |
|---|---|---|---|
| Today–this week (10/24, 10/31 stays) | Take stock of remaining inventory in rooms and set the sales allocation for the final two weeks | If your 10/24 stays have not reached the market’s latest level (business 97.8%, city 96.5%, ryokan 88.4%) | Sell out remaining concert-date inventory without cutting rate |
| Today–this week (weekdays such as 10/28 stays) | Hold back early selling in the final two weeks of weekdays and review pricing in steps | If your Wednesday stays are around the market’s 30-day level (business 71.1%, city 80.6%) and following the market pattern of +18.9pt over the final 12 days | Capture late weekday demand at rate |
| Within two weeks (11/7 stays) | Check the 30-day position against remaining inventory and decide between holding rate and prioritizing occupancy | If your 11/7 stays are 5pt or more below the market’s 22-day level (business 87.8%, city 87.9%, ryokan 91.1%) | Avoid leakage in a stretch where close-in gains are small |
| Within two weeks (11/14 stays) | Release remaining concert-date inventory starting from the higher rate tiers | If the market is at 95.8–96.7% for all four types at 29 days out and your remaining inventory is small | Capture full rate on dates with certain demand |
| Toward next month (11/21, 11/28 stays) | Compare your 45-day ramp-up with the market and look for room to raise early pricing | If your 45-day level is equal to or above the market (11/21 stays: business 85.3%, ryokan 94.5%; 11/28 stays: business 89.3%, city 88.9%) | Win the peak month’s Saturdays on rate |
| Toward next month (ryokan, resorts) | Record the 45→30-day gain on weekend curves weekly to understand your own pattern | If, in a stretch where market ryokan added +15pt or more three weeks running, your property keeps falling short of +10pt | Detect weekend leakage early in Saturday-dependent types |
Source: Compiled by HotelBank Editorial Team (decision-trigger figures are market values from this article)
Summary — Measure Inventory Management by Property Type at Three Points: 45-Day Ramp-Up, 30-Day Remaining Inventory and Close-In Gain
To sum up, the pattern of each property type on Fukuoka Prefecture’s Saturday booking curves is defined by three points. First, the ramp-up at 45 days out: business hotels (73.8–91.2%) and resorts (75.3–92.9%) are high, while ryokan (59.2–71.0%, excluding November holiday and concert dates) are low. Second, the gain from 45 to 30 days out: there are bands by type — ryokan +15pt or more three weeks running, business hotels about +9pt, city hotels +5–8pt. Third, the gain from 30 days out to close-in: the range narrows to +2–10pt for all types, and from here it becomes a question of combining remaining room count and rate. Mapping your own curve onto these three points and comparing it with the market bands to pinpoint “in which stretch you are behind” is likely the starting point for inventory management by property type.
Frequently Asked Questions
Q. How full were Saturdays in Fukuoka Prefecture, and how many days before the stay date?
A. For stays on Saturday, October 24, 2026, estimated OCC (based on OTA-listed inventory) at 45 days out was 88.9% for business hotels, 82.7% for city hotels, 87.5% for resort hotels and 59.2% for ryokan. By the latest reading (8 days out), it had reached 97.8% for business, 96.5% for city, 95.9% for resort and 88.4% for ryokan.
Q. Does a low 45-day figure for a ryokan mean it is lagging?
A. If it is at market level, it is on a normal trajectory. Across the three Saturdays of October 24, October 31 and November 7, 2026, ryokan added +15.4 to +19.6pt from 45 to 30 days out; a ryokan at 59–71% at 45 days out is following the same pattern as the market.
Q. Do business hotels book differently on weekdays and Saturdays?
A. Yes. Stays on Wednesday, October 28, 2026 added +27.4pt, from 62.6% at 45 days out to 90.0% at 12 days out — about three times the +8.9pt gain from 45 days out to the latest reading for stays on Saturday, October 24. Because weekday demand concentrates in the final two weeks, selling early with the same mindset as Saturdays tends to leave rate on the table.
Q. Is estimated OCC the same as actual room occupancy?
A. No. It is an estimate calculated from OTA-listed remaining rooms and total rooms, covering properties that list at least 30% of their total rooms on OTAs. Because rooms not listed are counted as sold, it runs higher than actual room occupancy. See “About the Data” at the end of the article for definitions.
About the Data
| Definition of estimated OCC (based on OTA-listed inventory) | OTA-listed-inventory occupancy = 100 − 100 × OTA-listed remaining rooms ÷ total rooms. Covers a fixed cohort of properties that list at least 30% of their total rooms on OTAs (the same set of properties for each stay date; N in the tables is that number of properties). It is an estimate based on how inventory sold on OTAs is being absorbed, and its definition differs from actual room occupancy (it runs higher because unlisted rooms are counted as sold). Periods covered: September 2026 (completed-month actuals) and each stay date from October 24 to November 28, 2026 (booking-pace snapshots). |
| Booking curve | Based on observations from 45 days before the stay date to the latest available. The fixed checkpoints are 45 days out, 30 days out and latest (observed October 16, 2026). |
| Estimated settled ADR | The settled price level (tax-excluded equivalent) estimated from OTA and other sales data (lowest plan level × property-type factor, ensemble across multiple channels). Past months are settled figures; current and future months are estimates based on current sales. Median error of 6.6% when checked against published operating results. |
| Breakdown of N | Booking curves: business hotels 178–179 properties / 22,797–22,829 rooms, city hotels 24 properties / 3,331 rooms, ryokan 51–52 properties / 948–952 rooms, resort hotels 13–14 properties / 742–757 rooms (varies by stay date; based on listings on major booking sites). September actuals: business 175–181 properties, city 21–25, ryokan 47–57, resort 11–14 (varies by day). Estimated settled ADR: N for each month is shown in the table. |
| Sold-out property rate | Share of properties with no listed inventory visible on OTAs and other channels (estimated). |
| Data as of | Data as of: October 17, 2026. Sales and inventory change daily, so the figures in this article are a snapshot at the time of retrieval. |
References and Sources
■ Data sources
OTA-listed inventory and published price data compiled by MetroEngines Research (lodging properties in Fukuoka Prefecture; four types: business hotels, city hotels, ryokan and resort hotels). Estimated OCC uses booking-pace snapshots for stays from October 24 to November 28, 2026 (observed September 9 to October 16, 2026) and daily actuals for September 2026; estimated settled ADR uses monthly aggregates for 2025–2026. Concert dates are from the event information in ①–④ below.
■ Calculation assumptions
Fixed checkpoints are 45 days out, 30 days out and latest (as observed on October 16, 2026; 8–43 days out depending on stay date); observations earlier than 45 days out are not used. N for each stay date is the number of covered properties for that date. Monthly estimated settled ADR is the median of estimated settled rates by property type; October and November 2026 are estimates based on current sales.
■ Limitations and caveats
Estimated OCC is based on OTA-listed inventory; its definition differs from actual room occupancy and it runs higher. Resort hotels are a small sample of 13–14 properties, so changes in a single property’s listed inventory readily show up in the figures. September 2026 included a five-day holiday stretch on the 19th–23rd, which affects day-of-week averages. Estimated settled ADR for October and November may change with sales through month-end.
① Stray Kids at Mizuho PayPay Dome Fukuoka, Saturday October 24, 2026 — concert information (live event information)
② Fujii Kaze at Mizuho PayPay Dome Fukuoka, Saturday November 14 – Sunday November 15, 2026 — concert information (live event information)
③ YOASOBI at Mizuho PayPay Dome Fukuoka, Saturday November 28 – Sunday November 29, 2026 — concert information (live event information)
④ YOASOBI announces 10-venue dome and stadium tour (Real Sound, December 2025)
Related article: Fukuoka Oct 24: 48.9% Sold Out at 14 Days Out, Median 1.1% Left — Splitting Inventory Depletion Patterns Across 88 Properties
Related Articles
- Fukuoka Oct 24: 48.9% Sold Out at 14 Days Out, Median 1.1% Left
- Fukuoka ADR Splits: City +6.2%, Business +2.2% — Estimated Settled ADR YoY for January–August 2026
- Hakozakigu Hojoya 2026: Fukuoka Demand Peaks Opening Weekend — Business and City Hotels at the 45-Day Snapshot
- Sumo Kyushu Basho 2026: How Far Can Fukuoka Weekday Rates Go? — +9.7% Last Year vs +3.3% in Current Listings
- Kumamoto Oct Long Weekend: Business Hotel Day 2 Trails Day 1 by 7.3pt — Booking Curves by Type vs City Hotels and Ryokan
- Kagawa Oct 3-Day Weekend: Ryokan 90% Full at T-45, Business +19pt Late — Timing Pricing with Booking Curves by Type
- Miyagi City vs Business Hotels: 29.5pt T-45 OCC Gap Narrows to 4.7pt