

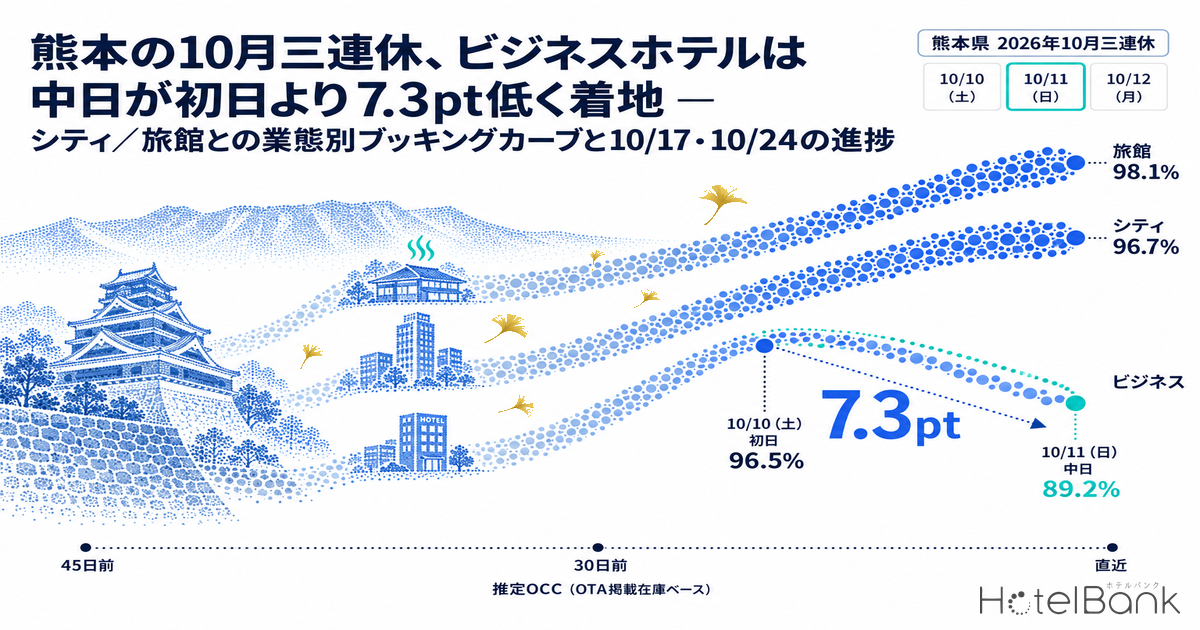
HotelBank Editorial Team tracked estimated OCC (OTA-listed inventory basis) across three property types (city hotels, business hotels and ryokan) for Kumamoto Prefecture’s October 2026 three-day weekend (October 10–12). On Day 1, Saturday October 10, all three types finished above 96% on the night before arrival. On Day 2, Sunday October 11, business hotels alone stopped at 89.2% (N=56 properties, 7,035 rooms), 7.3pt below their Day 1 finish of 96.5%. City hotels (N=11 properties, 1,255 rooms) were running 9.3pt behind Day 1 at 30 days out, but caught up to 96.7% by the night before, narrowing the gap to 1.1pt. Ryokan (N=142–143 properties, about 2,670 rooms) filled to the 98% range on both nights. This article compares the three booking curves at three checkpoints (45 days out, 30 days out and the latest observation), adds progress snapshots for October 17 and 24, the regular Saturdays after the holiday, and turns the findings into last-minute revenue management actions for each property type.
Coverage: Kumamoto Prefecture city hotels N=11–12 properties (1,255–1,315 rooms), business hotels N=55–56 properties (7,024–7,035 rooms), ryokan N=142–143 properties (2,667–2,680 rooms). Each is a fixed cohort based on listings on major booking sites, and the property count varies slightly by stay date. Prices in this article are estimated settled ADR (the settled price level estimated from OTA and other sales data, tax-excluded equivalent); occupancy is an estimate based on OTA-listed inventory. Definitions are at the end of the article. Data as of October 13, 2026.
- — Day 1 (10/10) finished above 96% for all three types. The 13.5pt spread at 45 days out was only a difference in when rooms filled (city 97.8%, ryokan 98.4%, business 96.5%).
- — Day 2 (10/11): only business hotels stopped at 89.2% (N=56 properties, 7,035 rooms). Their 6.3pt gap to Day 1 at 30 days out carried through to a 7.3pt gap at the finish, while city hotels closed theirs from 9.3pt to 1.1pt.
- — The Day 2 dip is nationwide: the median Day 1 − Day 2 gap for business hotels across all 47 prefectures was 5.3pt. Kumamoto’s 7.3pt ranks 11th largest, and third in Kyushu after Oita and Kagoshima (7.7pt each).
- — The regular Saturdays after the holiday (10/17, 10/24) started high at 45 days out and added little after that. Ryokan on 10/17 were at 94.8% at 30 days out and flat at 94.1% five days out.
- — Settled estimated ADR for September 2026: business +20.0%, city +12.0% year on year. For a 100-room business hotel, filling Day 2 to the Day 1 level would add an estimated ¥50,000–¥77,000 per night (tax-excluded equivalent).
Day 1 of the Long Weekend (10/10): All Three Types Above 96% the Night Before; Only the Timing Differed
Start with Day 1, October 10. At 45 days out, city hotels were at 76.0%, ryokan at 74.2% and business hotels at 62.5%, a 13.5pt spread across the three types. By 30 days out city hotels had jumped to 92.8% (+16.8pt), followed by ryokan at 87.6% (+13.4pt) and business hotels at 76.2% (+13.7pt). The gains were roughly equal, so the starting gap stayed in place. In the 30 days from there to the night before arrival, business hotels gained the most, +20.3pt, reaching 96.5%, while ryokan finished at 98.4% and city hotels at 97.8%. For Day 1, the three types differed only in when they filled; where they ended up was almost the same.
By curve shape, city hotels stepped up from 84.5% to 90.9% to 93.1% between 38 and 36 days out, then moved in the 92–97% range through 30 days out. Business hotels rose almost steadily from 45 days out to the night before, with small pullbacks of about 1pt, adding 2–5pt at each milestone: 85.3% at 25 days out, 90.0% at 10 days and 93.8% at 3 days. Ryokan stepped up from 91.0% at 26 days out to 94.9% at 25 days, moved in the 93–96% range, then filled out over the final three days, 96.5% → 97.3% → 98.4%. City hotels are a small sample (N=11 properties), and one property adding or pulling inventory can move the figure by several points.
Source: Compiled by HotelBank Editorial Team from MetroEngines Research
Day 2 of the Long Weekend (10/11): Business Hotels Flat Around 78% for Two Weeks, Finishing at 89.2%
On Day 2, October 11, the differences between property types lasted to the end. The starting points at 45 days out were city 78.0%, ryokan 70.3% and business 58.0%. Compared with Day 1, city hotels actually started higher, while ryokan started 3.9pt lower and business hotels 4.5pt lower. At 30 days out the figures were city 83.5%, ryokan 84.4% and business 69.9%, so city hotels added only +5.5pt over this stretch. Since they added +16.8pt over the same period for Day 1, city hotels were 9.3pt behind Day 1 at 30 days out.
After that, the three types went separate ways. City hotels jumped nearly 8pt from 86.6% at 27 days out to 94.1% at 26 days out, reached 96.7% by the night before, and narrowed the gap to Day 1 to 1.1pt. Ryokan also rose at 26 days out, from 86.9% to 91.8%, and finished at 98.1% the night before, level with Day 1 (98.4%). Business hotels, by contrast, stayed almost flat for more than two weeks, from 78.8% at 26 days out to 79.2% at 10 days out. They added +10.0pt in the final 10 days but finished at only 89.2%. The 7.3pt gap to Day 1’s 96.5% is essentially the gap that was already open at 30 days out (6.3pt). Whether a business–city gap reflects a slow start or simply faster sell-through is a question that comes up in other prefectures’ October long-weekend curves as well.
Source: Compiled by HotelBank Editorial Team from MetroEngines Research
The table below lists the three checkpoints (45 days out, 30 days out and the latest observation) by property type for four stay dates. For October 10 and 11 the latest observation is the night before arrival (1 day out); for October 17 it is 5 days out, and for October 24 it is 12 days out.
| Stay date | Type | Coverage | 45 days out | 30 days out | Latest | 45→30 days | 30 days→latest |
|---|---|---|---|---|---|---|---|
| Oct 10 (Sat, Day 1) | City | 11 properties / 1,255 rooms | 76.0% | 92.8% | 97.8% (1 day out) | +16.8pt | +5.0pt |
| Oct 10 (Sat, Day 1) | Business | 56 properties / 7,035 rooms | 62.5% | 76.2% | 96.5% (1 day out) | +13.7pt | +20.3pt |
| Oct 10 (Sat, Day 1) | Ryokan | 143 properties / 2,678 rooms | 74.2% | 87.6% | 98.4% (1 day out) | +13.4pt | +10.8pt |
| Oct 11 (Sun, Day 2) | City | 11 properties / 1,255 rooms | 78.0% | 83.5% | 96.7% (1 day out) | +5.5pt | +13.2pt |
| Oct 11 (Sun, Day 2) | Business | 56 properties / 7,035 rooms | 58.0% | 69.9% | 89.2% (1 day out) | +11.9pt | +19.3pt |
| Oct 11 (Sun, Day 2) | Ryokan | 142 properties / 2,667 rooms | 70.3% | 84.4% | 98.1% (1 day out) | +14.1pt | +13.7pt |
| Oct 17 (Sat) | City | 12 properties / 1,315 rooms | 88.7% | 93.6% | 94.0% (5 days out) | +4.9pt | +0.4pt |
| Oct 17 (Sat) | Business | 55 properties / 7,024 rooms | 74.5% | 84.1% | 89.1% (5 days out) | +9.6pt | +5.0pt |
| Oct 17 (Sat) | Ryokan | 142 properties / 2,680 rooms | 78.7% | 94.8% | 94.1% (5 days out) | +16.1pt | −0.7pt |
| Oct 24 (Sat) | City | 12 properties / 1,315 rooms | 86.9% | 94.9% | 97.4% (12 days out) | +8.0pt | +2.5pt |
| Oct 24 (Sat) | Business | 56 properties / 7,035 rooms | 67.4% | 82.4% | 90.2% (12 days out) | +15.0pt | +7.8pt |
| Oct 24 (Sat) | Ryokan | 143 properties / 2,669 rooms | 82.3% | 92.3% | 93.7% (12 days out) | +10.0pt | +1.4pt |
Estimated OCC (OTA-listed inventory basis). Fixed cohorts based on listings on major booking sites. Source: Compiled by HotelBank Editorial Team from MetroEngines Research
Set against September results, the business-hotel Day 2 finish looks more like a strong Sunday than a holiday night. Estimated OCC on September’s regular Sundays (the 6th, 13th and 27th) was 78.1%, 80.2% and 89.5% (N=59–60 properties), so October 11’s 89.2% sits at the top of that range. In the first three days of September’s five-day holiday (Sept 19–23, covering Respect for the Aged Day, a national bridge holiday and the Autumnal Equinox), business hotels were at 94.7% on Saturday the 19th, 99.5% on Sunday the 20th and 98.4% on Monday the 21st (a national holiday) (N=59–61 properties), with the second-day Sunday the highest. In September, with more days off still to come, demand concentrated on Sunday; in October, when the holiday ended after three days, it shifted to Day 1. Of the three types, business hotels show this difference most clearly. City hotels and ryokan finished at 96% or higher on both Saturday and Sunday in both the September and October holidays, so their fill pattern held steady whatever the holiday’s length. Kumamoto’s day-of-week structure, where business hotels peak on Thursdays and Saturdays while ryokan concentrate on Saturdays, is covered in Kumamoto Day-of-Week Occupancy Inverts by Property Type.
| Type | 9/19 (Sat, Day 1) | 9/20 (Sun, Day 2) | 9/21 (Mon, holiday) | 10/10 (Sat, Day 1) | 10/11 (Sun, Day 2) |
|---|---|---|---|---|---|
| City | 97.0% (N=14) | 99.9% (N=14) | 99.3% (N=14) | 97.8% (N=11) | 96.7% (N=11) |
| Business | 94.7% (N=61) | 99.5% (N=61) | 98.4% (N=59) | 96.5% (N=56) | 89.2% (N=56) |
| Ryokan | 97.7% (N=172) | 99.7% (N=168) | 99.7% (N=167) | 98.4% (N=143) | 98.1% (N=142) |
Estimated OCC (OTA-listed inventory basis) as of the night before arrival. N is the number of properties covered for each stay date. Source: Compiled by HotelBank Editorial Team from MetroEngines Research
Comparison with Other Prefectures: The Day 2 Dip Is Nationwide; Kumamoto’s 7.3pt Is Third-Largest in Kyushu
Kumamoto is not the only prefecture where business hotels finished Day 2 below Day 1. Comparing Day 1 and Day 2 of the same long weekend using each prefecture’s fixed business-hotel cohort, all at the night before arrival (1 day out) on estimated OCC (OTA-listed inventory basis), Day 2 came in below Day 1 in all 47 prefectures. The median gap was 5.3pt (Day 1 98.2%, Day 2 92.2%). Kumamoto’s 7.3pt is the 11th largest of the 47, and in Kyushu’s seven prefectures it trails only Oita and Kagoshima (7.7pt each). Fukuoka (5.8pt), Nagasaki (5.0pt), Saga (4.9pt) and Miyazaki (3.9pt) all had smaller gaps than Kumamoto.
A weak Day 2 is therefore the nationwide shape of the October long weekend, and what sets Kumamoto’s business hotels apart is the size of the gap. Their Day 2 finish of 89.2% was 3.0pt below the national median (92.2%), and their Day 1 finish of 96.5% was 1.7pt below the national median (98.2%). Because the gap to the rest of Japan is wider on Day 2 than on Day 1, Kumamoto business hotels have reason to plan Day 2 separately.
| Prefecture | Coverage | 10/10 (Sat, Day 1) | 10/11 (Sun, Day 2) | Day 1 − Day 2 |
|---|---|---|---|---|
| Fukuoka | 177–178 properties / 22,667–22,679 rooms | 98.0% | 92.2% | 5.8pt |
| Saga | 19 properties / 1,929 rooms | 96.0% | 91.1% | 4.9pt |
| Nagasaki | 58 properties / 4,581 rooms | 90.2% | 85.2% | 5.0pt |
| Kumamoto | 56 properties / 7,035 rooms | 96.5% | 89.2% | 7.3pt |
| Oita | 40 properties / 3,844 rooms | 97.6% | 89.9% | 7.7pt |
| Miyazaki | 42 properties / 4,014 rooms | 94.4% | 90.5% | 3.9pt |
| Kagoshima | 71 properties / 5,892 rooms | 96.0% | 88.3% | 7.7pt |
| Japan (median of 47 prefectures) | — | 98.2% | 92.2% | 5.3pt |
Estimated OCC (OTA-listed inventory basis). Fixed business-hotel cohort for each prefecture, as of the night before arrival (1 day out). The national figure is the median of the 47 prefecture values (not room-weighted). Source: Compiled by HotelBank Editorial Team from MetroEngines Research
10/17 and 10/24: Regular Saturdays After the Holiday Start High at 45 Days Out and Add Little
October 17 and 24, the regular Saturdays after the holiday, follow the opposite pattern to the long weekend: a high starting point at 45 days out and small gains after that. For the 17th, city hotels went 88.7% → 93.6% → 94.0% (45 days out → 30 days out → latest at 5 days out; N=12 properties, 1,315 rooms), business hotels 74.5% → 84.1% → 89.1% (N=55 properties, 7,024 rooms) and ryokan 78.7% → 94.8% → 94.1% (N=142 properties, 2,680 rooms). Gains from 30 days out to the latest observation were small: city +0.4pt, business +5.0pt and ryokan −0.7pt. Ryokan jumped 8.1pt from 85.2% at 33 days out to 93.3% at 32 days out, then held around 94%, so they had essentially finished filling by 30 days out.
For the 24th the latest observation is 12 days out: city 86.9% → 94.9% → 97.4% (N=12 properties, 1,315 rooms), business 67.4% → 82.4% → 90.2% (N=56 properties, 7,035 rooms) and ryokan 82.3% → 92.3% → 93.7% (N=143 properties, 2,669 rooms). At 12 days out, city and business hotels were already above their latest figures for the 17th (94.0% and 89.1%); ryokan were slightly below the 17th’s 94.1%. Business hotels gained +15.0pt between 45 and 30 days out, a faster build than Day 1 of the long weekend over the same period (+13.7pt), which suggests late-October Saturdays fill early. Business hotels on the 17th were at 89.1% five days out, 3.2pt below October 10 at the same point (92.3%), which is a useful gauge of how much room is left to fill in the remaining days.
Source: Compiled by HotelBank Editorial Team from MetroEngines Research
Pricing Context: Settled Estimated ADR for September Up 20.0% at Business Hotels and 12.0% at City Hotels
First, the settled figures on pricing. Kumamoto Prefecture’s estimated settled ADR (tax-excluded equivalent) for the latest settled month, September 2026, was ¥10,900 for city hotels (N=19 properties), ¥8,200 for business hotels (N=122 properties) and ¥16,900 for ryokan (N=237 properties). Against the settled figures a year earlier, city hotels rose +12.0% from ¥9,700 and business hotels +20.0% from ¥6,800, both double-digit increases, while ryokan were almost flat at +0.6% from ¥16,800. The settled figures for October last year were ¥10,400 for city hotels (N=18 properties), ¥6,900 for business hotels (N=115 properties) and ¥16,800 for ryokan (N=221 properties); these are the prior-year yardstick for October rates. The current estimates for October 2026 are ¥14,200 for city hotels, ¥10,600 for business hotels and ¥18,200 for ryokan. Because these are based on sales so far and may change until the month settles, a straight comparison with last year’s settled figures has to wait until then. Over the past two years Kumamoto business hotels have absorbed a wave of new supply (about 1,619 new rooms), which is the backdrop to these rate gains.
| Type | Sep 2025 (settled) | Sep 2026 (settled) | YoY | Oct 2025 (settled) | Oct 2026 (current estimate) |
|---|---|---|---|---|---|
| City | ¥9,702 (N=19) | ¥10,870 (N=19) | +12.0% | ¥10,362 (N=18) | ¥14,245 (N=19)* |
| Business | ¥6,849 (N=115) | ¥8,220 (N=122) | +20.0% | ¥6,911 (N=115) | ¥10,603 (N=121)* |
| Ryokan | ¥16,828 (N=223) | ¥16,937 (N=237) | +0.6% | ¥16,810 (N=221) | ¥18,210 (N=233)* |
Estimated settled ADR (tax-excluded equivalent). *October 2026 is an estimate based on current sales and may change until the month settles. Source: Compiled by HotelBank Editorial Team from MetroEngines Research
To sum up: in Kumamoto, one property type left rooms unsold on Day 2 while the others filled above 96% over the long weekend, and on top of that, September’s settled rates for business and city hotels were up by double digits year on year. Rates are holding on the nights that fill. For the next long weekend, the question is not whether rooms will fill but how to sell Day 1 and Day 2 separately.
Sensitivity Analysis: Room Revenue from Lifting the Day 2 Finish (per 100 Rooms)
To put a yen figure on the unsold Day 2 rooms, we modeled a 100-room business hotel. The baseline is the market’s Day 2 finish (estimated OCC 89.2% as of the night before arrival). We raised it to 91.0%, 93.0%, 95.0% and the Day 1 level of 96.5%, and multiplied the extra rooms sold per night by three rates: the estimated settled ADR for Kumamoto business hotels for October 2025 (settled), September 2026 (settled) and October 2026 (current estimate).
| Rate (estimated settled ADR) | 91.0% | 93.0% | 95.0% | 96.5% (Day 1 level) |
|---|---|---|---|---|
| ¥6,911 (Oct 2025, settled) | ¥12,400 | ¥26,300 | ¥40,100 | ¥50,500 |
| ¥8,220 (Sep 2026, settled) | ¥14,800 | ¥31,200 | ¥47,700 | ¥60,000 |
| ¥10,603 (Oct 2026, current estimate) | ¥19,100 | ¥40,300 | ¥61,500 | ¥77,400 |
| (Additional rooms sold / 100 rooms) | +1.8 rooms | +3.8 rooms | +5.8 rooms | +7.3 rooms |
Additional room revenue = (finishing OCC − 89.2%) × 100 rooms × rate, rounded to the nearest ¥100. A simple estimate that assumes the additional rooms sell at the same rate; it does not account for rate cuts used to fill rooms or for distribution commissions. Source: Compiled by HotelBank Editorial Team from MetroEngines Research
At September 2026’s settled ¥8,220, filling Day 2 to the Day 1 level of 96.5% would add about ¥60,000 per night, and even reaching 93.0% would add about ¥31,000. However, late-stage gains can include stop-sells (rooms withdrawn from listings), and cutting rates to fill rooms reduces the gain accordingly. Read Table 5 as an upper-bound guide to how much it is worth pushing to fill Day 2, and base actual moves on the triggers in the next section.
For Revenue Managers Running City Hotels, Business Hotels and Ryokan in Kumamoto: Implications and Action Plan
Operational Insights
1. Read the Day 1–Day 2 gap as a property-type pattern. For business hotels, the Day 2 lag went from 6.3pt at 30 days out to 7.3pt at the finish, while city hotels and ryokan closed theirs with a step-up around 26 days out. Overlay your own booking pace on the market’s three checkpoints (45 days out, 30 days out, latest) and see at which checkpoint you diverge. That makes it easier to tell a lag that will fill from a lag that will stay.
2. Business-hotel Day 2 stopped at strong-Sunday levels. October 11’s 89.2% sits at the top of September’s Sunday range (78.1–89.5%), which is different demand from Day 1 of the holiday (96.5%). Applying Day 1 prices and conditions to Day 2 just because it is a holiday risks missing the +10.0pt of last-minute demand that came in over the final 10 days. Plan Day 2 separately from Day 1.
3. Ryokan essentially finish filling by 30 days out. October 17 went from 94.8% at 30 days out to 94.1% at the latest observation, with no late gain. For ryokan, the last stretch tends to be less about adding occupancy and more about which occupancy settings and plan mix to sell the remaining rooms with, so there is room to set the price center before T-30.
4. Keep the rate context in view. September’s settled rates rose +20.0% at business hotels and +12.0% at city hotels, so rates on nights that fill have more headroom than a year ago. The current October estimates (city ¥14,200, business ¥10,600, ryokan ¥18,200) are safer to use as a yardstick once they settle.
The next three-day weekend is Saturday, November 21 to Monday, November 23 (Labor Thanksgiving Day), with 30 days out falling around October 22. The actions below are organized into three time horizons, each with decision triggers tied to figures in this article.
| Time horizon | Action | Decision trigger (figures in this article) | Aim |
|---|---|---|---|
| Today to this week (for 10/17, latest) | Compare your own booking pace for the 17th with the market’s latest figures and check last-minute plan visibility and inventory allocation | Market latest (5 days out): city 94.0%, business 89.1%, ryokan 94.1%. Business hotels added +6.5pt / +10.0pt in the final 10 days for the 10th / 11th | Keep inventory available for last-minute demand while limiting losses if you are behind the market |
| Today to this week (for 10/17) | Business hotels: given that pace for the 17th is 3.2pt below Day 1 of the long weekend at the same point (92.3% at 5 days out), review the price steps for the final week | If your own figure for the 17th stays flat below the market’s 89.1% | Secure a normal-Saturday finish |
| Within two weeks (for 10/24, 12 days out) | The 24th is already high at 12 days out: city 97.4%, business 90.2%, ryokan 93.7%. If you have not reached the market’s 30-days-out level (business 82.4%), recheck pricing on remaining inventory | If your booking pace for the 24th is 5pt or more below the market’s 12-days-out figure | Sell through the remaining rooms on a fast-filling Saturday without cutting rates |
| Within two weeks (for 10/24) | City hotels reached 97.4% for the 24th at 12 days out, leaving little inventory. Look at selling through higher room categories and plan mix rather than last-minute discounts | If your own figure for the 24th is above the market’s 94.9% (30-days-out figure) | Protect rates on high-occupancy nights |
| Toward next month (11/21–23, T-30 ≈ 10/22) | Set separate targets for Day 1 and Day 2. For business hotels, if Day 2 is more than 6pt below Day 1 at 30 days out, consider Day 2-specific multi-night conditions or second-night pricing | October result: business hotels’ Day 1 − Day 2 gap at 30 days out was 6.3pt (76.2% vs 69.9%) and became a 7.3pt finishing gap | Address unsold Day 2 rooms at the 30-days-out point |
| Toward next month (11/21–23) | City hotels have closed a 30-days-out lag by 26 days out before, so do not cut prices on a 30-days-out lag alone. Ryokan should set their price center by 30 days out | City hotels on 10/11: 83.5% at 30 days out → 96.7% the night before. Ryokan on 10/17: 94.8% at 30 days out → 94.1% latest | Use a revision calendar matched to each property type to avoid cutting too early or raising too late |
These are outlines of opportunities, not guarantees of results. Consider them in light of your own guest mix and channel mix.
Summary: Three Yardsticks for Reading a Long Weekend
First, read each property type’s pattern at three checkpoints: 45 days out, 30 days out and the latest observation. On Day 1 of Kumamoto’s October long weekend all three types topped 96% the night before, but they started 13.5pt apart at 45 days out and filled at different times. Second, track how many points separate Day 1 and Day 2 at 30 days out and how that gap changes by the finish. For business hotels it held, 6.3pt → 7.3pt; for city hotels it vanished, 9.3pt → 1.1pt. That difference tells you whether a property type should sell Day 2 separately from Day 1. Third, compare with the regular Saturdays after the holiday. October 17 and 24 were higher than Day 1 of the long weekend at 45 days out and added little after 30 days out. Last-minute holiday demand and early demand for regular Saturdays move differently, and they are easier to manage on separate pricing calendars.
Frequently Asked Questions
Q. Is estimated OCC (OTA-listed inventory basis) the same as actual room occupancy?
A. No. It is an estimate back-calculated from the number of rooms left on OTA and other listings. Because rooms not listed are counted as sold, it runs higher than actual occupancy. Use it to compare curve shapes and relative positions across property types and dates, and avoid comparing its absolute values directly with published occupancy rates.
Q. Were business hotels the only type whose Day 2 finished below Day 1?
A. For Kumamoto Prefecture in October 2026, as of the night before arrival, business hotels were left with a 7.3pt gap (Day 1 96.5%, Day 2 89.2%), while city hotels (97.8% vs 96.7%) and ryokan (98.4% vs 98.1%) were nearly level. In September’s five-day holiday (Sept 19–23), business hotels were highest on the second-day Sunday, so where demand concentrates changes from one holiday to the next.
Q. Will the figures for October 17 and 24 still change?
A. Yes. The latest figure for the 17th in this article was observed 5 days before the stay and the 24th 12 days before, and sales and inventory change daily. Read the figures as a snapshot as of October 13, 2026.
About the Data
| Definition of estimated OCC (OTA-listed inventory basis) | OTA-listed inventory occupancy = 100 − 100 × rooms remaining on OTA listings ÷ total rooms. Coverage is a fixed cohort of properties that list at least 30% of their total rooms on OTAs (the same set of properties for each stay date; N properties in the article is that count). It is an estimate based on how inventory sold on OTAs is being absorbed and is defined differently from actual room occupancy (it runs higher because unlisted rooms are counted as sold). |
| Booking curve | Based on observations from 45 days before the stay date to the latest. Checkpoints are 45 days out, 30 days out and the latest (the night before arrival for 10/10 and 10/11, 5 days out for 10/17 and 12 days out for 10/24). |
| Estimated settled ADR | The settled price level (tax-excluded equivalent) estimated from OTA and other sales data (lowest-plan level × property-type coefficient, an ensemble of multiple channels). Past months are settled values; current and future months are estimates based on sales so far. Median error of 6.6% against published operating results. |
| Coverage N | Estimated OCC: Kumamoto Prefecture city hotels 11–12 properties (1,255–1,315 rooms), business hotels 55–56 properties (7,024–7,035 rooms), ryokan 142–143 properties (2,667–2,680 rooms). September reference values: city 12–14 properties, business 58–61 properties, ryokan 121–173 properties. Estimated settled ADR: city 18–19 properties, business 115–122 properties, ryokan 221–237 properties (varies by month). |
| Data as of | October 13, 2026. Sales and inventory change daily, so the figures in this article are a snapshot as of the time of retrieval. |
References and Sources
■ Data Sources
Aggregated data from MetroEngines Research. Estimated OCC is based on daily observations of rooms remaining on OTA listings, from 45 days before each stay date to the latest, for fixed cohorts of Kumamoto Prefecture city hotels, business hotels and ryokan (properties listing at least 30% of total rooms on OTAs), retrieved October 13, 2026. September reference values are daily figures for September 2026 as of the night before arrival, using the same cohort definition. The comparison with other prefectures (Table 3) uses each of the 47 prefectures’ fixed business-hotel cohorts as of the night before arrival. Estimated settled ADR is the monthly value by property type for Kumamoto Prefecture (September 2025 to October 2026).
■ Estimation Assumptions
The sensitivity analysis in Table 5 models the additional room revenue per night when a 100-room business hotel lifts its finish above the market’s Day 2 finish (estimated OCC 89.2%): (finishing OCC − 89.2%) × 100 rooms × rate. Rates are three estimated settled ADR values for Kumamoto business hotels (October 2025 settled ¥6,911, September 2026 settled ¥8,220, October 2026 current estimate ¥10,603, all tax-excluded equivalent), and the additional rooms are assumed to sell at the same rate.
■ Limitations and Caveats
Estimated OCC is an estimate based on OTA-listed inventory. Rooms withdrawn from listings (stop-sells) are also counted as sold, so part of the late-stage gain may include stop-sells (for example, of business hotels’ +10.0pt over the final 10 days for 10/11, +5.4pt came between 3 days out and the night before). City hotels are a small sample (N=11–12 properties), and one property adding or pulling inventory moves the figure by several points. Figures for 10/17 and 10/24 are mid-course observations before the stay, and the October 2026 estimated settled ADR is an estimate before settlement; both will change. The national median is the median of prefecture-level values, not a room-weighted national figure.
■ External Sources
Cabinet Office, “About National Holidays” (国民の祝日について) (Sports Day = second Monday of October; October 12 in 2026): https://www8.cao.go.jp/chosei/shukujitsu/gaiyou.html
Cabinet Office, “National Holidays” CSV (2026: Sept 21 Respect for the Aged Day, Sept 22 national holiday, Sept 23 Autumnal Equinox Day, Nov 23 Labor Thanksgiving Day): https://www8.cao.go.jp/chosei/shukujitsu/syukujitsu.csv