

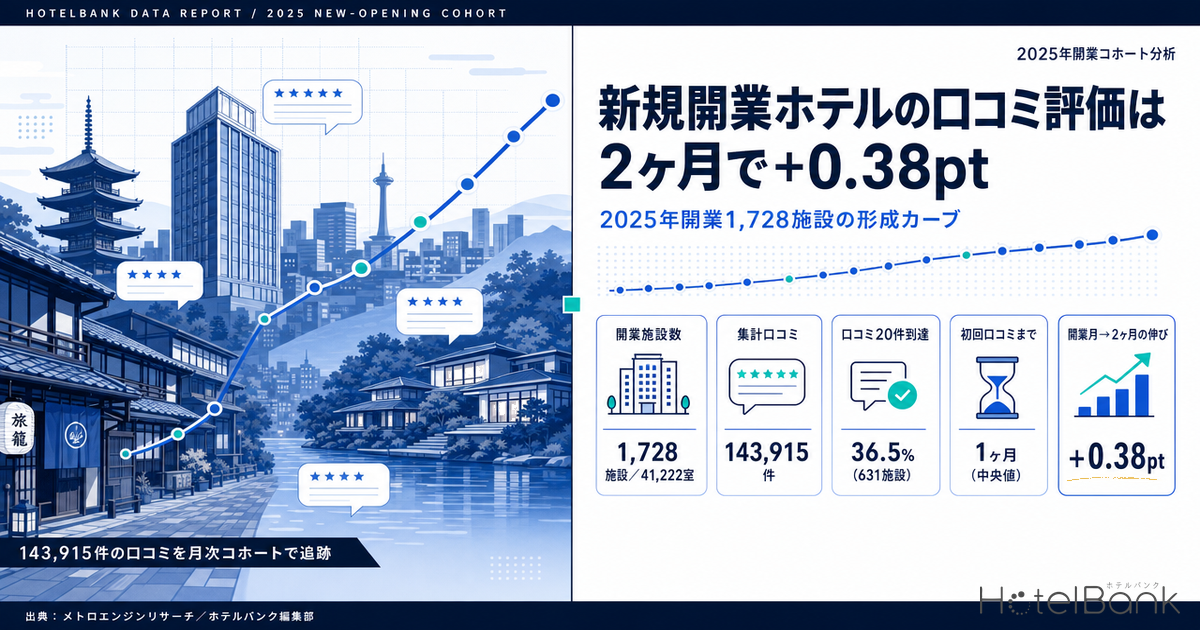
Japan saw 1,728 new lodging properties totalling 41,222 rooms open in 2025, as tracked by MetroEngines Research. A year and a half on, as of August 2026, how many guest voices have these properties collected, and how has their reputation taken shape? This article sets price aside and focuses on how evaluation itself is formed, tracking 143,915 post-opening reviews as a monthly cohort.
Our earlier work on renovation timing across the 10-year opening cohort and on ADR and inventory sell-through for properties that opened in H1 2026 dealt with rate and occupancy. This piece applies the same cohort logic to a different axis: how reputation forms.
Metric Definitions Used in This Article
- Opening date: the establishment date of each property as tracked by MetroEngines Research (confirmed on an OTA-listing basis). Properties falling between 1 January and 31 December 2025 form the population.
- Months since opening: the posting month counted from the opening month as 0. Month 0 = reviews posted in the opening month itself.
- Review count: guest-posted reviews carrying an overall rating, aggregated monthly. Unless otherwise noted, this refers to reviews posted after opening (month 0 onward).
- Overall score: on a 5-point scale. A property-level score is the monthly average score weighted by that month’s review count. Representative values for bands and property types are the median of property scores.
- True new vs. carry-over: properties with fewer than 20 reviews posted more than two months before the opening month are classified as “true new”; those with 20 or more are classified as “carry-over” (properties that inherited an existing review history through renovation or rebranding).
- Data sources: MetroEngines Research (properties and room counts); guest review aggregation by the HotelBank Editorial Team
- — 3.95pt in the opening month to 4.32pt at month 2: the overall score moves +0.38pt in just two months, and the additional gain over the following 12 months is only about +0.10pt (fixed cohort, N=157 properties).
- — 36.5% reached 20 reviews (631 properties): of the 1,728 properties that opened in 2025, more than 60% still lack enough reviews to discuss statistically, even 18 months on. The single biggest explanatory variable is room count.
- — Monthly review inflow peaks at month 5: it tops out at a median of 7 reviews, then tapers to around 4 from month 12 onward. The linear assumption that “reviews accumulate as a property ages” does not hold.
- — Properties above 50 rooms gain +0.11 to +0.18pt within the same property: 12 of 13 city hotels (92%) saw their score rise, with a median of +0.20pt. Properties of 50 rooms or fewer start high and stay flat.
- — Carry-over properties gain +0.09pt before vs. after conversion, and individual cases exceed +1pt: several properties moved 0.5-1.2pt after swapping concept and operating structure inside an existing building, evidence of post-acquisition upside.
Just over a third of properties have reached a readable level of reviews
First, the shape of the population. Of the 1,728 properties that opened in 2025, 631 – 36.5% of the total – had accumulated 20 or more post-opening reviews as of August 2026. Put the other way round, a year and a half after opening, more than 60% still fall short of the volume needed to discuss their reputation statistically.
The biggest explanatory variable behind this gap is room count. Only 13.7% of properties with 1-5 rooms reached 20 reviews, whereas every property with 201 rooms or more has done so. This is not simply a matter of five times the rooms producing five times the guests: among those that did reach the threshold, the median review count itself runs from 37 for 1-5 rooms to 656 for 201 rooms and above, a gap of almost 18x.
Source: MetroEngines Research (OTA-listing basis, N=1,728 properties); compiled by the HotelBank Editorial Team
What matters here is that this structure reflects sample size, not quality. Small properties are not “poorly rated” – their ratings simply have not yet taken a statistically readable form. As shown later, bands with fewer reviews tend to post higher scores and, at the same time, wider dispersion. From an operator’s perspective, the smaller the property, the more a single review moves the average, which means careful experience design translates into score more directly.
By property type, the reach rate spreads from 11% to 88%
Sorting by property type makes the scale effect even clearer. City hotels (median 168 rooms) reached 20 reviews in 88.0% of cases, with a median of 672 reviews among those that reached it. Business hotels (median 56 rooms) also reached it in 85.3% of cases. Rental villas, by contrast, were the largest single group among 2025 openings at 738 properties, yet with a median of just one room their reach rate stops at 11.1%.
| Property type | 2025 openings | Median rooms | Reached 20 | Reach rate | Median reviews among reachers | Median score |
|---|---|---|---|---|---|---|
| Rental villa | 738 | 1 | 82 | 11.1% | 41 | 4.81 |
| Business hotel | 265 | 56 | 226 | 85.3% | 174 | 4.27 |
| Guesthouse | 119 | 2 | 25 | 21.0% | 33 | 4.66 |
| Cottage | 113 | 3 | 35 | 31.0% | 47 | 4.52 |
| Resort hotel | 99 | 20 | 78 | 78.8% | 128 | 4.36 |
| Hostel | 98 | 7 | 45 | 45.9% | 61 | 4.52 |
| Ryokan | 59 | 11 | 38 | 64.4% | 69 | 4.61 |
| Minshuku | 28 | 2 | 7 | 25.0% | 37 | 4.67 |
| Machiya townhouse | 28 | 1 | 5 | 17.9% | 37 | 4.55 |
| City hotel | 25 | 168 | 22 | 88.0% | 672 | 4.45 |
| Glamping | 22 | 3 | 4 | 18.2% | 78 | 4.58 |
| Pension | 20 | 5 | 8 | 40.0% | 36 | 4.80 |
Source: MetroEngines Research; compiled by the HotelBank Editorial Team
Note: only property types with 20 or more 2025 openings are shown. Median scores are calculated using properties that reached 20 reviews.
The ranking by median score does not match the ranking by volume. Small-format types lead – rental villas at 4.81, pensions at 4.80, minshuku at 4.67 – followed by business hotels at 4.27 and resort hotels at 4.36. This reflects the review-volume band effect noted above rather than any inherent superiority of one property type over another. A volume-matched comparison follows later.
2025 openings have two different starting points for reputation
Before starting the cohort analysis, one structural distinction has to be drawn. Among properties recorded as opening in 2025 are those that restarted after renovation or rebranding in the same building and the same location, carrying over the review history accumulated before that reopening.
Defining a “carry-over” property as one with 20 or more reviews posted more than two months before its opening month, 193 of the 1,728 properties qualify (10,618 rooms). Those 193 properties carry a combined 247,049 pre-opening reviews. The remaining 1,535 properties (30,604 rooms) built their reputation from zero and are classified as “true new”.
Calculating an “average score for 2025 openings” without making this distinction would mix in reviews earned under the previous operation and destroy the meaning of the cohort. The analysis below treats the two groups separately.
The cumulative curve is not a straight line: a two-month ramp, then tapering from month 9
We tracked the pace at which true new properties accumulate reviews, split by opening quarter. The horizontal axis is months since opening (opening month = 0); the vertical axis is the median cumulative review count.
Source: MetroEngines Research; compiled by the HotelBank Editorial Team
Note: true new properties with 20 or more post-opening reviews only. Q1 openings N=110, Q2 N=151, Q3 N=120, Q4 N=97.
What all four curves share is that none of them is linear. The median cumulative count in the opening month (month 0) is 0-1 in every quarter; only a small minority collect a meaningful number of reviews in their first month. The median time to a first review is one month, and 85.1% receive their first within two months. Both the lag between staying and posting, and the fact that occupancy itself is still ramping up right after opening, are at work here.
The monthly inflow makes the shape even clearer.
Source: MetroEngines Research; compiled by the HotelBank Editorial Team
Note: true new properties with 20 or more post-opening reviews (N=478; the number of observed properties declines as months since opening increase).
Monthly inflow peaks at month 5 (median 7 reviews, mean 17.9) and tapers gradually from there, settling at a median of around 4 from month 12 onward. In other words, the naive linear assumption that “reviews accumulate as a property ages” does not hold: the inflow rate itself falls away after the first six months. Cumulative volume does keep rising, but the increment shrinks every month.
This is consistent with the conclusion that review volume does not grow with age, which we drew from the relationship between review count, ADR and inventory sell-through. This article redraws that finding as a monthly curve for an opening cohort.
The score itself moves +0.38pt within two months of opening
Turning from volume to score formation. To avoid apparent movement caused by a changing mix of observed properties, we fixed the sample to 157 true new properties that can be observed across all 12 months from opening and that have 100 or more post-opening reviews, and tracked their monthly scores. The carry-over score curve is overlaid for comparison.
Source: MetroEngines Research; compiled by the HotelBank Editorial Team
Note: true new is a fixed cohort of N=157 properties (limited to those observable across 12 months from opening). Carry-over is the 153 properties with 20 or more post-opening reviews. Both weight monthly average scores by review count.
The true new score rises from 3.95 in the opening month to 4.32 at month 2 – a gain of +0.38pt in just two months. After that it reaches 4.41 at month 7 and 4.42 at month 11, a gentle additional gain of roughly +0.10pt over 12 months. Most of the eventual score level is formed within three months of opening, after which the property enters a fine-tuning phase.
The opening month scores structurally low partly because operations are still finding their feet, and partly because the period right after opening concentrates issues – fine equipment adjustments, staff learning their movement patterns, the rhythm of restocking supplies – that resolve naturally once operations settle. Read the other way, these two months offer the highest return on investment in score.
The carry-over curve runs consistently below the true new curve (4.24 at month 11). Much of that gap, however, comes from differences in property size and type mix: carry-over properties have a median of 20 rooms and include many resort and business hotels. A within-property before-and-after comparison reveals an entirely different picture, discussed below.
Tracked within the same property, those above 50 rooms gain +0.11 to +0.18pt
A cohort-wide curve still carries mix effects from the changing set of properties observed each month. So we narrowed the sample to the 150 true new properties with 20 or more reviews in both months 0-2 and months 6-11, and compared directly how the score moved within each property.
| Segment | Properties | Score change (median) | Share of properties that improved |
|---|---|---|---|
| All | 150 | +0.07 | 61% |
| 51-150 rooms | 44 | +0.18 | 80% |
| 151 rooms and above | 55 | +0.11 | 65% |
| 21-50 rooms | 33 | -0.04 | 42% |
| 1-20 rooms | 18 | -0.02 | 33% |
| City hotel | 13 | +0.20 | 92% |
| Resort hotel | 19 | +0.16 | 74% |
| Business hotel | 85 | +0.07 | 65% |
Source: MetroEngines Research; compiled by the HotelBank Editorial Team
Note: the 150 true new properties with 20 or more reviews in both months 0-2 and months 6-11. Segments with N below 6 are not shown.
The result splits clearly. Among mid- and large-format properties above 50 rooms, the median change is +0.11 to +0.18pt, and 65-80% of properties improved. City hotels stand out: 12 of 13 (92%) saw their score rise, with a median of +0.20pt, the largest gain of any segment. The numbers show the guest experience stabilising as organised operations come up to speed.
Among properties of 50 rooms or fewer, by contrast, the median is essentially flat (-0.02 to -0.04pt). That is not a story of failing to improve: these properties open at an already high level of polish, leaving little room to move. Indeed, the top-score ranking later in this article is dominated by small properties. Mid- and large-format properties have upside from operational maturity; small properties have a different strength – the ability to deliver a high standard from day one.
Bands with fewer reviews score higher – and vary more
The score distribution by review-count band, shown in quartiles. The sample is the true new properties, of which 1,535 exist in total, that have at least one post-opening review.
Source: MetroEngines Research; compiled by the HotelBank Editorial Team
Note: the vertical bar for each band spans the first to third quartile; the white horizontal line is the median. N per band: 1-9 reviews 495, 10-19 148, 20-49 189, 50-99 83, 100-299 135, 300 and above 71.
| Review-count band | Properties | Mean | 95% CI | Median | IQR | Std. dev. |
|---|---|---|---|---|---|---|
| 1-9 reviews | 495 | 4.50 | 4.44-4.57 | 4.80 | 0.80 | 0.74 |
| 10-19 reviews | 148 | 4.54 | 4.46-4.62 | 4.70 | 0.68 | 0.51 |
| 20-49 reviews | 189 | 4.57 | 4.51-4.63 | 4.69 | 0.51 | 0.43 |
| 50-99 reviews | 83 | 4.40 | 4.31-4.49 | 4.41 | 0.64 | 0.42 |
| 100-299 reviews | 135 | 4.33 | 4.27-4.38 | 4.38 | 0.42 | 0.34 |
| 300 reviews and above | 71 | 4.37 | 4.31-4.43 | 4.39 | 0.33 | 0.27 |
Source: MetroEngines Research; compiled by the HotelBank Editorial Team
The interquartile range narrows consistently as review volume rises, from 0.80 in the 1-9 band to 0.33 in the 300-and-above band. The standard deviation likewise falls from 0.74 to 0.27, roughly a third. The score of a low-volume property is driven less by that property’s underlying quality than by what the handful of people who happened to stay first chose to write.
The mean also declines, from 4.50 in the 1-9 band to 4.37 in the 300-and-above band. But look at the 95% confidence intervals: the 1-9 band spans a wide 4.44-4.57, while the 300-and-above band is a narrow 4.31-4.43. A high mean in a low-volume band has to be read alongside the width of that interval. When benchmarking competitors or positioning your own property, simply lining up scores from properties with fewer than 20 reviews is unlikely to produce a meaningful difference.
By category, rooms, staff and cleanliness are the strengths of new openings
Breaking the overall score into categories shows where new properties win support. The comparison is against carry-over properties.
| Review category | True new median | N | Carry-over median | N | Diff. |
|---|---|---|---|---|---|
| Staff | 4.52 | 226 | 4.21 | 88 | +0.31 |
| Cleanliness | 4.50 | 178 | 4.18 | 90 | +0.33 |
| Rooms | 4.50 | 296 | 4.13 | 117 | +0.37 |
| Parking & access | 4.50 | 116 | 4.20 | 45 | +0.30 |
| Atmosphere | 4.47 | 124 | 4.25 | 44 | +0.21 |
| Location | 4.41 | 279 | 4.25 | 114 | +0.16 |
| Breakfast | 4.38 | 125 | 4.06 | 79 | +0.32 |
| Service | 4.35 | 272 | 4.11 | 115 | +0.24 |
| Meals | 4.34 | 85 | 3.99 | 68 | +0.35 |
| Bath & onsen | 4.22 | 171 | 4.03 | 80 | +0.19 |
| Bathroom | 4.01 | 109 | 3.71 | 75 | +0.30 |
Source: MetroEngines Research; compiled by the HotelBank Editorial Team
Note: only properties with 10 or more reviews in each category are counted. N is the number of qualifying properties.
True new properties beat carry-over properties in every category, but the largest gaps are rooms (+0.37), meals (+0.35), cleanliness (+0.33) and breakfast (+0.32). That brand-new hardware earns praise is easy to imagine; more telling is that the gap also appears on the soft side, in meals and breakfast. A new opening can design its menu and its service operation from scratch around current demand, and that freedom shows up in the numbers.
The smallest gap, conversely, is location (+0.16). Location is the one element the newness of a building cannot move – unsurprising in itself, but it also shows that carry-over properties retain their existing locational asset intact. Note that bathroom sitting at the bottom of the 11 categories is not unique to new openings: it also emerges as the weakest item in our analysis matching Kyoto’s review distribution against settled ADR estimates.
Top 20 by score among 2025 openings with 100 or more reviews
Among true new properties, 206 have accumulated 100 or more post-opening reviews. Here are the top 20 by overall score within that group. Setting the volume threshold at 100 suppresses the small-sample dispersion described in the previous section.
| Rank | Property | Location | Type | Rooms | Score | Reviews | Opened |
|---|---|---|---|---|---|---|---|
| 1 | Vihta Yamanakako (ヴィヒタ 山中湖) | Yamanashi | Minshuku | 4 | 4.99 | 289 | 2025/01 |
| 2 | SHIGARAKI SAUNA | Shiga | Cottage | 1 | 4.96 | 111 | 2025/05 |
| 3 | Guesthouse Kuku Kawagoe (ゲストハウスくく川越店) | Saitama | Guesthouse | 13 | 4.93 | 153 | 2025/04 |
| 4 | STITCH HOTEL Kyoto | Kyoto | Deluxe hotel | 16 | 4.92 | 168 | 2025/06 |
| 5 | &zen. Kyoto Gion (&zen.京都祇園) | Kyoto | Business hotel | 18 | 4.90 | 185 | 2025/07 |
| 6 | Old Rookie Sauna Hotel Kisarazu Kaneda (オールドルーキーサウナホテル木更津金田) | Chiba | Resort hotel | 10 | 4.90 | 107 | 2025/04 |
| 7 | HOTEL TOKI (HOTEL TOKI季) | Tokyo | Hostel | 18 | 4.89 | 100 | 2025/09 |
| 8 | VILLA SENSE kujukuri | Chiba | Rental villa | 1 | 4.89 | 106 | 2025/03 |
| 9 | HOTEL URO | Nagasaki | Hostel | 27 | 4.87 | 228 | 2025/08 |
| 10 | MAGMA RESORT Shimobe | Yamanashi | Resort hotel | 6 | 4.86 | 420 | 2025/04 |
| 11 | Nazuna Kyoto Nishi Honganji (Nazuna 京都西本願寺) | Kyoto | Ryokan | 14 | 4.86 | 263 | 2025/09 |
| 12 | BUB RESORT Tsukuba | Ibaraki | Cottage | 15 | 4.85 | 1,378 | 2025/04 |
| 13 | NIPPONIA HOTEL Ise Kawasaki Merchant Town (NIPPONIA HOTEL伊勢河崎商人町) | Mie | Ryokan | 8 | 4.84 | 220 | 2025/04 |
| 14 | NIPPON RESORT “Mui Shizen -ATAMI-” (NIPPON RESORT「無為自然-ATAMI-」) | Shizuoka | Resort hotel | 18 | 4.83 | 124 | 2025/04 |
| 15 | GRAND MONday Ginza (GRAND MONday銀座) | Tokyo | Hostel | 45 | 4.82 | 569 | 2025/04 |
| 16 | Premium Apart MONday Kyoto Gojo (Premium Apart MONday 京都五条) | Kyoto | Other | 36 | 4.81 | 718 | 2025/05 |
| 17 | Gora Kadan Fuji (強羅花壇 富士) | Shizuoka | Ryokan | 42 | 4.79 | 138 | 2025/07 |
| 18 | yugen kyoto shijo | Kyoto | Business hotel | 58 | 4.79 | 677 | 2025/09 |
| 19 | BATON SUITE Okinawa Kouri Island (BATON SUITE 沖縄古宇利島) | Okinawa | Resort hotel | 35 | 4.77 | 248 | 2025/03 |
| 20 | Cool Stay & Smart Dining In The Fuji (クール・ステイ&スマート・ダイニング イン・ザ・富士) | Yamanashi | Cottage | 15 | 4.76 | 254 | 2025/02 |
Source: MetroEngines Research; compiled by the HotelBank Editorial Team
Note: the population is the 206 true new properties with 100 or more post-opening reviews. Review counts are the total of rated reviews posted from the opening month onward (as of August 2026).
Fourteen of the top 20 have fewer than 20 rooms: sauna-equipped villas, small hotels converted from Kyoto machiya townhouses, guesthouses with a clearly defined theme – properties with a sharply drawn experience. At the same time, the list includes properties that combine scale with both high scores and high volume: GRAND MONday Ginza at 45 rooms with 569 reviews and 4.82, and yugen kyoto shijo at 58 rooms with 677 reviews and 4.79. Volume and rating are not a trade-off.
By region, Kyoto contributes five properties, Yamanashi three, and Shizuoka, Chiba and Tokyo two each – the top ranks draw on both urban and nature-based locations.
Carry-over properties gain +0.09pt around conversion, with individual cases above +1pt
We ran the same within-property before-and-after comparison for carry-over properties, comparing the weighted average score over the 12 months before opening (the pre-conversion operating period) against months 4-14 after opening, across the 101 properties with 20 or more reviews in both windows.
The median change is +0.09pt, and 67 of the 101 properties (66%) improved. The overall movement is modest, but the upper tail of the distribution contains properties that moved their numbers substantially.
| Property | Type | Rooms | Pre-conversion | Post-conversion | Change |
|---|---|---|---|---|---|
| Hottarakashi no Yado Yufuri Izu Kogen (ほったらかしの宿 ゆうふり伊豆高原) | Resort hotel | 82 | 2.78 | 4.00 | +1.22 |
| Kamenoi Hotel Kusatsu Resort (亀の井ホテル 草津リゾート) | Resort hotel | 103 | 3.24 | 4.21 | +0.98 |
| Daido Garden Hotel (大同Garden Hotel) | Hostel | 7 | 3.54 | 4.49 | +0.95 |
| Litt Hotel Nakijin (リットホテル今帰仁) | Resort hotel | 37 | 3.88 | 4.72 | +0.84 |
| BAND HOTEL HAKATA | Business hotel | 29 | 3.67 | 4.46 | +0.79 |
| Hotel MyStays Higashi-Jujo (ホテルマイステイズ東十条) | Business hotel | 90 | 3.54 | 4.27 | +0.72 |
| TAOYA Gero (TAOYA下呂) | Resort hotel | 99 | 3.56 | 4.12 | +0.56 |
| TAOYA Wakura (TAOYA和倉) | Resort hotel | 101 | 3.78 | 4.33 | +0.55 |
Source: MetroEngines Research; compiled by the HotelBank Editorial Team
Note: the top 8 by size of change among the carry-over properties with 20 or more reviews in both the 12 months before opening and months 4-14 after opening, out of 101 properties.
The top of the list is populated by mid-sized resorts of 82, 103, 99 and 101 rooms. Swapping the concept and the operating structure while keeping the existing building can move the score by 0.5-1.2pt. Here is a route to rebuilding a reputation that differs from stacking one up from scratch in a new building. How far renovation can move cleanliness-related scores in particular is something we have measured property by property in separate work on the properties nationwide where “renovated and spotless” lifts guest satisfaction most.
From an investment perspective, the simple fact that multiple properties have realised a gain of +0.5pt or more is itself evidence supporting the reputation-improvement upside in acquiring an existing property.
Restating the range of achieved scores using observed movement
Combining the two observations obtained so far – the 4.32pt level reached at month 2 in the fixed cohort of N=157 properties (up +0.38pt from 3.95pt in the opening month), and the median within-property score change from months 0-2 to months 6-11 across 150 properties – lets us sketch the range of where a property might land at 12 months without introducing any additional estimation. Everything below is simple addition between figures already presented in this article; no new forecasting model is used.
| Case | Change applied (observed median from Table 2) | Starting point (month 2) | At 12 months | Share that improved |
|---|---|---|---|---|
| Downside | -0.04pt (21-50 rooms) | 4.32 | 4.28 | 42% |
| Mid | +0.07pt (all 150 properties) | 4.32 | 4.39 | 61% |
| Upside | +0.20pt (13 city hotels) | 4.32 | 4.52 | 92% |
Source: MetroEngines Research; compiled by the HotelBank Editorial Team
Note: starting points, change magnitudes and improvement shares are all observed values from Table 2 and the fixed-cohort analysis in this article. The case labels describe the range and carry no probability weighting.
To see the full picture of that range, the next table lays it out on two axes: starting level and change. Rows span the observed range from 3.95pt in the opening month to 4.32pt at month 2; columns are the median changes by room-size band and property type observed in Table 2, used as-is.
| Level at months 0-2 \ change | -0.04pt 21-50 rooms | -0.02pt 1-20 rooms | +0.07pt all 150 properties | +0.11pt 151 rooms and above | +0.20pt city hotels |
|---|---|---|---|---|---|
| 3.95 | 3.91 | 3.93 | 4.02 | 4.06 | 4.15 |
| 4.05 | 4.01 | 4.03 | 4.12 | 4.16 | 4.25 |
| 4.15 | 4.11 | 4.13 | 4.22 | 4.26 | 4.35 |
| 4.25 | 4.21 | 4.23 | 4.32 | 4.36 | 4.45 |
| 4.32 | 4.28 | 4.30 | 4.39 | 4.43 | 4.52 |
Source: MetroEngines Research; compiled by the HotelBank Editorial Team
Note: each cell is the row’s starting score plus the column’s change. The shaded cell is the reference case, applying the overall median (+0.07pt) to the fixed cohort’s month-2 level (4.32pt).
What this shows is that the spread in starting points is wider than the spread in subsequent change. The range across rows is 0.37pt, against 0.24pt across columns: how high a property is lifted in its first two months determines a wider band than a year of operational maturity does. Mid- and large-format properties do have room to capture +0.11 to +0.20pt, but that presupposes having got the starting point up to around 4.32pt.
What this means for operators
Four points emerge from the data on post-opening reputation formation.
First, the decisive window is the first three months after opening. The score moves +0.38pt from 3.95 in the opening month to 4.32 at month 2, and the additional gain over the following 12 months is only around +0.10pt. Weighting staffing and early equipment troubleshooting more heavily in those first three months has an effect comparable to a full year of gradual improvement thereafter.
Second, review inflow peaks around month 5 and tapers from there. Rather than designing around waiting for volume to accumulate naturally, raising the completeness of the guest experience within the first six months – when inflow is highest – builds the score foundation that keeps working long afterwards.
Third, scores based on fewer than 20 reviews are hard to use for comparison. An interquartile range of 0.80 means that properties of identical underlying quality routinely show an apparent gap of around 0.8pt. To judge your own property or a competitor, aim for at least 20 reviews, and preferably 50 or more.
Fourth, the upside worth chasing differs by size. Mid- and large-format properties above 50 rooms show an observed gain of +0.11 to +0.18pt from operational maturity, giving a clear return on operational improvement. Properties of 50 rooms or fewer do better to design for a high standard from opening day – and in practice they dominate the top of the score ranking.
Methodology and sources
The population is the 1,728 domestic lodging properties (41,222 rooms in total) with an establishment date between 1 January and 31 December 2025, as tracked by MetroEngines Research. Opening dates are on an OTA-listing-confirmed basis, a confirmed value that accounts for listings appearing several months ahead of opening. This is not a complete census.
The review data was aggregated by the HotelBank Editorial Team. Of the 1,728 properties above, the analysis covers the 1,313 properties that received rated reviews from the opening month (month 0) onward, totalling 143,915 reviews. The aggregation period is January 2025 to August 2026. Individual review text and reviewer attributes were not used in the analysis.
The “true new” and “carry-over” classification was applied mechanically, based on whether a property had fewer than 20 reviews posted more than two months before its opening month. As a result, a genuinely new-build property whose past reviews are linked through, for instance, a merger with an adjacent property may be classified as carry-over, and vice versa. The classification is an aggregation convenience and does not reflect an individual review of each property’s development history.
The number of observable properties falls as months since opening increase (a property that opened in December 2025 can only be observed through month 8 as of August 2026). To avoid this effect, the score-trajectory analysis uses a fixed set of 157 properties observable across all 12 months from opening. Cumulative review curves are shown split by opening quarter.
This article does not use ADR or occupancy in its analysis. For rate trajectories across opening cohorts, see our analysis of properties that opened in H1 2026.
Related reading
- Review Volume Doesn’t Grow With Age: 1,643 Hotels, ADR, Sell-Through
- Hotels at Year 10: The Renovation Gap Is +13.6% Below 100 Rooms
- 1,002 New Japan Openings H1 2026: ADR 1.14x, Ryokan Lag +18.8pt
- Massage Chairs in Japanese Hotels: TOP 20 Most-Mentioned Properties
- Sake in Hotel Reviews: 1,053 Japan Properties, 0.053% of 3.29M Posts
- Kyoto Reviews vs Settled ADR: Bathroom 4.002 Weakest, July ¥17,420
- 16M Reviews: Japan’s 47 Prefectures Split Into 4 Review Profile Types
- Tokyo 2026: 2,055 New Rooms, 55.6% Business Hotels, ADR Turns Negative
References and sources
Data sources
The population is the 1,728 domestic lodging properties (41,222 rooms) opening between 1 January and 31 December 2025 as tracked by MetroEngines Research (opening dates on an OTA-listing-confirmed basis). Reviews are guest posts carrying an overall rating, aggregated by the HotelBank Editorial Team, covering 1,313 properties and 143,915 post-opening reviews (aggregation period January 2025 to August 2026). Property counts and median room counts by type come from the openings master; monthly scores and volumes are calculated from the review aggregation.
Calculation assumptions
A property-level overall score is the monthly average score weighted by that month’s review count; representative values for bands and property types are the median of property scores. Months since opening counts the posting month from the opening month as 0. “True new” and “carry-over” were classified mechanically on whether reviews posted more than two months before the opening month numbered fewer than 20. To avoid mix effects, the score trajectory is fixed to the 157 properties observable across 12 months from opening, and the within-property comparison is limited to the 150 properties with 20 or more reviews in both months 0-2 and months 6-11. The three cases and the two-axis table for achieved scores add the starting levels shown in the article (3.95-4.32pt) to the median within-property changes (-0.04 to +0.20pt); no new forecasting model or external assumption is used.
Limitations and caveats
Opening dates are on an OTA-listing-confirmed basis and this is not a complete census. Because listings can appear several months before opening, months since opening may carry a discrepancy of a few months. The “true new / carry-over” classification is a mechanical judgment based on review counts and does not reflect an individual review of each property’s development history. The number of observable properties falls as months since opening increase (December 2025 openings can be observed only through month 8 as of August 2026). Scores for properties with fewer than 20 reviews have a wide interquartile range of 0.80 and are not suited to property-to-property comparison. Review counts for the top 20 continue to rise after the aggregation date, so the values shown here are a snapshot as of that point. This article does not use ADR or occupancy in its analysis.
Market data
- MetroEngines Research – 2025 openings master (1,728 properties / 41,222 rooms, OTA-listing-confirmed basis)
- HotelBank Editorial Team research – guest review aggregation (1,313 properties / 143,915 reviews, January 2025 to August 2026)
Government statistics
- Japan Tourism Agency, “Accommodation Travel Statistics Survey” (used to confirm the overall scale of the lodging market)
- Japan Tourism Agency, Accommodation Travel Statistics Survey (May 2026 second preliminary report; June 2026 first preliminary report)