

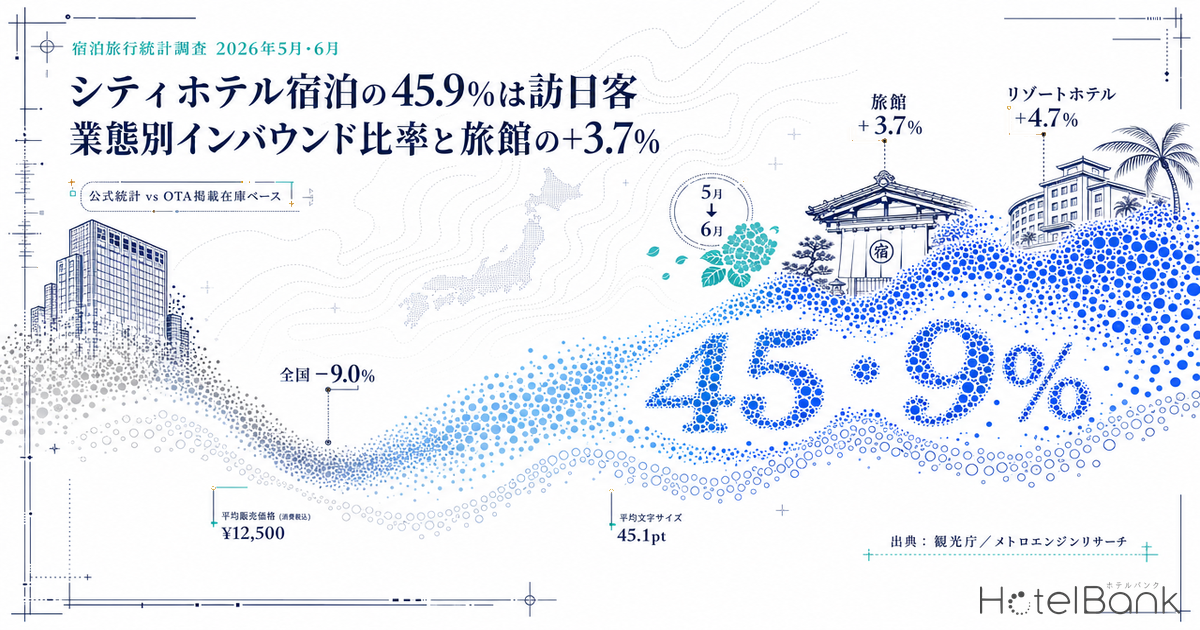
Where are inbound visitors actually staying? Breaking the Japan Tourism Agency’s latest published figures from the Overnight Travel Statistics Survey down by facility type shows that foreign travellers account for 45.9% of guest nights at city hotels, while ryokan (traditional Japanese inns) sit at just 11.5%. And in May 2026, when foreign guest nights nationwide decelerated to -9.0% year on year, the only categories among the five main facility types to grow in absolute terms were ryokan (+3.7%) and resort hotels (+4.7%). This article pulls the facility-type breakdown out of the Agency’s published tables and sets it alongside MetroEngines Research’s own measured data (estimated settled ADR and OTA-listed-inventory-based estimated occupancy) to show how official statistics and market measurement produce different pictures of the same market.
Metric Definitions Used in This Article
- Guest nights, foreign guest nights and room occupancy rate (official): figures published in the Japan Tourism Agency’s Overnight Travel Statistics Survey. May 2026 figures are second preliminary values, June 2026 figures are first preliminary values, and 2025 figures are final values. The facility types (six categories) follow the survey’s own classification: ryokan / resort hotels / business hotels / city hotels / simple lodgings (kan’i shukusho) / company and organization lodging facilities.
- ADR (average daily rate): an estimated settled rate (tax-excluded equivalent) calculated by applying facility-type correction factors to the lowest published plan level each property lists on OTAs and similar channels (two guests per room, per-room rate, tax included). Cross-checked against property-level actuals disclosed by listed hotel REITs, the median error is approximately 7%. These are estimates and differ from each property’s actual transacted prices and accounting figures. The nationwide figures in this article are prefecture-level medians weighted by the number of properties covered.
- Occupancy (OTA-listed-inventory basis, estimated): the share of sold rooms against total rooms in an area, estimated from inventory offered for sale on OTAs. It is an estimate based on how listed inventory is being absorbed and differs from each property’s actual overall occupancy. Because both the population and the definition differ from the Japan Tourism Agency’s published room occupancy rate, the two cannot be compared directly.
- Data sources: Japan Tourism Agency, Overnight Travel Statistics Survey / MetroEngines Research
- — Foreign travellers account for 45.9% of guest nights at city hotels. Business hotels stand at 24.8%, simple lodgings at 23.1% and ryokan at 11.5%, against a national average of 26.7% (May 2026, second preliminary figures).
- — With foreign guest nights nationwide down 9.0% year on year, the only two of the five main categories to grow in absolute terms were ryokan (+3.7%) and resort hotels (+4.7%).
- — Where foreign travellers stay is shifting in mix terms — ryokan +1.16pt and resort hotels +1.73pt, against business hotels at -3.12pt (share of foreign guest nights for which the facility type is identified).
- — Ryokan were the only category to beat the prior year on June 2026 room occupancy (35.3%, +0.3pt year on year). Business hotels at 70.9% and city hotels at 69.1% both fell below the prior year.
- — The gap between official statistics and market measurement reaches 45.1pt for ryokan. Because the denominator, the population and the treatment of closed days all differ, the two should be reconciled on the ordering and direction across categories, not on levels.
Only ryokan and resort hotels grew inbound volume while the nation contracted
Guest nights nationwide in May 2026 totalled 54.29 million (-3.2% year on year), of which 14.51 million were foreign guest nights (-9.0%). Taken as a whole, this is a market running below the prior year. Open the same numbers up by facility type, however, and it becomes clear the contraction was not uniform.
Looking at foreign guest nights by category, ryokan recorded 886,630 (+3.7% year on year) and resort hotels 1,258,320 (+4.7%) — the only two categories to grow in absolute terms. Business hotels, by contrast, fell to 5,820,410 (-18.5%), city hotels to 3,802,920 (-12.3%) and simple lodgings to 603,640 (-14.0%). In other words, the -9.0% national total is the net result of declines at urban lodging formats partially offset by growth at ryokan and resort hotels.
Source: Japan Tourism Agency, Overnight Travel Statistics Survey (May 2026 second preliminary figures / May 2025 final figures); compiled by the HotelBank Editorial Team
Overlaying this divergence with movements by nationality brings the background into view. For the same month of May 2026, foreign guest nights by nationality (region of origin) — covering properties with 20 or more rooms, totalling 12,764,000 guest nights, -6.7% year on year — put the United States first at 1,721,740 (+1.9%), Taiwan second at 1,698,370 (+12.2%) and South Korea third at 1,596,820 (+5.7%), with all three top markets in positive territory. China, in fourth place at 1,127,660 guest nights, fell 53.8% year on year. Which nationalities are landing in which prefectures is mapped out prefecture by prefecture in US Now Tops Japan Inbound at 13.5% — Prefecture Host Map 2026.
Working backwards from the published figures, China’s decline amounts to roughly 1.31 million guest nights — larger than the decline for all foreign travellers within the same aggregation scope (approximately 920,000 guest nights). Put the other way round, the total for all nationalities excluding China works out to roughly +3.5%, above the prior year. A temporary adjustment in one specific market and gradual expansion across the others are running simultaneously, and the growth at ryokan and resort hotels reads consistently as those formats absorbing the latter. Taiwan in particular has held near record levels, functioning as a stable market even while China decelerates.
City hotels 45.9%, business hotels 24.8% — the foreign share by category
Next, consider the share of foreign travellers within each category’s guest nights (the foreign share). As of May 2026 the highest is city hotels at 45.9%, meaning close to half of all stays are by inbound visitors. Business hotels follow at 24.8%, then simple lodgings at 23.1%, resort hotels at 18.0%, ryokan at 11.5% and company and organization lodging facilities at 1.8%. The national average is 26.7%.
Source: Japan Tourism Agency, Overnight Travel Statistics Survey (May 2026 second preliminary figures / May 2025 final figures); compiled by the HotelBank Editorial Team
What stands out is that the share itself fell year on year in every category. City hotels declined 2.0pt from 47.9% to 45.9%, business hotels 2.2pt from 27.0% to 24.8%, and ryokan 1.3pt from 12.8% to 11.5%. Foreign travellers decreased while Japanese guests returned in relative terms, so on share alone every category points in the same direction.
To see how the categories are competing for foreign guest nights, we therefore calculated each category’s share of the total foreign guest nights classified into the six categories (12,380,900). Ryokan lifted their share 1.16pt from 6.0% to 7.2%, and resort hotels 1.73pt from 8.4% to 10.2%. Business hotels moved the other way, down 3.12pt from 50.1% to 47.0%. This indicates that inbound travellers’ choice of where to stay is migrating, gradually, from urban lodging-focused formats toward categories that offer experiential value beyond the room itself.
| Facility type | Guest nights | of which foreign | Foreign share | Foreign, YoY | Share of foreign (YoY change) |
|---|---|---|---|---|---|
| Ryokan | 7,704,420 | 886,630 | 11.5% | +3.7% | 7.2% (+1.16pt) |
| Resort hotels | 7,003,480 | 1,258,320 | 18.0% | +4.7% | 10.2% (+1.73pt) |
| Business hotels | 23,425,700 | 5,820,410 | 24.8% | -18.5% | 47.0% (-3.12pt) |
| City hotels | 8,287,250 | 3,802,920 | 45.9% | -12.3% | 30.7% (+0.27pt) |
| Simple lodgings | 2,613,470 | 603,640 | 23.1% | -14.0% | 4.9% (-0.05pt) |
| Company / organization lodgings | 510,720 | 8,980 | 1.8% | +7.9% | 0.1% (+0.01pt) |
| Nationwide (incl. unclassified facility types) | 54,291,520 | 14,507,490 | 26.7% | -9.0% | — |
Source: Japan Tourism Agency, Overnight Travel Statistics Survey (May 2026 second preliminary figures; unit: guest nights); compiled by the HotelBank Editorial Team
Note that these statistics include stays where the facility type is unclassified. For May 2026, the six categories sum to 49,545,040 guest nights against a national total of 54,291,520, leaving 8.7% unclassified. For foreign travellers, the six categories sum to 12,380,900 against a national total of 14,507,490, so unclassified accounts for 14.7%. Shares must therefore be read as the breakdown of the portion for which the facility type is known. It is also worth remembering that preliminary and final figures can differ: category-level numbers are revised between the two releases, so preliminary-stage values are best read with an allowance for a certain revision range.
June preliminary figures show occupancy diverging — only ryokan beat the prior year
For the more recent June 2026 release (first preliminary figures), the foreign breakdown by facility type has not yet been published. Guest nights and room occupancy rates, however, are available by category. June 2026 guest nights totalled 46,775,820 nationwide (-6.5% year on year), of which 12,512,800 were foreign guest nights (-11.9%), and the overall room occupancy rate was 56.2% (-2.6pt year on year).
By category, room occupancy stood at 70.9% for business hotels (-1.9pt year on year), 69.1% for city hotels (-3.4pt), 50.4% for resort hotels (-0.2pt), 35.3% for ryokan (+0.3pt), 23.0% for simple lodgings (-5.2pt) and 27.8% for company and organization lodging facilities. Ryokan were the only category above the prior year; in May they had also gained, up 3.0pt, alongside resort hotels at +4.1pt. On guest nights too, ryokan grew to 6,257,520 in June (+12.3% year on year) and resort hotels to 5,770,710 (+2.3%).
| Facility type | Guest nights (June) | YoY | Room occupancy (June) | YoY change | Room occupancy (May) |
|---|---|---|---|---|---|
| Ryokan | 6,257,520 | +12.3% | 35.3% | +0.3pt | 41.5% |
| Resort hotels | 5,770,710 | +2.3% | 50.4% | -0.2pt | 58.4% |
| Business hotels | 20,299,450 | -15.0% | 70.9% | -1.9pt | 74.5% |
| City hotels | 7,930,620 | -6.4% | 69.1% | -3.4pt | 73.0% |
| Simple lodgings | 2,168,180 | -12.7% | 23.0% | -5.2pt | 29.4% |
| Company / organization lodgings | 605,280 | +52.3% | 27.8% | — | — |
| Nationwide | 46,775,820 | -6.5% | 56.2% | -2.6pt | 61.0% |
Source: Japan Tourism Agency, Overnight Travel Statistics Survey (June 2026 first preliminary figures / May 2026 second preliminary figures; unit: guest nights); compiled by the HotelBank Editorial Team
One caveat applies to how year-on-year comparisons should be read. To improve statistical accuracy, the survey changed its stratification criterion from number of employees to number of rooms, starting with the January 2026 survey. The Japan Tourism Agency itself states explicitly that year-on-year ratios and year-on-year differences may include effects from this revision. Large rates of change such as +12.3% for ryokan or -15.0% for business hotels may therefore contain a component driven by the change in how the population is captured, on top of genuine demand movement. Reading the relative ranking and direction across categories — rather than the absolute year-on-year values — is the safer approach.
Why official statistics and our own measurement diverge by more than 40pt
From here we set out the market data MetroEngines Research observed for the same month of June 2026. Aggregating OTA-listed inventory across all 47 prefectures, estimated occupancy across all properties was 86.0% (covering 21,984 properties and 1,334,735 rooms). That sits roughly 30pt above the Japan Tourism Agency’s overall figure of 56.2%. The gap is not a question of one number being wrong — it stems from the two measuring different things.
Source: Japan Tourism Agency, Overnight Travel Statistics Survey (June 2026 first preliminary figures) / MetroEngines Research (June 2026, 47-prefecture aggregation); compiled by the HotelBank Editorial Team
There are three main reasons for the gap. First, the denominators differ. The Agency’s room occupancy rate uses all rooms a property holds as the denominator, whereas our estimated occupancy uses the inventory listed for sale on OTAs. Hotels and ryokan typically allocate only a portion of their total rooms to OTAs; rooms routed to direct sales, corporate contracts or travel-agency allotments never enter our denominator. This allocation reality is examined in Median 39.2% of Rooms Online — Allocation Across 12,941 Hotels.
Second, the populations differ. The Agency’s survey takes all registered lodging facilities as its population, including small ryokan and company or organization lodgings that are not listed on OTAs at all. As of June 2026 we could confirm activity on OTAs for 21,984 properties — a fundamentally different net. Third, closed days are treated differently. Regular closing days and long-term closures are in some cases still counted as available days in the denominator of official statistics, whereas on an OTA-listed-inventory basis nothing is listed on those days, so they drop out of the denominator entirely.
All three factors push the gap wider for categories that are smaller in scale, less dependent on OTAs and more likely to close. In practice the gap is widest for ryokan, where the official 35.3% sits 45.1pt below our estimate of 80.4%. Resort hotels show 50.4% against 82.0%, a gap of 31.6pt; city hotels 69.1% against 88.0%, a gap of 18.9pt; and business hotels 70.9% against 86.9%, a gap of 16.0pt. The closer a category is to the urban format, the narrower the gap. The size of the gap itself can be read as a reflection of how thick that category’s non-OTA sales channels are and how its available days are structured.
There is also a point on which the two agree. The ordering across categories — business and city hotels running high, resort hotels and ryokan relatively soft — is identical in the official statistics and in our own measurement. Levels cannot be compared; direction can. That is the dividing line for how each source should be used in practice.
Estimated settled ADR by category — ryokan ¥12,500, business hotels ¥8,000
Measured values for the same category framework are also worth setting out on price. Estimated settled ADR for June 2026 (nationwide, prefecture-level medians weighted by property count) was approximately ¥14,100 for resort hotels (N=1,586 properties), ¥12,500 for ryokan (N=6,779), ¥11,900 for city hotels (N=1,113) and ¥8,000 for business hotels (N=7,402). The May figures were approximately ¥16,800, ¥14,900, ¥13,900 and ¥9,200 respectively.
Source: MetroEngines Research; compiled by the HotelBank Editorial Team
Year on year, May was positive across every category — ryokan +1.1%, resort hotels +4.8%, business hotels +1.8% and city hotels +0.2% — while June turned negative across the board, at -5.2% for ryokan, -2.9% for resort hotels, -3.5% for business hotels and -7.7% for city hotels. This aligns with the -6.5% fall in June guest nights: the supply-demand phase changed distinctly between May and June. A finer breakdown of ADR year-on-year distribution by prefecture and category is covered in H1 2026 ADR YoY: 16 Prefectures Aligned, 31 Split Across 4 Categories.
This is where the opportunity lies. City hotels, with the highest foreign share at 45.9%, also posted the steepest June ADR decline of the four categories at -7.7%. With the inbound mix shifting from China toward the United States, Taiwan and South Korea, reconfiguring the product around that guest mix — length of stay, meal inclusion, check-in timing — creates room to recover rate. Ryokan present the mirror image: foreign volume up 3.7% while June ADR fell 5.2%, meaning demand has grown but has not yet been translated into rate. Demand leading and rate catching up is the most workable phase in which to build a staged pricing approach.
| Category (our classification) | Estimated settled ADR (June) | YoY | Estimated occupancy (June) | Properties covered | Rooms covered |
|---|---|---|---|---|---|
| Ryokan | ¥12,500 | -5.2% | 80.4% | 5,253 | 136,581 |
| Resort hotels | ¥14,100 | -2.9% | 82.0% | 1,346 | 113,464 |
| Business hotels | ¥8,000 | -3.5% | 86.9% | 6,608 | 778,239 |
| City hotels | ¥11,900 | -7.7% | 88.0% | 1,052 | 191,622 |
| Capsule hotels (reference) | ¥4,400 | — | 96.0% | 76 | 9,462 |
| All properties | — | — | 86.0% | 21,984 | 1,334,735 |
Source: MetroEngines Research (June 2026, 47-prefecture aggregation); compiled by the HotelBank Editorial Team. The N for ADR (properties covered by the estimated settled ADR calculation) is 6,779 for ryokan, 1,586 for resort hotels, 7,402 for business hotels, 1,113 for city hotels and 95 for capsule hotels.
Capsule hotels post the highest estimated occupancy of any category at 96.0% (June 2026, 47-prefecture aggregation), but the sample is small at 76 properties and 9,462 rooms, and the Japan Tourism Agency’s “simple lodgings” category broadly covers guest houses, hostels and minshuku, so the two are not the same universe. The figure should be treated as a reference value.
Simple lodgings — positioned as the receiver of budget demand
As of May 2026, simple lodgings recorded 2,613,470 guest nights, of which 603,640 were foreign, putting the foreign share at 23.1% — close to the 24.8% of business hotels. In terms of the density with which they take in inbound visitors, they are on par with urban business hotels. Room occupancy, however, was the lowest of any category at 29.4% in May and 23.0% in June, with the scale of the headroom showing directly in the numbers.
Holding their share as the receiver of budget demand while retaining clear headroom on occupancy is the consistent picture for this category. Including the spread of supply formats such as whole-house rentals and vacant-home conversion, the breadth of the demand base makes this an area with considerable freedom in operational design.
Conclusion — where inbound visitors stay is on the move
As of May 2026, inbound guest nights are most concentrated in business hotels (47.0% of foreign guest nights for which the facility type is identified), while the highest density of foreign travellers within a category’s stays is at city hotels (45.9%). That structure itself has not changed. What has changed is that the breakdown has started to move. With foreign guest nights nationwide down 9.0% year on year, ryokan (+3.7%) and resort hotels (+4.7%) grew in absolute terms and lifted their category shares by 1.16pt and 1.73pt respectively.
This movement is consistent with the shift in nationality mix. When the United States, Taiwan and South Korea hold positive among the top markets while China undergoes a substantial adjustment — the starting point of that adjustment is tracked in China -60% Shock: Q1 2026 Inbound Shift and Japan Hotel Market Realignment — part of the demand that had been heavily allocated to urban lodging-focused formats moves to categories offering experiential value. For ryokan and resort hotels, with occupancy on the official basis still at 35.3% and 50.4% and considerable room left, there is headroom to translate that additional demand into rate.
And official statistics and our own measurement should be reconciled on ordering and direction, not on levels. The Agency’s room occupancy rate measures the macro reality with all rooms and all properties in the denominator; OTA-listed-inventory-based estimated occupancy measures the speed at which inventory is absorbed at the point of sale. Set side by side, the structure of the gap itself — 45.1pt for ryokan, 16.0pt for business hotels — becomes information about the thickness of each category’s sales channels. Reading the market with an understanding of the distance between the two views gives a sharper outline than relying on either one alone.
Related reading
- June 2026 Occupancy 56.2%: Guest-Nights per Room in 47 Prefectures
- Lodging Is 37% of Japan’s ¥2.51T Inbound Spend: ¥10,446 vs Real ADR
- JTA 2025 Annual Stats Deep Dive: Japanese -3.8%, Foreign +8.2% Structural Shift
- US Now Tops Japan Inbound at 13.5% — Prefecture Host Map 2026
- Median 39.2% of Rooms Online — Allocation Across 12,941 Hotels
- H1 2026 ADR YoY: 16 Prefectures Aligned, 31 Split Across 4 Categories
- China -60% Shock: Q1 2026 Inbound Shift and Japan Hotel Market Realignment
References and Sources
■ Government statistics and public data
- Japan Tourism Agency, “Overnight Travel Statistics Survey (May 2026 second preliminary figures; June 2026 first preliminary figures)” (31 July 2026)
- Japan Tourism Agency, Overnight Travel Statistics Survey — list of statistical tables (May 2026 second preliminary results, June 2026 first preliminary results, 2025 annual final results)
- Japan Tourism Agency, Overnight Travel Statistics Survey: Table 4 (guest nights / foreign guest nights by facility location and lodging facility type, six categories), Table 8 (room occupancy rate), Reference Table 1 (foreign guest nights by nationality / region of origin)
- Japan Tourism Agency, “On the change to the stratification criteria of the Overnight Travel Statistics Survey”
■ Data sources
Official statistics are from the Japan Tourism Agency’s Overnight Travel Statistics Survey: Table 4 (guest nights / foreign guest nights by facility type, six categories), Table 8 (room occupancy rate) and Reference Table 1 (by nationality / region of origin). May 2026 uses second preliminary values, June 2026 uses first preliminary values and 2025 uses final values. Market measurement is from MetroEngines Research: estimated settled ADR (May and June 2026) and OTA-listed-inventory-based estimated occupancy (June 2026, 47-prefecture aggregation, 21,984 properties and 1,334,735 rooms).
■ Calculation assumptions
Foreign share = foreign guest nights divided by total guest nights. Category shares use the sum of foreign guest nights across the six identified facility types as the denominator (12,380,900 for May 2026); the national total including unclassified facility types is not used as a denominator. Nationwide estimated settled ADR is calculated as prefecture-level medians weighted by the number of properties covered, and estimated occupancy as prefecture-level values weighted by room count. Year-on-year ratios and year-on-year differences are all comparisons against prior-year values on the same definition.
■ Limitations and caveats
(1) Both May and June 2026 are preliminary values, and category-level figures may be revised against the final values. (2) The survey changed its stratification criterion from number of employees to number of rooms starting with the January 2026 survey, and year-on-year ratios and differences may include that effect. (3) Unclassified facility types account for 8.7% of guest nights and 14.7% of foreign guest nights, so shares must be read as the breakdown of the portion for which the facility type is known. (4) Because the Agency’s room occupancy rate uses all rooms as the denominator while OTA-listed-inventory-based estimated occupancy uses listed inventory, the levels of the two cannot be compared. (5) Capsule hotels are a reference value given the small sample of 76 properties and 9,462 rooms, and do not match the coverage of the Agency’s “simple lodgings” category.
■ Market data
- MetroEngines Research — estimated settled ADR (May and June 2026, 47 prefectures x 5 categories), OTA-listed-inventory-based estimated occupancy (June 2026, 21,984 properties and 1,334,735 rooms)