

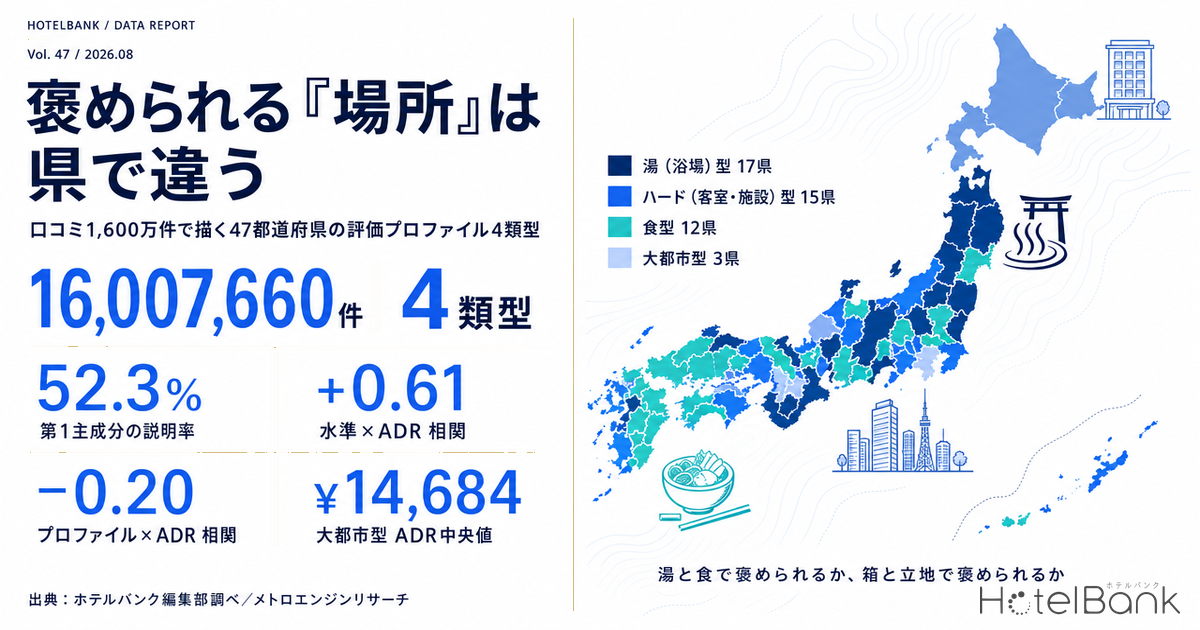
Line up guest review scores for accommodations across Japan, and most analyses collapse into a single yardstick: which prefecture scores highest. But the guest experience is not one-dimensional. A 4.2 earned on the strength of the bath and a 4.2 earned on the strength of location are entirely different businesses. For this article we pulled the guest review baseline for all 47 prefectures and decomposed each prefecture’s ratings into “how much praise it receives” (level) and “where the praise lands” (relative profile). What emerged from 16,007,660 reviews (N=47 prefectures) is that the 47 prefectures fall into four clearly distinguishable types — and that “where the praise lands” has almost nothing to do with room rates.
Metric Definitions Used in This Article
- Review baseline: For each prefecture, the distribution of property-level scores (mean, median, 1st quartile, 3rd quartile) aggregated by review category from guest reviews. Aggregation period is the most recent 24 months, with a reference date of August 1, 2026. Scores are on a 5-point scale.
- Relative profile: The residual obtained by subtracting both “that prefecture’s overall level” and “that category’s national level” from each prefecture’s category score (double centering), then dividing by the national standard deviation for each category. A positive value indicates an axis that is relatively strongly rated within that prefecture; a negative value indicates an axis with relative headroom. It is a metric for comparing the balance of ratings within a prefecture, not for ranking score levels between prefectures.
- ADR (average daily rate): An estimated settled rate (tax-exclusive equivalent) calculated by applying category-specific adjustment coefficients to the lowest published plan rate each property lists on OTAs and other channels (double occupancy, per-room rate, tax-inclusive). Cross-checked against property-level actuals disclosed by listed hotel REITs, the median error is roughly 7%. These are estimates and differ from each property’s actual transaction prices and accounting figures. Area-level ADR is the median across covered properties (the level of a standard property in the area). This article uses the 12-month average from July 2025 to June 2026.
- Occupancy rate: Occupancy figures cited in this article are published values from the Japan Tourism Agency’s Accommodation Travel Statistics Survey, and are calculated on a different basis from OCC estimated from OTA sales inventory.
- Data sources: Reviews = HotelBank Editorial Team research / ADR = MetroEngines Research
- — The 47 prefectures split into four types — Bath type: 17 prefectures; Hardware (rooms & facilities) type: 15; Food type: 12; Metropolitan type: 3. Result of clustering on eight-axis relative profiles.
- — The first principal component alone explains 52.3% — A single axis — praised for bath and food, or praised for the building and location — is the dividing line in Japan’s accommodation ratings.
- — How much praise you receive tracks ADR at +0.61 — The eight-axis average score and estimated settled ADR show a clear positive correlation. Accumulating ratings does move rates.
- — Where the praise lands is essentially unrelated to ADR, at −0.20 — The choice of which axis you build ratings on does not determine the ceiling of the price band you can reach.
- — Bathroom is the lowest nationally at 3.958, and simultaneously has the widest prefectural spread at 0.534 points — The axis where a prefecture’s character shows most clearly. The gap between Gunma at 4.233 and Fukuoka at 3.699 is larger than for any other category.
Food is the most praised nationally; bathroom has the most headroom
First, the national baseline that underpins everything. Taking a simple average of each of the 47 prefectures’ category-level mean scores, the highest is Food at 4.314, followed by Staff at 4.268 and Breakfast at 4.213. At the low end are Bathroom at 3.958, Facilities at 3.972 and Rooms at 4.049. Japanese accommodations share a common national structure: what is served and the people serving it are rated highly, while the building itself rates below them.
Source: HotelBank Editorial Team research (aggregation of guest reviews, N=47 prefectures, 16,007,660 reviews, most recent 24 months)
What matters here is less the average itself than the dispersion. Bathroom’s standard deviation across prefectures is 0.144, by far the largest of any category and roughly 1.5 times that of second-placed Food (0.097). Between the highest, Gunma at 4.233, and the lowest, Fukuoka at 3.699, lies a gap of 0.534 points — wider than the prefectural spread of any other category. In other words, Bathroom has the lowest national average, yet is simultaneously the axis where a prefecture’s character shows most clearly. In prefectures with hot spring destinations, large communal baths and open-air baths draw high ratings; in city-centric prefectures, the in-room unit bath becomes the focus of evaluation. The same word “bathroom” points to entirely different facilities depending on the prefecture.
This analysis covers ten categories, but among them Amenities falls below 30 covered properties in 18 of the 47 prefectures, leaving a thin base. It is therefore excluded from the type analysis below and shown only as a national average for reference. Service and Staff also showed a tendency for ratings to skew toward one axis or the other depending on the prefecture (a correlation was observed between the ratio of covered property counts for the two and the difference in their relative scores), so for the type analysis the two were merged into a single axis, “Hospitality”, weighted by property count.
| Review category | National average (simple avg. of 47 prefectures) |
Covered properties (total) |
Reviews | Properties in smallest prefecture |
Prefectures with fewer than 30 |
|---|---|---|---|---|---|
| Food | 4.314 | 9,729 | 1,014,248 | 65 | 0 |
| Staff | 4.268 | 10,153 | 842,695 | 79 | 0 |
| Breakfast | 4.213 | 10,316 | 914,000 | 72 | 0 |
| Location | 4.198 | 15,216 | 2,328,929 | 112 | 0 |
| Service | 4.151 | 16,207 | 2,924,754 | 116 | 0 |
| Cleanliness | 4.125 | 12,733 | 1,537,404 | 94 | 0 |
| Amenities | 4.095 | 3,259 | 153,904 | 13 | 18 |
| Rooms | 4.049 | 16,581 | 3,383,981 | 122 | 0 |
| Facilities | 3.972 | 10,517 | 1,067,595 | 78 | 0 |
| Bathroom | 3.958 | 12,558 | 1,840,150 | 98 | 0 |
Source: HotelBank Editorial Team research (aggregation of guest reviews)
Measuring “where the praise lands” — the relative profile, stripped of level
Rank prefectures by raw scores and the top of the list fills with tourism prefectures: Kyoto (eight-axis average 4.298), Oita (4.269), Nara (4.253). That is a statement about level — that a prefecture’s properties are highly rated overall — and useful in its own right, but management decisions require one further decomposition. Every prefecture, without exception, has axes that are relatively strong within it and axes with relative headroom.
So from each prefecture’s category scores we subtracted both that prefecture’s overall level and that category’s national level. What remains is the upside or downside specific to that prefecture on that axis alone. The vector of these residuals across the eight axes is that prefecture’s relative profile.
Running principal component analysis on this eight-axis data, the first principal component alone explained 52.3% of total variance. Its content is unambiguous: on the positive side sit Food (+0.41), Bathroom (+0.36) and Breakfast (+0.35); on the negative side, Rooms (−0.44), Facilities (−0.39) and Location (−0.39). In short, the largest single divide in Japan’s accommodation ratings is whether you are praised for bath and food, or for the building and the location. This can be read as the difference between ryokan/hot-spring-style stays and city hotel stays showing up directly as a difference in rating axes.
The 47 prefectures split into four types
Clustering the 47 prefectures on their eight-axis relative profiles produced four highly interpretable types. Here is the overall picture.
Source: HotelBank Editorial Team research (aggregation of guest reviews)
| Type | Prefectures | Relative strengths (top 3 axes) | Relative headroom | Eight-axis avg. | Median ADR | ADR range |
|---|---|---|---|---|---|---|
| Metropolitan type | 3 | Cleanliness, Rooms, Location | Food, Breakfast | 4.142 | ¥14,684 | ¥11,048–¥16,719 |
| Hardware (rooms & facilities) type | 15 | Rooms, Facilities, Location | Breakfast, Food | 4.092 | ¥8,659 | ¥6,950–¥14,291 |
| Food type | 12 | Food, Breakfast, Hospitality | Cleanliness, Rooms | 4.106 | ¥8,269 | ¥6,417–¥13,410 |
| Bath type | 17 | Bathroom, Breakfast, Food | Location, Rooms | 4.174 | ¥10,650 | ¥7,213–¥15,018 |
Source: HotelBank Editorial Team research (review aggregation) / MetroEngines Research (estimated settled ADR)
The types separate cleanly on the map
Plotting the four types on a map makes their geographic clustering visible. Bath type concentrates in the hot spring belts running from Tohoku through northern Kanto, Shinetsu and Chubu, plus central Kyushu. Hardware (rooms & facilities) type is distributed across Hokkaido and Okinawa and the urban areas of the Seto Inland Sea and Hokuriku. Food type is common from the Kii Peninsula through San’in, Shikoku and southern Kyushu — the country’s well-known ingredient-producing regions.
Source: HotelBank Editorial Team research (review aggregation) / MetroEngines Research (estimated settled ADR)
Bath type — 17 prefectures, the broadest type
The largest type is Bath type, with 17 prefectures. Oita, Shizuoka, Gunma, Nagano, Gifu, Tochigi, Yamagata, Fukushima, Iwate, Akita and other prefectures with well-known hot spring destinations fall here almost without exception. In the relative profile, Bathroom stands out at +0.99, followed by Breakfast (+0.40) and Food (+0.30). Location (−0.94) and Rooms (−0.74), meanwhile, carry relative headroom. Hot spring properties are often located away from station fronts and downtown districts, and ratings gather around shared experiences — the large communal bath and the meals — rather than the guest room on its own. On how properties offset that locational handicap, Hotel Shuttle Reviews: Airport Shuttle vs Onsen Station Pickup Types digs into the moves available on the hot spring side.
Worth noting is that this type’s median estimated settled ADR of ¥10,700 places it second only to Metropolitan type. Its eight-axis average score of 4.174 is also the highest of the four types. Prefectures where ratings gather around bath and food sit at the top on both rate and satisfaction, despite lacking the locational advantage of the big cities. This suggests that in domains where the experience itself is the product, a locational handicap has little bearing on price.
Metropolitan type — 3 prefectures, with ratings centered on building and cleanliness
Kyoto, Tokyo and Osaka alone form an independent type. Their relative profile is strong across the board on Cleanliness (+2.27), Rooms (+2.01), Location (+1.85) and Facilities (+1.76), while Food (−2.62), Breakfast (−1.73) and Bathroom (−1.60) retain relative headroom. The amplitude is an order of magnitude larger than in the other 44 prefectures, which shows just how far these three depart from the national average picture.
Median estimated settled ADR is ¥14,700, the highest of the four types. Within it, though, the spread is wide: Kyoto ¥16,700, Tokyo ¥14,700, Osaka ¥11,000. Room-only and breakfast-only stays dominate, and stays where dining is not completed on-property are the norm — a structure that likely sits behind the relative weakness of the food axis. Turned around, properties in these three prefectures that can build up ratings for on-property dining can occupy a position that is scarce even by national standards.
Hardware type (15) and Food type (12) — two characters splitting the mid price band
The remaining 27 prefectures divide into two types whose median estimated settled ADR sits neck and neck in the ¥8,000s. Hardware (rooms & facilities) type has 15 prefectures, relatively strong on Rooms (+0.81), Facilities (+0.66) and Location (+0.53). Kanagawa, Fukuoka, Okinawa, Ishikawa, Hokkaido, Aichi and Hiroshima line up here — prefectures anchored by regional core cities and resort hubs. Many are areas where recent openings and renovations have been concentrated, and the newness of buildings and rooms appears to be feeding through into ratings.
Food type has 12 prefectures, relatively strong on Food (+0.90), Breakfast (+0.67) and Hospitality (+0.22). Nara, Mie, Fukui, Wakayama, Tottori, Kochi, Miyazaki, Kagoshima and Tokushima — prefectures known as ingredient-producing regions — are at its center. The highest food score in the country is Nara’s 4.481, and the highest breakfast score is likewise Nara’s 4.372, both national number ones. This type carries relative headroom on Cleanliness (−0.86) and Rooms (−0.47), a state in which food ratings have accumulated ahead of the rest.
The core finding — “how much praise” tracks price, “where the praise lands” does not
The most telling result of the analysis so far is that level and profile behave completely differently with respect to price. The correlation coefficient between the eight-axis average score (how much praise you receive) and estimated settled ADR is +0.61, a clear positive relationship. The correlation between the first principal component (praised for bath and food, or for building and location) and ADR, by contrast, stops at −0.20 — effectively no relationship at all.
Source: HotelBank Editorial Team research (review aggregation) / MetroEngines Research (estimated settled ADR)
What these two figures mean is operationally significant. Accumulating ratings does move price, but the choice of which axis you accumulate them on does not set the ceiling. A prefecture praised for its baths, one praised for its buildings and one praised for its food can all reach the same price band, provided the level is high. How much of the rating level remains unconverted into price does vary by prefecture, and that uncaptured portion is laid out prefecture by prefecture in Listed vs Settled ADR Gap: Japan’s 46-Prefecture Upside Map 2026. Indeed, Bath type Oita sits at ¥15,000, the second-highest ADR level nationally, above Metropolitan type Osaka (¥11,000). Food type Nara, at ¥13,400, also exceeds most of the Hardware type prefectures.
Flip that around and it also means there is no need to force your own prefecture’s or property’s winning formula to match another prefecture’s type. The return on investment for a hot spring property chasing city-hotel-grade location ratings is low; digging deeper into an axis where relative strength is already established is likely the more efficient route to lifting the level.
Source: HotelBank Editorial Team research (review aggregation) / MetroEngines Research (estimated settled ADR)
Where each prefecture’s relative headroom lies
The table below lists all 47 prefectures with their type, eight-axis average score, most relatively strong axis, axis with the most relative headroom, estimated settled ADR and sample base. Note that relative profile values indicate balance within a prefecture and do not imply superiority or inferiority of scores between prefectures. For an example of the same thinking applied at property level, A 4.1 Review Score Is Average, Not a Strength: Sapporo Price Position is a useful reference.
| Prefecture | Type | Eight-axis avg. | Most relatively strong axis | Relative headroom | Estimated settled ADR | Covered properties | Reviews |
|---|---|---|---|---|---|---|---|
| Kyoto | Metropolitan type | 4.298 | Cleanliness (+2.49) | Food (-1.63) | ¥16,719 | 610 | 459,696 |
| Oita | Bath type | 4.269 | Bathroom (+1.39) | Cleanliness (-1.81) | ¥15,018 | 423 | 283,969 |
| Nara | Food type | 4.253 | Breakfast (+1.08) | Facilities (-1.82) | ¥13,410 | 145 | 96,843 |
| Shizuoka | Bath type | 4.221 | Bathroom (+1.03) | Location (-1.65) | ¥13,589 | 935 | 927,607 |
| Kumamoto | Bath type | 4.213 | Bathroom (+1.23) | Location (-1.15) | ¥10,665 | 364 | 264,842 |
| Yamanashi | Hardware type | 4.209 | Hospitality (+2.01) | Breakfast (-1.58) | ¥11,835 | 414 | 276,830 |
| Nagano | Bath type | 4.208 | Bathroom (+0.82) | Facilities (-1.58) | ¥12,079 | 1,077 | 538,599 |
| Gifu | Bath type | 4.201 | Bathroom (+0.75) | Facilities (-0.85) | ¥11,345 | 380 | 269,680 |
| Gunma | Bath type | 4.198 | Bathroom (+2.20) | Location (-1.61) | ¥12,097 | 451 | 382,833 |
| Toyama | Bath type | 4.186 | Breakfast (+0.64) | Hospitality (-2.34) | ¥7,571 | 165 | 143,830 |
| Ishikawa | Hardware type | 4.183 | Facilities (+0.57) | Food (-0.71) | ¥11,259 | 215 | 199,499 |
| Hyogo | Bath type | 4.175 | Food (+0.91) | Hospitality (-1.75) | ¥13,367 | 543 | 534,189 |
| Yamagata | Bath type | 4.171 | Bathroom (+1.63) | Facilities (-1.20) | ¥9,669 | 290 | 208,833 |
| Shimane | Bath type | 4.170 | Breakfast (+0.78) | Rooms (-1.07) | ¥10,471 | 154 | 147,056 |
| Saga | Bath type | 4.163 | Breakfast (+1.24) | Location (-1.31) | ¥12,230 | 122 | 115,637 |
| Okinawa | Hardware type | 4.161 | Rooms (+2.03) | Bathroom (-1.69) | ¥11,717 | 556 | 438,715 |
| Kanagawa | Hardware type | 4.159 | Facilities (+1.09) | Breakfast (-1.74) | ¥14,291 | 523 | 680,762 |
| Wakayama | Food type | 4.156 | Bathroom (+0.99) | Cleanliness (-2.48) | ¥9,744 | 236 | 204,042 |
| Niigata | Bath type | 4.155 | Breakfast (+1.65) | Rooms (-1.51) | ¥9,756 | 470 | 317,312 |
| Tochigi | Bath type | 4.149 | Bathroom (+1.32) | Facilities (-1.43) | ¥10,650 | 406 | 357,678 |
| Kagoshima | Food type | 4.148 | Food (+0.52) | Cleanliness (-1.14) | ¥6,861 | 325 | 215,376 |
| Tottori | Food type | 4.147 | Breakfast (+1.06) | Rooms (-1.32) | ¥8,645 | 135 | 143,734 |
| Fukushima | Bath type | 4.147 | Bathroom (+1.36) | Location (-1.20) | ¥7,521 | 411 | 333,339 |
| Mie | Food type | 4.127 | Hospitality (+2.55) | Rooms (-0.90) | ¥11,726 | 347 | 315,081 |
| Fukui | Food type | 4.125 | Breakfast (+2.30) | Facilities (-2.33) | ¥11,593 | 195 | 125,102 |
| Chiba | Food type | 4.123 | Breakfast (+0.94) | Hospitality (-0.71) | ¥10,220 | 419 | 608,303 |
| Akita | Bath type | 4.118 | Bathroom (+1.42) | Hospitality (-2.00) | ¥7,943 | 173 | 121,441 |
| Iwate | Bath type | 4.118 | Bathroom (+1.29) | Rooms (-1.32) | ¥7,213 | 233 | 190,781 |
| Tokushima | Food type | 4.118 | Food (+1.29) | Hospitality (-1.31) | ¥6,417 | 123 | 100,765 |
| Ehime | Hardware type | 4.117 | Facilities (+0.87) | Breakfast (-1.05) | ¥6,950 | 197 | 182,303 |
| Hokkaido | Hardware type | 4.107 | Facilities (+0.97) | Breakfast (-1.25) | ¥10,123 | 908 | 1,038,641 |
| Miyagi | Bath type | 4.103 | Cleanliness (+0.75) | Rooms (-0.80) | ¥9,255 | 285 | 387,176 |
| Nagasaki | Hardware type | 4.083 | Facilities (+0.74) | Breakfast (-1.02) | ¥7,854 | 241 | 236,014 |
| Tokyo | Metropolitan type | 4.082 | Location (+2.61) | Food (-3.02) | ¥14,684 | 990 | 1,611,362 |
| Shiga | Hardware type | 4.082 | Rooms (+1.00) | Hospitality (-1.16) | ¥8,259 | 158 | 123,701 |
| Hiroshima | Hardware type | 4.076 | Location (+1.36) | Bathroom (-1.46) | ¥8,659 | 274 | 311,481 |
| Okayama | Hardware type | 4.068 | Rooms (+0.89) | Breakfast (-1.12) | ¥8,336 | 172 | 184,234 |
| Yamaguchi | Food type | 4.060 | Food (+0.84) | Rooms (-0.67) | ¥7,626 | 162 | 165,494 |
| Aomori | Hardware type | 4.055 | Facilities (+1.33) | Hospitality (-0.82) | ¥7,824 | 185 | 171,724 |
| Osaka | Metropolitan type | 4.045 | Rooms (+2.63) | Food (-3.23) | ¥11,048 | 528 | 870,792 |
| Saitama | Hardware type | 4.031 | Cleanliness (+1.55) | Bathroom (-0.53) | ¥8,057 | 173 | 152,271 |
| Kagawa | Hardware type | 4.030 | Location (+1.54) | Bathroom (-0.94) | ¥8,195 | 155 | 156,018 |
| Aichi | Hardware type | 4.028 | Rooms (+0.80) | Bathroom (-0.74) | ¥8,842 | 436 | 498,325 |
| Kochi | Food type | 4.012 | Breakfast (+1.60) | Cleanliness (-2.07) | ¥7,893 | 128 | 114,273 |
| Miyazaki | Food type | 4.007 | Facilities (+1.04) | Cleanliness (-1.00) | ¥6,928 | 151 | 101,061 |
| Ibaraki | Food type | 3.990 | Breakfast (+1.12) | Rooms (-0.96) | ¥6,969 | 243 | 192,226 |
| Fukuoka | Hardware type | 3.987 | Rooms (+1.57) | Food (-1.45) | ¥11,781 | 358 | 508,190 |
Source: HotelBank Editorial Team research (review aggregation) / MetroEngines Research (estimated settled ADR)
* Covered property count is the property count of the review category with the largest base in each prefecture; review count is the total across the ten categories. The eight-axis average is the simple average of Hospitality, Bathroom, Rooms, Facilities, Breakfast, Cleanliness, Location and Food. Figures in parentheses are relative profile values (in standard deviation units).
A few prefectures stand out. Kyoto shows the strongest relative strength in the country on Cleanliness at +2.49, and recorded the highest national score on five of the eight axes (Rooms, Cleanliness, Location, Hospitality, Facilities). Kochi is relatively strong on Breakfast at +1.60 while carrying headroom on Cleanliness (−2.07). Gunma’s Bathroom score of 4.233 is the highest in the country, with the ratings of Kusatsu, Ikaho and Minakami hot springs translating directly into the prefecture’s character. Ibaraki is relatively strong on Breakfast (+1.12), with headroom on Rooms (−0.96).
The wider market context — rating axes in a phase of flat volume
The practical implications of this structural analysis grow larger in the current market environment, where quantitative growth in accommodation demand has paused. According to the Japan Tourism Agency’s Accommodation Travel Statistics Survey, total guest nights in May 2026 were 54.29 million, down 3.2% year on year, and 46.78 million in June, down 6.5% — both below the prior year. Room occupancy was 61.0% in May 2026 and 56.2% in June. (Note that from the January 2026 survey the stratification basis was changed from employee count to room count, and the survey notes that year-on-year comparisons may include the effect of that change.) For calendar year 2025, annual figures were 661.11 million guest nights, up 0.3% year on year, with room occupancy of 61.6%.
When the tailwind of volume weakens, how you build up rate and satisfaction becomes the main battleground for revenue. What this analysis shows is that there are at least four templates for that build-up, and that the ceiling of the price band you can reach does not differ greatly whichever template you choose. What matters is knowing which template your prefecture or property belongs to and concentrating resources on the axes where relative strength is already established.
Assumptions and limitations of this analysis
Finally, some points to keep in mind when reading the figures in this article.
- Review category names are common classifications used for aggregation; which facilities and services they actually refer to varies by prefecture and property category. Bathroom in particular may include shared communal baths in some cases and refer only to in-room bathrooms in others.
- Amenities falls below 30 covered properties in 18 of the 47 prefectures and was therefore excluded from the type analysis. It is shown only as a national average for reference.
- Service and Staff showed a tendency for ratings to skew toward one axis or the other depending on the prefecture, so the two were merged into “Hospitality”, weighted by property count. Treating the two pre-merge axes separately risks misreading an aggregation artifact as a prefecture’s character.
- The relative profile is a metric of balance within a prefecture; a negative value does not mean “rated poorly” but “an axis on which ratings gather relatively less within that prefecture”. For score comparisons between prefectures, use the eight-axis average (level).
- Estimated settled ADR is a model estimate applying category-specific adjustment coefficients to published rates, and differs from actual transaction prices and accounting figures.
- The aggregation base varies widely by prefecture (from Saga’s 122 properties at the low end to Nagano’s 1,077 at the high end). The smaller the base, the larger the influence a small number of properties has on the prefectural average.
- This analysis addresses structure at the prefecture level and is not intended to rank or evaluate individual properties.
How much does the level move if you lift one axis? — a conversion based on the definition
So far we have looked at which axis you are praised on. Finally, let us organize how much “how much praise you receive” (the eight-axis average score) moves when you lift that axis. What follows is not a forecast, but a unit conversion derived by rearranging the definition used in this article — that the eight-axis average is the simple average of eight axis scores. No new observed values are used.
Because the eight-axis average is the simple average of eight axes, moving one axis score by +0.05 points changes the eight-axis average by only +0.05 ÷ 8 = +0.006 points. Widening the improvement to +0.15 and +0.25 points yields contributions to the eight-axis average of +0.019 and +0.031 points respectively.
| Scenario | Improvement per axis | Contribution to eight-axis average | Ratio to the 0.311-point prefectural range |
|---|---|---|---|
| Conservative | +0.05 | +0.006 | 1.9% |
| Mid | +0.15 | +0.019 | 6.1% |
| Aggressive | +0.25 | +0.031 | 10.0% |
The widest prefectural spread in this article was Bathroom’s 0.534 points. Even if that entire gap were moved on a single axis, the contribution to the eight-axis average would be +0.067 points — reaching only 21.5% of the eight-axis average’s prefectural range (Kyoto 4.298 to Fukuoka 3.987 = 0.311 points). The simple arithmetic confirms it: level does not move on one axis.
Number of axes improved × improvement per axis
| Axes improved | +0.05 pt | +0.10 pt | +0.15 pt | +0.20 pt | +0.25 pt |
|---|---|---|---|---|---|
| 1 axis | +0.006 | +0.013 | +0.019 | +0.025 | +0.031 |
| 2 axes | +0.013 | +0.025 | +0.037 | +0.050 | +0.062 |
| 3 axes | +0.019 | +0.038 | +0.056 | +0.075 | +0.094 |
| 4 axes | +0.025 | +0.050 | +0.075 | +0.100 | +0.125 |
| 5 axes | +0.031 | +0.062 | +0.094 | +0.125 | +0.156 |
At the bottom right of the grid, moving five axes by +0.25 points each yields +0.156 points — still only 50.2% of the 0.311-point prefectural range. Even moving all eight axes by +0.25 points gives +0.250 points, short of the prefectural range. Put the other way round, shifting the level (how much praise you receive) by enough to change a prefecture’s ranking requires simultaneous improvement across multiple axes, whereas the profile (where the praise lands) is determined by the allocation of a single axis. The structure this article identified — that how much praise you receive tracks price while where the praise lands does not — is the flip side of that asymmetry. The implication that digging deeper into an axis where relative strength is already established delivers higher investment efficiency is corroborated by this conversion as well.
Conclusion
Decomposing the guest review baseline of all 47 prefectures into level and profile shows that 52.3% of Japan’s accommodation market is explained by a single axis — prefectures praised for bath and food versus prefectures praised for building and location — and that it can be organized into four types: Bath type with 17 prefectures, Hardware (rooms & facilities) type with 15, Food type with 12 and Metropolitan type with 3.
And while how much praise you receive (the eight-axis average score) correlates with estimated settled ADR at +0.61, the correlation between where the praise lands (the relative profile) and ADR was −0.20, essentially none. Accumulating ratings moves price, but there is wide latitude in which axis you accumulate them on. The clearest proof is that Oita reached a top-tier rate through its baths, Nara through its food, and Kyoto through its buildings and cleanliness. Starting from your own prefecture’s or property’s relative profile and extending the axes where strength is already established is likely the highest-return move available.
Related reading
- Welcome Drinks in Guest Reviews — 255 Hotels Across 47 Prefectures
- A 4.1 Review Score Is Average, Not a Strength: Sapporo Price Position
- Hotel Shuttle Reviews: Airport Shuttle vs Onsen Station Pickup Types
- 1,291 Hotels, 31,024 Rooms Above ¥100,000: Japan’s Luxury Map
- Listed vs Settled ADR Gap: Japan’s 46-Prefecture Upside Map 2026
References and sources
■ Data sources
Reviews = HotelBank Editorial Team research. For each of the 47 prefectures we obtained property-level score distributions by review category (mean, median, 1st quartile, 3rd quartile) and the aggregation base. Aggregation period is the most recent 24 months, reference date August 1, 2026, totaling 16,007,660 reviews across ten categories. Estimated settled ADR = MetroEngines Research prefecture-level monthly series, averaged over the 12 months from July 2025 to June 2026. Broader market context uses published figures from the Japan Tourism Agency’s Accommodation Travel Statistics Survey.
■ Calculation assumptions
The relative profile is the residual obtained by subtracting the prefecture mean and the national category mean from the prefecture × category score matrix (double centering), divided by the national standard deviation for each category. Amenities was excluded from the type analysis because covered properties fall below 30 in 18 of the 47 prefectures; Service and Staff were merged into “Hospitality” weighted by covered property count, leaving eight axes for analysis. Types were determined by clustering on the eight-axis relative profiles. Prefecture-level estimated settled ADR is the 12-month average of the monthly series, excluding months with thin coverage where the covered property count fell below 60% of the series median. The conversion tables at the end of this article (Tables 4 and 5) are not forecasts but arithmetic unit conversions derived by rearranging the definition that the eight-axis average is the simple average of eight axes; no new observed values are used.
■ Limitations and caveats
Review category names are common classifications used for aggregation, and the range of facilities and services they actually cover varies by prefecture and property category (Bathroom in particular may mix shared communal baths and in-room bathrooms). The relative profile is a metric of balance within a prefecture; a negative value does not mean “rated poorly” but “an axis on which ratings gather relatively less within that prefecture”. The aggregation base varies widely by prefecture, from 122 properties at the low end to 1,077 at the high end, and prefectures with smaller bases are more susceptible to the influence of a few properties. Estimated settled ADR is a model estimate and differs from actual transaction prices and accounting figures. Both the review aggregation and ADR are snapshots as of the reference date, and figures may be slightly revised on re-aggregation. This analysis addresses structure at the prefecture level and is not intended to rank individual properties.
■ Review and pricing data
- HotelBank Editorial Team research — review baseline for 47 prefectures × 10 review categories (aggregation period: most recent 24 months, reference date August 1, 2026, 16,007,660 reviews in total)
- MetroEngines Research — estimated settled ADR (12-month average, July 2025 to June 2026, prefecture level)
■ Government statistics
- Japan Tourism Agency, “Accommodation Travel Statistics Survey (May 2026 second preliminary report, June 2026 first preliminary report)”
- Japan Tourism Agency, “Accommodation Travel Statistics Survey (April 2026 second preliminary report, May 2026 first preliminary report and 2025 annual figures (final))”