

Guest reviews at accommodation properties are usually discussed in terms of ratings. In day-to-day operations, however, what may matter more than the score is the review count — the accumulated stock. Review counts do not move overnight; they are a variable that can only grow through the compounding of room count and actual stays. In this article we cross-reference the distribution of review counts across 16,576 properties nationwide with estimated settled ADR and inventory sell-through data for 1,643 properties in six prefectures, and examine how the stock of review volume co-exists with rate and sell-through.
Metric Definitions Used in This Article
- Review count: the cumulative number of guest reviews accumulated by each property (HotelBank Editorial Team research). Because rating scores vary in level depending on the aggregating source, this article treats review count alone as the primary variable and does not use scores in the analysis.
- ADR (average daily rate): an estimated settled rate (tax-exclusive equivalent) calculated by applying property-type-specific adjustment coefficients to the lowest published plan level each property lists on OTAs and similar channels (two guests per room, per-room price, tax-inclusive). Cross-checked against property-level disclosures by listed hotel REITs, the median error is approximately 7.5% (approximately 6.0% for business hotels and city hotels). These are estimates and differ from each property’s actual transaction prices and accounting figures. In this article, the monthly average for May–July 2026 is used as each property’s representative value.
- LT (lead time): the number of days until the check-in date. LT7 = 7 days before check-in.
- Remaining-inventory rate: the number of rooms still available on OTAs at a given point in time, divided by total room count (room-based). Calculated on rooms, not on the number of plans.
- Data sources: MetroEngines Research; HotelBank Editorial Team research
- — The median review count is 513 for ryokan versus 4,558 for city hotels — roughly a 9x gap. Most of that difference comes not from popularity but from room count, i.e. capacity to accept guests (N=16,576 properties).
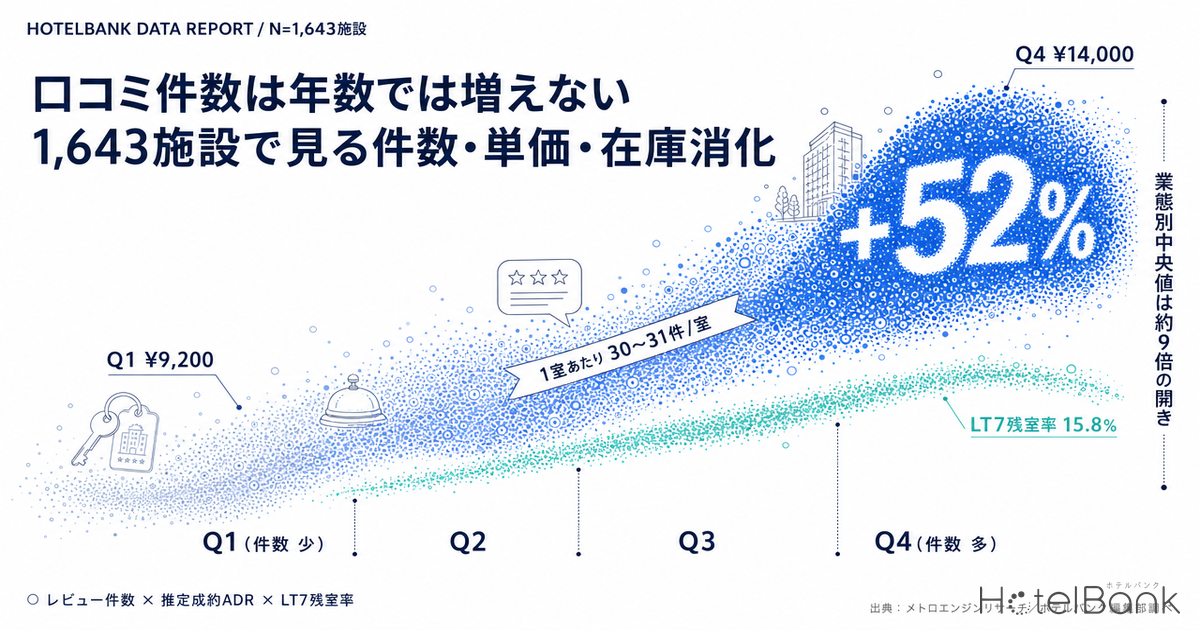
- — Cumulative reviews per room are nearly flat at 30.6–31.3 reviews/room across every opening-year cohort. The rank correlation between years in operation and review count is −0.226: seniority does not translate into a review-count advantage.
- — Splitting review counts into quartiles within strata, the median estimated settled ADR rises in steps from ¥9,200 to ¥14,000 (42 strata, N=1,470 properties; median within-stratum correlation +0.354).
- — Even holding the room-count band constant, ADR on the higher-review side is 35.4–57.1% higher. Co-movement with inventory sell-through is weak, however: the within-stratum correlation for the LT7 remaining-inventory rate is only +0.126.
- — Every observation in this article is a co-occurrence observed at the same time, not causation. Common factors such as scale, location and distribution investment may be lifting both sides.
National Distribution of Review Counts — Medians Differ 9x by Property Type
Start with the national distribution. Aggregating the median cumulative review count by property type across the 16,576 properties in the five main categories identified as currently operating, ryokan sit at 513 reviews against 4,558 for city hotels — a gap of roughly nine times. Deluxe hotels reach a median of 10,890.
This gap is less a “difference in popularity” than, first and foremost, a difference in room count. When the annual number of guest-nights a property can accept differs, the volume of posts generated from those stays differs proportionally. Looking beyond the median at the interquartile range (p25–p75), every property type spans a 3x to 8x range from bottom to top, so dispersion within each type is also large.
Source: compiled from MetroEngines Research and HotelBank Editorial Team research (N=16,576 properties)
| Property type | Properties | p25 | Median | p75 |
|---|---|---|---|---|
| Ryokan | 7,753 | 175 | 513 | 1,359 |
| Resort hotels | 1,224 | 466 | 1,342 | 3,640 |
| Business hotels | 6,387 | 533 | 1,904 | 4,592 |
| City hotels | 1,102 | 1,655 | 4,558 | 10,504 |
| Deluxe hotels | 110 | 3,085 | 10,890 | 18,428 |
Source: compiled from MetroEngines Research and HotelBank Editorial Team research
Reviews per Room Were Nearly Flat Across Every Opening-Year Cohort
If review count were a function of years in operation, older properties would hold the advantage. Yet looking at cumulative reviews per room by opening-year cohort, that intuition does not hold. Properties opened before 1999 (9,870 properties) show 30.6 reviews/room; those opened in 2000–2009 (2,856 properties) 31.2; those opened in 2010–2017 (2,637 properties) 30.6; and even those opened from 2018 onward (508 properties) 31.3. All four cohorts line up at nearly the same level.
In other words, a property with 40 years of operation and one open for eight years carry roughly the same volume of reviews on a per-room basis. This is also the flip side of the fact that review posting itself is concentrated in recent years. Indeed, taking correlations across the 1,643 properties analysed in the six prefectures, the rank correlation between review count and room count is a very strong +0.843, while the rank correlation between review count and years in operation is −0.226 — weakly negative if anything.
For recently opened properties, this structure is actually encouraging news. Because review counts accumulate through the number of times a room is occupied rather than through seniority, a property of the same size can reach a standard level within a few years. Applying the accumulation pace of the 87 business hotels opened from 2018 onward (median 6.41 reviews/room/year), a 105-room property accumulates roughly 670 reviews a year, putting the property-type median (1,904 reviews) about three years away. On the question of when the rate itself starts to lift after opening, New Hotel ADR Ramp-Up: 91 Japan Openings Split Into 4 Pricing Types tracks the trajectory across 91 properties opened in 2025.
Source: compiled from MetroEngines Research and HotelBank Editorial Team research (N=15,871 properties with identifiable room count and opening year)
Review Quartiles and Rate — the Step Pattern Shows Up Clearly on Price
Here is the core question: how do review count, rate and inventory sell-through co-exist? Simply ranking all properties by review count would mix together differences in property type, area and opening year. So we built strata by prefecture × property type × opening-year cohort, split review counts into quartiles within each stratum, and compared the metrics quartile by quartile (42 strata with at least 8 properties each; 1,470 properties).
The result was clear. The median estimated settled ADR rises in steps: ¥9,200 in Q1 (lowest review counts), ¥11,500 in Q2, ¥12,800 in Q3 and ¥14,000 in Q4 (highest). The median within-stratum rank correlation (Spearman) is +0.354, and 38 of the 42 strata point in the positive direction.
On the inventory sell-through side, by contrast, the relationship is far looser. The median remaining-inventory rate 7 days before check-in is 21.3% in Q1 and 15.8% in Q4 — the same direction — but the median within-stratum correlation is only +0.126 (32 of 42 strata positive). Going back to LT30, it thins further to +0.086. Review volume co-exists strongly with rate and weakly with inventory sell-through — that is the first observation.
Source: compiled from MetroEngines Research and HotelBank Editorial Team research (42 strata, N=1,470 properties)
| Review quartile (within stratum) | Properties | Median reviews | Rooms | ADR | LT7 remaining | LT30 remaining |
|---|---|---|---|---|---|---|
| Q1 (fewest reviews) | 383 | 631 | 27 | ¥9,200 | 21.3% | 34.0% |
| Q2 | 363 | 2,238 | 57 | ¥11,500 | 20.0% | 31.6% |
| Q3 | 373 | 4,292 | 95 | ¥12,800 | 19.6% | 33.4% |
| Q4 (most reviews) | 351 | 9,618 | 150 | ¥14,000 | 15.8% | 30.5% |
Source: compiled from MetroEngines Research and HotelBank Editorial Team research
Hold Size Constant and the Rate Gap Still Remains
An obvious question arises here. In the quartile split, Q4 has a median room count of 150 while Q1 has 27. Isn’t the rate staircase simply confounding — “larger properties happen to sit in the higher-rate urban bands”?
So we cut the data by room-count band and compared the top half against the bottom half of review counts within each band. For properties with 29 rooms or fewer (548 properties), ADR on the higher-review side was 57.1% above the lower-review side; for 30–79 rooms (388 properties) 39.2%; for 80–149 rooms (365 properties) 54.5%; and for 150 rooms or more (342 properties) 35.4%. The gap remains even with size held constant, and the direction was consistent across every band.
Inventory sell-through moves in the same direction. The LT7 remaining-inventory rate is 25.0% versus 20.5% for properties with 29 rooms or fewer, and 19.0% versus 13.0% for those with 150 rooms or more — a few points lower on the higher-review side. The size of the gap is small compared with rate, however, and in the 30–79 room band it was essentially nil at 18.2% versus 17.9%. It is more natural to read review count as a variable that co-exists with “selling at a higher rate” than with “selling earlier”.
Note again that these are strictly relationships observed at the same time, and do not demonstrate that increasing review counts causes rates to rise. It is entirely possible that common background factors — higher-rate properties being able to invest more in advertising and distribution, better locations, larger scale — are lifting both. For a concrete walkthrough of how to audit price position by cross-referencing the distribution of reviews with estimated settled ADR rather than scores, see A 4.1 Review Score Is Average, Not a Strength: Sapporo Price Position.
Source: compiled from MetroEngines Research and HotelBank Editorial Team research (N=1,643 properties)
What Drives Review Volume — Decomposing the Drivers
Let us decompose where the stock of review volume comes from, using rank correlations. Across the 1,643 properties analysed, the strongest correlation with review count by far is room count (+0.843). Next come estimated settled ADR (+0.182) and the degree of sell-through at LT7 (+0.081), while years in operation runs the other way at −0.226.
Plotting the 855 business hotels by review count (log axis) against ADR reveals a gently upward-sloping band. The band is wide, however: within the same review-count range, rates differ by several times. Review count is neither a necessary nor a sufficient condition for rate; it is best positioned as a co-existing indicator.
Source: compiled from MetroEngines Research and HotelBank Editorial Team research (business hotels, N=855 properties)
By area, reviews per room show regional differences. Kyoto is the highest of the six prefectures at 65.8 reviews/room, followed by Tokyo at 55.1, Osaka at 51.4 and Shizuoka at 51.0. Hokkaido at 44.4 and Okinawa at 41.3 are somewhat lower. In resort destinations where stays run longer, the same room count yields fewer guest parties per year, so review counts build up more slowly. When benchmarking review counts against properties in other areas, this regional difference is worth factoring in.
| Prefecture | Properties | Median reviews | Reviews/room | ADR | LT7 remaining |
|---|---|---|---|---|---|
| Tokyo | 373 | 6,598 | 55.1 | ¥13,100 | 17.8% |
| Osaka | 181 | 5,118 | 51.4 | ¥8,400 | 23.2% |
| Kyoto | 181 | 1,736 | 65.8 | ¥14,900 | 20.5% |
| Hokkaido | 307 | 2,514 | 44.4 | ¥10,200 | 15.9% |
| Okinawa | 152 | 2,032 | 41.3 | ¥10,900 | 16.7% |
| Shizuoka | 449 | 1,611 | 51.0 | ¥13,900 | 20.3% |
Source: compiled from MetroEngines Research and HotelBank Editorial Team research
As AI-Assisted Hotel Search Grows, What Role Does Review Volume Play?
The significance of review volume as a stock may grow as the way travellers search changes. In a survey conducted in January 2026 by Yadoken, a Japanese accommodation-industry publication (630 respondents who had used generative AI to plan domestic travel; published 19 February 2026), among the 338 people who consulted an AI about accommodation, 47.0% actually stayed at a property the AI had suggested.
What is interesting is the breakdown of reasons for not choosing one. The most common was “concern about reviews and ratings” at 35.4%, followed by “not enough information to judge” at 26.1% and “not enough photos or video to picture it” at 17.3%. By contrast, “concern about the AI’s suggestion itself” was a mere 2.2%. In other words, the stumbling block lies not with the recommendation engine but with the thinness of the material available when a traveller tries to verify the suggested property.
In this configuration, review counts function as the material for the “double-check” a traveller performs in a matter of seconds. For properties still at a thin stage, this is a straightforward area of headroom. In practical terms, three things are realistic.
First, completeness of listed information. Align the factual details that both AI and travellers refer to — room size, bed width, bathhouse operating hours, earliest check-in time, parking conditions — across your own website and every sales channel. Second, comprehensive photos and video. Covering every room type, meals, bathing facilities and the access route addresses the top two reasons for drop-off simultaneously. Third, designing the review request. Simply fixing the timing of the request to immediately after check-out and widening the target to all guests builds up the annual volume of posts.
As seen in the previous section, reviews per room were nearly flat regardless of opening-year cohort. Put the other way round, review count is not something that “grows naturally with the passage of time” but something accumulated as the product of occupancy and request design. A pace of roughly 670 reviews a year at 105 rooms is by no means an extraordinary figure.
Years to Reach the Same Level — Dividing Review Counts Back by Room Count
The figures so far can be restated as a single division. This article observed an accumulation pace of 6.41 reviews per room per year (the median for the 87 business hotels opened from 2018 onward) and wrote that a 105-room property accumulates roughly 670 reviews a year, putting the property-type median of 1,904 reviews about three years away. Since that relationship is nothing more than a rearrangement of the definition years to reach = target reviews ÷ (room count × annual reviews per room), swapping in different room counts and target levels lets other sizes and other property types be read on the same yardstick. This introduces no new measurements; it simply converts figures already given in the article from “reviews” into “years”.
First, three size steps. Taking the median room counts of the within-stratum quartiles (27 rooms in Q1, 95 in Q3, 150 in Q4) and directing each toward the business-hotel median of 1,904 reviews gives the following number of years.
| Size | Rooms | Annual accumulation (reviews) | Years to reach |
|---|---|---|---|
| Small (median rooms, within-stratum Q1) | 27 | 173 | 11.0 |
| Medium (median rooms, within-stratum Q3) | 95 | 609 | 3.1 |
| Large (median rooms, within-stratum Q4) | 150 | 962 | 2.0 |
Source: compiled from MetroEngines Research and HotelBank Editorial Team research (converted from figures stated in this article)
At 27 rooms it takes 11.0 years; at 150 rooms, 2.0. Against the same level of 1,904 reviews, the time required differs by a factor of 5.5. Line up absolute review counts side by side across properties and that 5.5x shows up directly as a “gap”. This is precisely why this article has consistently looked at the per-room figure.
Now vary the target level as well. The table below is a grid of years to reach, with room count down the side and property-type median review counts across the top. Both axes use only levels that actually appear in the tables in this article; no extrapolation beyond that range has been made.
| Rooms | Ryokan 513 reviews | Resort hotels 1,342 reviews | Business hotels 1,904 reviews | City hotels 4,558 reviews | Deluxe hotels 10,890 reviews |
|---|---|---|---|---|---|
| 27 rooms | 3.0 | 7.8 | 11.0 | 26.3 | 62.9 |
| 57 rooms | 1.4 | 3.7 | 5.2 | 12.5 | 29.8 |
| 95 rooms | 0.8 | 2.2 | 3.1 | 7.5 | 17.9 |
| 105 rooms | 0.8 | 2.0 | 2.8 | 6.8 | 16.2 |
| 150 rooms | 0.5 | 1.4 | 2.0 | 4.7 | 11.3 |
Source: compiled from MetroEngines Research and HotelBank Editorial Team research (converted from figures stated in this article)
Read the grid vertically and the effect of size is unmistakable. Read it horizontally and you get the distance involved in changing your benchmark. Read both together and an ordering emerges that runs counter to naive intuition. A 27-room property takes 3.0 years to reach the median of its own type (ryokan, 513 reviews), while a 150-room property takes 4.7 years to reach the city-hotel median of 4,558. A small property standing at the middle of its own category is a shorter journey than a large property standing at the middle of a higher category. Thin review counts are determined by size, but the level you should be comparing against also differs by property type. Set your own property type and size band as the benchmark, and the distance facing a property with thin review counts today is not as far as it looks.
That said, this conversion is a simplification that assumes a constant accumulation pace across property types. The 6.41 reviews/room/year figure is strictly the median for the 87 business hotels opened from 2018 onward, and as the area-level aggregation in this article showed, review counts build up more slowly in resort destinations with longer stays. The years in the table are a scale of distance — “if the current pace continues, how many years of accumulation does this level correspond to?” — not a forecast of when the level will be reached.
Conclusion
To restate the observations in this article: first, median review counts differ ninefold by property type, and most of that difference comes from room count, i.e. capacity to accept guests. Second, reviews per room are nearly flat at 30–31 per room across every opening-year cohort, so length of operation does not translate directly into a review-count advantage. Third, splitting review counts into quartiles within prefecture × property type × opening-year cohort strata, estimated settled ADR rises in steps from ¥9,200 to ¥14,000, and even holding the room-count band constant the higher-review side is 35–57% above. Fourth, co-movement with inventory sell-through is not as strong as with rate: the LT7 remaining-inventory gap is a few points and the median within-stratum correlation only +0.126.
Precisely because review count is a stock that cannot be moved in a day, it is also clear accumulation headroom for properties that are thin today. As generative AI becomes an entry point for choosing accommodation, the depth of review counts and listed information starts to matter as “material that stands up to verification”. On the macro demand side too, the Japan Tourism Agency’s Accommodation Travel Statistics Survey puts the room occupancy rate at 61.0% for May 2026 (second preliminary figures) and 56.2% for June (first preliminary figures) — occupancy itself still has room to build. How to design the loop in which building occupancy is also building review counts is where the operational discussion sits.
Related Reading
- New Hotel ADR Ramp-Up: 91 Japan Openings Split Into 4 Pricing Types
- Pet-Friendly Hotels in Japan: 81-Property Review Ranking, Autumn 2026
- A 4.1 Review Score Is Average, Not a Strength: Sapporo Price Position
On the observation dates for the data: the inventory data are observations taken as of 7–8 August 2026 for check-in dates of Saturday 1 August and Friday 14 August 2026. Coverage is limited to properties publishing at least 30% of their total room count as inventory on OTAs; properties operating primarily through direct sales, or releasing inventory in stages, fall outside the aggregation. Estimated settled ADR is the monthly average for May–July 2026.
References and Sources
- MetroEngines Research — estimated settled ADR (monthly average, May–July 2026) and inventory trends (check-in dates of 1 August and 14 August 2026)
- HotelBank Editorial Team research — cumulative guest review counts and the property master (16,576 operating properties across the five main property types)
- Yadoken, “Generative AI in Travel Planning 2026: Behavioural Data from 630 Users on the Impact on Regional Tourism and the Challenges Involved” (19 February 2026)
- Japan Tourism Agency, “Accommodation Travel Statistics Survey (May 2026 second preliminary figures; June 2026 first preliminary figures)” (31 July 2026)
- Japan Tourism Agency, “Accommodation Travel Statistics Survey” statistics top page
- JTB Tourism Research & Consulting, “Survey and Research Report on the Use of Generative AI and Travel”
■ Data sources
Cumulative review counts and the property master (16,576 operating properties across the five main property types) are from HotelBank Editorial Team research. Estimated settled ADR is an estimate produced by applying property-type-specific adjustment coefficients to the lowest published plan level each property lists on OTAs and similar channels (two guests per room, per-room price, tax-inclusive); cross-checked against property-level disclosures by listed hotel REITs, the median error is approximately 7.5% (approximately 6.0% for business hotels and city hotels), and the monthly average for May–July 2026 is used as each property’s representative value. The inventory data are observations taken as of 7–8 August 2026 for check-in dates of 1 August (Sat) and 14 August (Fri) 2026. Macro indicators are from the Japan Tourism Agency’s “Accommodation Travel Statistics Survey” (May 2026 second preliminary figures; June 2026 first preliminary figures), and the generative-AI usage figures are from Yadoken’s 630-respondent survey (published 19 February 2026).
■ Calculation assumptions
The relationship between review counts, rate and inventory sell-through is compared by building strata of prefecture × property type × opening-year cohort and splitting review counts into quartiles within each stratum (42 strata with at least 8 properties each; 1,470 properties). All correlations are rank correlations (Spearman), and the median of the values calculated per stratum is shown. The years-to-reach conversion is a rearrangement of the definition “years to reach = target reviews ÷ (room count × annual reviews per room)”, with the accumulation pace held constant across property types at the 6.41 reviews/room/year stated in the article (the median for the 87 business hotels opened from 2018 onward). Room counts and target levels use only levels that actually appear in the tables in this article; no extrapolation beyond that range has been made.
■ Limitations and caveats
What this article presents are co-occurrences observed at the same time, not causation whereby increasing review counts raises rates. Estimated settled ADR is an estimate and differs from each property’s actual transaction prices and accounting figures. Inventory aggregation is limited to properties publishing at least 30% of their total room count as inventory on OTAs; properties operating primarily through direct sales, or releasing inventory in stages, fall outside the aggregation. The years-to-reach table is a scale of distance assuming the accumulation pace continues unchanged, not a forecast of when a level will be reached. Because review counts build up more slowly in resort destinations with longer stays even at the same room count, comparisons of years across property types need to allow for a range. Rating scores are not treated as a primary variable because their levels vary depending on the aggregating source.