

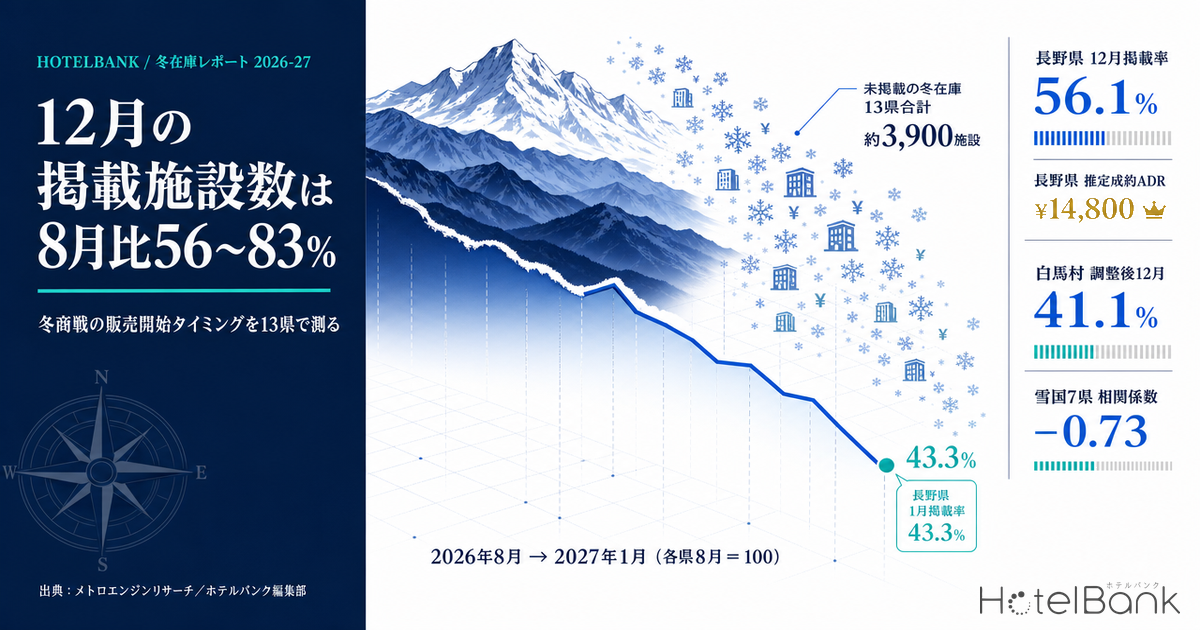
How much of Japan’s lodging inventory for check-in dates in December 2026 and January 2027 is actually “on the shelf” right now? According to MetroEngines Research, if the number of properties with confirmable selling prices in August 2026 is indexed to 100, only 56–83% of properties in the same prefecture are listing December 2026 inventory, and only 43–77% are listing January 2027. Winter is a pillar of annual revenue for many regions, yet a substantial share of that inventory has not gone on sale yet. This article uses the number of listed properties — not price — as its primary metric, reading the timing of the winter selling season across 13 prefectures and their major municipalities.
Metric Definitions Used in This Article
- Listed properties (the primary metric of this article): the number of properties for which a selling price could be confirmed as of the survey date, for at least one check-in date in the month concerned. For future months, this means “the number of properties that have already opened that month’s inventory for sale.”
- Listing rate: the ratio of listed properties in each month to the number of listed properties in the same area in August 2026, indexed to 100. Because property counts differ widely between areas, comparisons are made on ratios rather than absolute numbers.
- ADR (average daily rate): an estimated transacted rate (tax-excluded equivalent) calculated by applying category-specific adjustment factors to the lowest published plan level each property posts on OTAs and similar channels (double occupancy, per-room rate, tax-included). Cross-checked against property-level actuals disclosed by listed hotel REITs (184 property-months, April–May 2026), the median error is 7.5%, and 6.6% on an area-aggregate basis. These are estimates and differ from each property’s actual transacted rates and accounting figures. Area-level ADR is the median across the properties covered (the level of a typical property in that area).
- Published rate (all-plan average): the average published rate across all plans, from room-only through meal-inclusive (double occupancy, per-room rate, tax-included). This is a separate metric from estimated transacted ADR, and is used in this article solely to examine observation bias.
- Data source: MetroEngines Research
- — December listing rates run 56–83%, January 2027 43–77%. The snowier the region, the thinner the shelf: Nagano is the lowest of the 13 prefectures at 56.1% for December and 43.3% for January.
- — Seasonal closures do not explain it. Listed-property counts for the same months a year earlier were essentially flat (Nagano 98.4, Tokyo 100.0, Gunma 101.1), indicating the drop reflects delayed sales openings.
- — Winter inventory not yet on the shelf amounts to roughly 3,900 properties for December and about 5,500 for January 2027 across the 13 prefectures. Moving the prior-year seasonal ratio by ±5pt puts the range at roughly 3,100–4,700 and 4,700–6,300 properties respectively.
- — Snow resorts are the slowest to put inventory on sale. Adjusted listing rates are 34.6% in Nozawaonsen, 39.0% in Kutchan and 41.1% in Hakuba, versus 96.3% in Noboribetsu, 85.5% in Hakodate and 85.0% in Sapporo Chuo-ku.
- — The lower the listing rate, the “more expensive” a month looks. Across 35 data points in seven snow-country prefectures, the correlation between listing rate and published rate is −0.73, but only −0.12 against estimated transacted ADR. Nagano’s winter is +0.1% versus August — effectively flat.
December Listing Rates of 56–83%, January 43–77% — Thinner Shelves in Snow Country
Start with the overall picture. We tracked listed-property counts for 13 major prefectures from August 2026 through January 2027. Indexed to August = 100, the listing rate falls uniformly month by month. But the shape of that decline differs sharply.
The steepest drop is in Nagano, falling to 56.1% in December 2026 and to 43.3% by January 2027. Against 2,097 properties on sale in August, December stands at 1,177 and January 2027 at 907. Gunma (61.9% in December, 48.9% in January), Niigata (65.2%, 50.8%) and Shizuoka (68.4%, 55.6%) follow. All are prefectures with winter ski and hot-spring demand.
Urban markets take a different shape. Tokyo is at 81.0% for December and 74.9% for January, Osaka at 83.3% and 76.5%, and Fukuoka at 82.0% and 73.3% — a gentle decline even six months out. In business-demand-led markets, room inventory is structurally on the shelf year-round, regardless of season.
Source: Compiled by the HotelBank Editorial Team from MetroEngines Research
| Prefecture | Aug 2026 listed properties |
Dec 2026 listed properties |
Dec listing rate |
Jan 2027 listed properties |
Jan listing rate |
|---|---|---|---|---|---|
| Nagano | 2,097 | 1,177 | 56.1% | 907 | 43.3% |
| Gunma | 763 | 472 | 61.9% | 373 | 48.9% |
| Niigata | 699 | 456 | 65.2% | 355 | 50.8% |
| Hokkaido | 2,145 | 1,458 | 68.0% | 1,249 | 58.2% |
| Shizuoka | 1,880 | 1,286 | 68.4% | 1,046 | 55.6% |
| Toyama | 273 | 193 | 70.7% | 171 | 62.6% |
| Yamagata | 373 | 264 | 70.8% | 213 | 57.1% |
| Aichi | 748 | 553 | 73.9% | 486 | 65.0% |
| Iwate | 354 | 272 | 76.8% | 219 | 61.9% |
| Okinawa | 2,204 | 1,767 | 80.2% | 1,509 | 68.5% |
| Tokyo | 2,384 | 1,930 | 81.0% | 1,786 | 74.9% |
| Fukuoka | 923 | 757 | 82.0% | 677 | 73.3% |
| Osaka | 1,228 | 1,023 | 83.3% | 939 | 76.5% |
Source: Compiled by the HotelBank Editorial Team from MetroEngines Research (listing rates indexed to August 2026 = 100 for each prefecture)
Seasonal Closures Do Not Explain It — Prior-Year Listed Counts Were Essentially Flat
An obvious question arises: isn’t the winter decline in listed properties simply the result of properties closing for the season? That question can be tested by taking the same metric for months already in the past. For months whose check-in dates have passed, every property confirmed on sale at any point during the observation window has accumulated in the count — so we can see how many properties ultimately made it onto the shelf.
Looking at actuals from August 2025 through January 2026, Nagano’s listed-property count moved 1,720 → 1,664 → 1,737 → 1,673 → 1,693 → 1,655 — essentially flat. Indexed to August = 100, December is 98.4 and January 96.2. In other words, in Nagano the total number of properties selling barely changes when winter arrives. Gunma (101.1 in December, 103.6 in January), Shizuoka (99.5, 102.1) and Niigata (100.9, 99.1) show the same pattern; no structural seasonal decline is observable. Tokyo is completely flat at 100.0 for December and 99.9 for January.
Hokkaido is the exception: even in prior-year actuals it falls to 86.3 in December and 85.0 in January, a decline of just over 10%. Some parts of the prefecture do genuinely scale back operations during the snow season, so this portion needs to be separated out as a seasonal factor.
Source: Compiled by the HotelBank Editorial Team from MetroEngines Research
The implication of this comparison is clear. Winter listed-property counts look depressed not because many properties will not operate that month, but because many properties that do plan to operate have not yet opened sales. In Nagano’s case, roughly the same number of properties as in August will ultimately sell December inventory — yet only 56% are on the shelf today.
About 3,900 Properties’ Worth of Winter Inventory Is Still to Come Across 13 Prefectures
Prior-year seasonal ratios allow us to estimate how many properties “should” be on the shelf in each prefecture. We take the actual measured listed-property count for August 2026, multiply it by the prior-year ratio to August for the same period, treat the result as the expected level, and take the difference against the current listed count. Because the number of properties covered by the data set itself grows year over year, we work with this within-year normalization rather than a year-over-year comparison of absolute counts.
The result: across the 13 prefectures, roughly 3,900 properties for December 2026 and about 5,500 for January 2027 have yet to open sales. By prefecture, Nagano is the largest at 887 properties for December and 1,111 for January, followed by Shizuoka (584 and 874), Tokyo (454 and 597), Okinawa (348 and 592) and Hokkaido (393 and 573).
Source: Compiled by the HotelBank Editorial Team from MetroEngines Research (estimates normalized by the prior-year seasonal ratio for the same period)
Re-ranking on an “adjusted listing rate” that nets out seasonal factors gives a cleaner read on how far each prefecture has progressed. Nagano stands at 57.0% for December and 45.0% for January, Gunma at 61.2% and 47.2%, and Niigata at 64.6% and 51.3%. By contrast, Osaka is high at 87.2% and 80.6%, Fukuoka at 83.7% and 75.6%, and Okinawa at 83.5% and 71.8%. Netting out seasonal factors puts Hokkaido at 78.8% for December and 68.5% for January — better progress than the headline figures suggest.
| Prefecture | Prior-year Dec seasonal ratio |
Adjusted Dec listing rate |
Adjusted Jan listing rate |
Est. unlisted Dec (properties) |
Est. unlisted Jan (properties) |
|---|---|---|---|---|---|
| Nagano | 98.4% | 57.0% | 45.0% | 887 | 1,111 |
| Gunma | 101.1% | 61.2% | 47.2% | 299 | 418 |
| Niigata | 100.9% | 64.6% | 51.3% | 250 | 337 |
| Hokkaido | 86.3% | 78.8% | 68.5% | 393 | 573 |
| Shizuoka | 99.5% | 68.8% | 54.5% | 584 | 874 |
| Toyama | 96.6% | 73.2% | 65.1% | 71 | 92 |
| Yamagata | 100.3% | 70.6% | 57.8% | 110 | 156 |
| Aichi | 95.1% | 77.7% | 68.5% | 158 | 223 |
| Iwate | 96.4% | 79.7% | 63.4% | 69 | 126 |
| Okinawa | 96.0% | 83.5% | 71.8% | 348 | 592 |
| Tokyo | 100.0% | 81.0% | 75.0% | 454 | 597 |
| Fukuoka | 97.9% | 83.7% | 75.6% | 147 | 218 |
| Osaka | 95.6% | 87.2% | 80.6% | 150 | 226 |
Source: Compiled by the HotelBank Editorial Team from MetroEngines Research
This estimate rests on a single assumption: that properties come onto the shelf following the same seasonal pattern as the prior year. It is worth checking how much the conclusion moves when that assumption is varied.
| Assumption | For December (properties) | For January 2027 (properties) |
|---|---|---|
| This article’s baseline (prior-year seasonal ratio applied as is) | approx. 3,900 | approx. 5,500 |
| Seasonal ratio set 5pt lower (fewer properties operating this winter than last) | approx. 3,100 | approx. 4,700 |
| Seasonal ratio set 5pt higher (more properties operating this winter than last) | approx. 4,700 | approx. 6,300 |
| No seasonal adjustment (same count as August assumed) | approx. 4,500 | approx. 6,100 |
Source: Compiled by the HotelBank Editorial Team from MetroEngines Research (13-prefecture total; prefecture-level estimates of unlisted properties are summed, with negative values treated as zero)
The range lands at roughly 3,100–4,700 properties for December and 4,700–6,300 for January 2027. Even on the most conservative assumption, the conclusion that more than 3,000 properties are still off the shelf as of December holds — so the directional finding, that a substantial volume of winter inventory is still to reach the market, is robust to how the assumption is set. Prefecture-level estimates, however, are sensitive to the seasonal ratio, so individual-prefecture absolute numbers should be read as ranges.
Ski Resorts Are the Slowest to Open Sales — Hakuba 41%, Nozawaonsen 35%
Prefecture-level averages mask differences in character within a region. Drop down to the municipal level and a striking pattern emerges: the snow resorts, for which winter should be the peak trading season, are precisely where sales open latest.
Hakuba, which has the largest concentration of accommodation in Nagano, had 354 properties on sale in August 2026 against 148 in December and 107 in January 2027. Adjusting by the prior-year seasonal ratio for the same months (101.7 for December, 87.8 for January) gives 41.1% for December and 34.4% for January. Nozawaonsen is more pronounced still, at an adjusted 34.6% for December and 14.5% for January; only nine properties in the village are listing January 2027 inventory (against 73 in August). The January figure for the village rests on a small base and should be treated as one illustration of a tendency rather than standalone proof — but read together with Hakuba and Yamanouchi, the direction is consistent.
Hokkaido shows the same tendency. Kutchan had 159 properties in August against 33 in December and 28 in January. It is an area where listed counts genuinely fall in winter even in prior-year actuals (53.2 in December, 33.3 in January); netting that out still leaves an adjusted 39.0% for December and 52.8% for January — low either way. Niseko sits at an adjusted 66.3% and 66.8%. Elsewhere in Hokkaido, Noboribetsu (96.3% and 85.0%), Hakodate (85.5% and 74.9%) and Sapporo Chuo-ku (85.0% and 81.4%) display year-round selling patterns.
Source: Compiled by the HotelBank Editorial Team from MetroEngines Research (adjusted by the prior-year seasonal ratio for the same period; municipalities with 20 or more listed properties in August 2026)
| Municipality | Aug 2026 | Dec 2026 | Jan 2027 | Adjusted Dec | Adjusted Jan |
|---|---|---|---|---|---|
| Nozawaonsen, Nagano | 73 | 26 | 9 | 34.6% | 14.5% |
| Kutchan, Hokkaido | 159 | 33 | 28 | 39.0% | 52.8% |
| Hakuba, Nagano | 354 | 148 | 107 | 41.1% | 34.4% |
| Yamanouchi, Nagano | 129 | 87 | 74 | 58.0% | 50.8% |
| Chino, Nagano | 128 | 68 | 51 | 58.3% | 42.1% |
| Karuizawa, Nagano | 173 | 116 | 103 | 64.0% | 55.7% |
| Nagano City | 139 | 84 | 64 | 65.0% | 50.0% |
| Niseko, Hokkaido | 63 | 24 | 20 | 66.3% | 66.8% |
| Matsumoto, Nagano | 191 | 111 | 92 | 67.5% | 53.1% |
| Asahikawa, Hokkaido | 89 | 68 | 66 | 72.4% | 67.9% |
| Furano, Hokkaido | 107 | 78 | 65 | 72.9% | 65.7% |
| Sapporo Chuo-ku, Hokkaido | 221 | 190 | 181 | 85.0% | 81.4% |
| Hakodate, Hokkaido | 171 | 144 | 129 | 85.5% | 74.9% |
| Noboribetsu, Hokkaido | 27 | 26 | 24 | 96.3% | 85.0% |
Source: Compiled by the HotelBank Editorial Team from MetroEngines Research (counts are listed properties)
Several explanations are possible for why snow resorts appear slow to open sales. One is operational: waiting on season-pass and lift-ticket package design, or on ropeway operators finalizing their operating calendars. Another is channel design — selling to overseas repeat visitors through separate channels ahead of domestic OTAs. A third is inventory control, releasing rooms only in stages until peak-season pricing is locked. Public data cannot identify which is the primary driver, so no single explanation can be asserted. In practice the spread between operators is wide: in the Hakuba area, the official hotel of Hakuba Cortina Ski Resort opened reservations for the 2026-27 season (stays from 12 December 2026 to 28 March 2027) on 7 July 2026.
Low Listing Rates Make a Month Look “Expensive” — Observation Bias in Reading Rates
There is one issue that cannot be sidestepped when reading winter pricing: the fewer properties listed in a month, the higher the average published rate tends to appear. Smaller properties and lower-rate inventory that have not yet reached the shelf drop out of the aggregation base, raising the weight of the higher-rate, larger properties that opened sales first.
Across 35 monthly data points from seven snow-country prefectures (Nagano, Hokkaido, Niigata, Yamagata, Iwate, Gunma and Toyama), the correlation coefficient between listing rate and the published-rate index (each prefecture’s August = 100) is −0.73. The relationship is clear: as the listing rate falls, the average published rate rises. Take the correlation between listing rate and the estimated transacted ADR index across the same 35 points, however, and it is only −0.12 — no meaningful relationship.
Source: Compiled by the HotelBank Editorial Team from MetroEngines Research (seven snow-country prefectures × September 2026–January 2027 = 35 points)
Nagano alone makes the gap even clearer. The all-plan average published rate rises from ¥30,900 in August 2026 to ¥33,100 in December and ¥36,100 in January 2027, up 16.9%. Yet estimated transacted ADR over the same period moves ¥14,800 → ¥14,500 → ¥14,800 — essentially flat, and just +0.1% versus August (properties covered for estimated transacted ADR: N=805 → 552 → 426). Reading published rates alone and concluding that “Nagano is nearly 20% more expensive in winter” would put you well away from what is actually happening.
| Nagano | Aug 2026 | Dec 2026 | Jan 2027 | vs Aug (Jan) |
|---|---|---|---|---|
| Listed properties | 2,097 | 1,177 | 907 | −56.7% |
| Published rate (all-plan average) | ¥30,900 | ¥33,100 | ¥36,100 | +16.9% |
| Estimated transacted ADR | ¥14,800 | ¥14,500 | ¥14,800 | +0.1% |
| Properties covered for estimated transacted ADR | N=805 | N=552 | N=426 | — |
Source: Compiled by the HotelBank Editorial Team from MetroEngines Research
This structure carries a practical caution for rate benchmarking. For months half a year out, the median estimated transacted ADR — less affected by shifts in property mix — is more stable than a cross-comparison of average published rates. From autumn onward, as listing rates recover, there will be a phase in which average published rates naturally decline; more often than not that is a change in the aggregation base, not a price cut.
The Opportunity for Early Sellers, and the Opportunity for Those Still to Come
The data above reads differently for operators, revenue managers and investors.
For properties that already have winter inventory on sale, the thinness of the comparison set right now is itself an opportunity. For December in Nagano, roughly 2,060 properties are expected on the shelf in the end, but only 1,177 are there today. This is a window in which the pool that early-stage shoppers compare is small — favorable for capturing early demand through branded search and early-booking offers. In snow resorts especially, where adjusted listing rates sit in the 30–40% range in some areas, properties already selling enjoy relatively high exposure.
For properties that have not yet opened sales, progress elsewhere is a useful reference point. Even within snow country, Iwate is at an adjusted 79.7% for December and Yamagata at 70.6% — the standard timing differs by region. If the adjusted listing rate in your own market has already reached 70–80%, delay in opening sales may translate into lost opportunity. If the market as a whole is in the 40% range, there is a defensible logic to locking in pricing before going on sale.
From an investor and asset-management perspective, the trajectory of listed-property counts is itself a leading indicator of supply still to come. Roughly 3,900 properties’ worth of inventory for December and about 5,500 for January 2027 are expected to enter the market across the 13 prefectures, and extrapolating current rate levels and inventory absorption — measured before that supply has fully arrived — to the season as a whole warrants caution. The lower the adjusted listing rate in an area, the more room there is for the competitive environment to shift as additional supply comes on.
Note that this article takes listed-property counts (the timing of sales openings) as its primary metric. On December rate levels themselves, Year-End 2026-27 Room Rates Are Already Visible: December Forward ADR vs Prior-Year Actuals examines the question against prior-year actuals.
⚠ A note on forward-dated data: the listed-property counts, published rates and estimated transacted ADR for September 2026 onward in this article are all estimates based on selling information observable as of the survey date (August 2026), and will change as check-in dates approach. Listed-property counts will necessarily increase as more properties open sales. Current figures represent “progress in opening sales as of today,” not the season’s final supply volume or rate levels.
Methodology and Caveats
The aggregation covers, out of roughly 168,000 domestic properties tracked by MetroEngines Research, the approximately 27,000 properties and 1.26 million rooms whose activity can be confirmed on OTAs and similar channels. Listed properties counts the number of properties for which a selling price could be confirmed as of the survey date for at least one check-in date in the month concerned, aggregated on a double-occupancy basis. Prefecture-level aggregation covers 13 prefectures; municipal-level aggregation covers municipalities in Nagano and Hokkaido with 20 or more listed properties in August 2026.
An important caveat: listed-property counts depend on each channel’s listing-launch policy and on the coverage of the survey. If a property sells early through its own website or via travel agents but is not listed on OTAs or similar channels, it is not captured by this metric. This metric is therefore a proxy for the opening of sales, not the actual sales-opening date itself. The gap may be especially large at snow resorts, where overseas agents account for a high share of distribution. On how much of their total room stock individual properties actually place on OTA-type selling channels, see Median 39.2% of Rooms Online — Allocation Across 12,941 Hotels.
Also note that listed-property counts for past months (August 2025–January 2026) are cumulative across the observation window, whereas future months are a snapshot as of the survey date. Rather than subtracting one from the other directly, we compare them after within-year normalization to August = 100 for each year. Because the number of properties covered by the data set has itself grown from the prior year, no year-over-year comparison of absolute counts is made. For the estimated transacted ADR series, we confirmed that no month falls below 60% of the series median in properties covered for any prefecture (Niigata in January 2027 is at the borderline level and should be treated as a reference figure).
Related Reading
- Year-End 2026-27 Room Rates Are Already Visible: December Forward ADR vs Prior-Year Actuals
- Japan Autumn ADR 2026: 20 Prefectures Peak in Nov, Kyoto +81.8%
- Median 39.2% of Rooms Online — Allocation Across 12,941 Hotels
References and Sources
■ Data source
Out of roughly 168,000 domestic properties tracked by MetroEngines Research, the approximately 27,000 properties and 1.26 million rooms whose activity can be confirmed on OTAs and similar channels. Prefecture-level data covers 13 prefectures for August 2026–January 2027 (forward-month snapshot) and August 2025–January 2026 (settled months); municipal-level data covers areas in Nagano and Hokkaido with 20 or more listed properties in August 2026. All figures are aggregated on a double-occupancy basis.
■ Calculation assumptions
The listing rate is the ratio to each area’s August 2026 = 100. The adjusted listing rate divides that by the prior-year seasonal ratio (August 2025 = 100) to net out seasonal factors. Estimated unlisted properties are calculated as “measured listed properties in August 2026 × prior-year seasonal ratio for the same month − current listed properties,” with negative values treated as zero. Because the number of properties covered by the data set has itself grown from the prior year, no year-over-year comparison of absolute counts is made; comparisons use within-year normalization to August = 100 for each year.
■ Limitations and points to note
Listed-property counts depend on each channel’s listing-launch policy and on the coverage of the survey. A property selling early through its own website or via travel agents is not captured unless it is listed on OTAs or similar channels, so this metric is a proxy for the opening of sales rather than the sales-opening date itself. Forward-month figures are a snapshot as of the survey date and will necessarily increase as more properties open sales. Areas with a small base — such as Nozawaonsen in January 2027 (nine properties) — are treated as one illustration of a tendency, not as standalone proof. Estimated transacted ADR is an estimate and differs from each property’s actual transacted rates and accounting figures.
■ Sources
- MetroEngines Research — listed properties, published rates and estimated transacted ADR (13 prefectures / municipal level, August 2025–January 2027)
- Peak-season reservations for Hakuba Cortina Ski Resort open on 7 July (Hotel Green Plaza chain, 2026)
- Japan Tourism Agency, “Overnight Travel Statistics Survey”
- Japan National Tourism Organization (JNTO), Foreign Visitor Statistics