

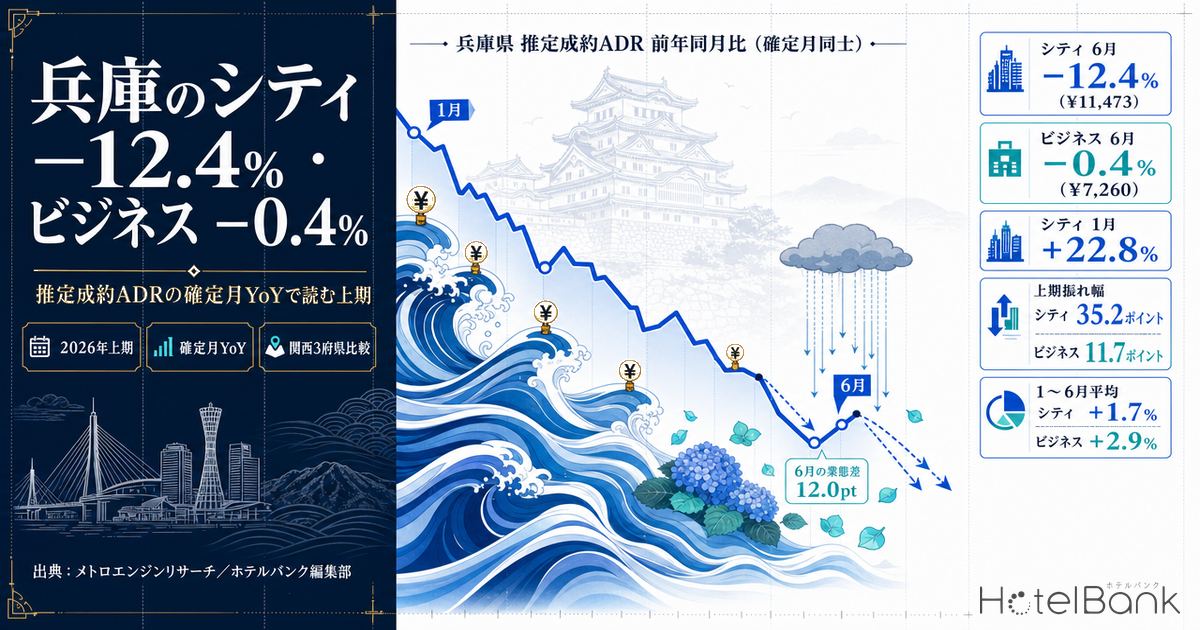
Hyogo Prefecture’s settled ADR estimate (tax-excluded equivalent) traced two completely different paths by hotel category in the first half of 2026. City hotels opened the year with double-digit growth of +22.8% year on year in January (¥13,500), then sank to −12.4% (¥11,500) by June. Business hotels in the same prefecture went from +11.3% in January (¥7,700) to −0.4% in June (¥7,300) — essentially a flat landing. The H1 swing was 35.2 points for city hotels and 11.7 points for business hotels. Yet averaged across January to June, both categories came in above last year — city +1.7% and business +2.9% — so “the June stall” does not mean the year stalled. This article re-reads a first half of confirmed data using only year-on-year comparisons between confirmed months.
Scope: Hyogo Prefecture city hotels N=47 properties / business hotels N=166–167 properties. Price figures in this article are settled ADR estimates (the transacted price level estimated from OTA and other sales data, tax-excluded equivalent); occupancy figures are estimates based on OTA-listed inventory. Both definitions appear at the end of the article. Data as of August 20, 2026.
- — The settled ADR estimate for Hyogo city hotels moved from +22.8% in January to −12.4% in June 2026. Business hotels in the same prefecture went +11.3% → −0.4%, a 12.0-point gap in the June decline.
- — The H1 year-on-year swing was 35.2 points for city hotels and 11.7 points for business hotels. The higher the price band, the more a category is buffeted by how high the base year was.
- — Averaged over January–June, both categories beat last year: city +1.7%, business +2.9%. The June stall does not mean the whole first half stalled.
- — Among the three Kansai prefectures, Hyogo is the only one positive in both categories on the H1 average (Osaka city −8.8% / business −18.4%; Kyoto city −4.2% / business +1.3%).
- — Even in June, when rates fell, estimated OCC stayed high at 87.7% for city and 89.1% for business (June 2026, OTA-listed inventory basis). Rate and inventory sell-through should be evaluated separately.
Year on year went from +22.8% in January to −12.4% in June — the first half, confirmed months only
First, the ground rules. Everything compared here is a month already calculated as a confirmed value. For 2026, confirmed values are available through July; August onward is a current-point estimate computed on a different basis, so it is excluded from the year-on-year comparisons in this article. Hyogo city hotels cover 47 properties and business hotels 166–167 properties, with only marginal month-to-month variation in property counts.
The table below is the overall picture of the first half. City hotels beat last year from January through March, turned negative in April, and posted their largest H1 decline in June. Business hotels saw their growth rate narrow from a January peak of +11.3%, but fell below last year in only two months — May (−1.2%) and June (−0.4%) — and returned to positive territory at +1.5% in July, the most recent confirmed month. City hotels were at −7.5% in that same July, so the gap between the two categories was not a one-off confined to June.
| Stay month | City Settled ADR est. |
Same month LY | YoY | Business Settled ADR est. |
Same month LY | YoY |
|---|---|---|---|---|---|---|
| January 2026 | ¥13,521 | ¥11,012 | +22.8% | ¥7,716 | ¥6,932 | +11.3% |
| February 2026 | ¥11,878 | ¥11,178 | +6.3% | ¥7,359 | ¥7,135 | +3.1% |
| March 2026 | ¥13,044 | ¥12,355 | +5.6% | ¥7,675 | ¥7,368 | +4.2% |
| April 2026 | ¥12,159 | ¥12,967 | −6.2% | ¥7,576 | ¥7,485 | +1.2% |
| May 2026 | ¥13,633 | ¥13,801 | −1.2% | ¥7,944 | ¥8,040 | −1.2% |
| June 2026 | ¥11,473 | ¥13,098 | −12.4% | ¥7,260 | ¥7,290 | −0.4% |
| July 2026 (most recent confirmed month) | ¥12,131 | ¥13,120 | −7.5% | ¥7,673 | ¥7,559 | +1.5% |
| Jan–Jun average | ¥12,618 | ¥12,402 | +1.7% | ¥7,588 | ¥7,375 | +2.9% |
Scope: Hyogo city N=47 properties / business N=166–167 properties, confirmed value vs. confirmed value. Source: MetroEngines Research; compiled by the HotelBank Editorial Team
Overlaying three years on the same month axis shows that the seasonal shape is more stable than any single month’s swing. For Hyogo city hotels, May was the highest level of the first half in both 2025 and 2026; only in 2024 was March the H1 peak. February, meanwhile, sat second from the bottom of the first half in both 2025 and 2026 (third from the bottom in 2024), so the position of the low season has barely moved. Even in years when the year-on-year figures are turbulent, the ordering of highs and lows within the year is broadly reproduced.
Hyogo city hotels, settled ADR estimate (tax-excluded equivalent), years overlaid, confirmed months only. Source: MetroEngines Research; compiled by the HotelBank Editorial Team
A 35.2-point swing vs. 11.7 points — what differed between price bands in the same prefecture
The next chart lines up the H1 year-on-year figures by category. The city-hotel year-on-year moved across a 35.2-point range, from +22.8% to −12.4%. Business hotels moved 11.7 points, from +11.3% to −0.4% — roughly one third of the swing. Looking at June alone, the gap between the two widened to 12.0 points.
Hyogo, settled ADR estimate, year-on-year change (confirmed month vs. confirmed month). Source: MetroEngines Research; compiled by the HotelBank Editorial Team
That difference also shows up in the distance between the two categories’ rates. Calculating month by month how many times the Hyogo city-hotel settled ADR estimate exceeds the business-hotel figure, January 2026 stood at 1.75x while June had narrowed to 1.58x. The same months a year earlier were 1.59x and 1.80x respectively — the ordering of the multiples is reversed. The picture is one of an upper price band that rose in January, and an upper band that fell while the lower band held in June.
One more thing worth questioning is the base year itself. June 2026’s −12.4% is also the flip side of June 2025 having been high. Set alongside two years ago, it looks like this.
| Category and stay month | 2024 | 2025 | 2026 | 2026 vs. two years earlier |
|---|---|---|---|---|
| City — January | ¥10,437 | ¥11,012 | ¥13,521 | +29.5% |
| City — June | ¥10,590 | ¥13,098 | ¥11,473 | +8.3% |
| City — July | ¥10,624 | ¥13,120 | ¥12,131 | +14.2% |
| Business — January | ¥7,018 | ¥6,932 | ¥7,716 | +9.9% |
| Business — June | ¥6,936 | ¥7,290 | ¥7,260 | +4.7% |
| Business — July | ¥7,103 | ¥7,559 | ¥7,673 | +8.0% |
All confirmed values. Scope: city N=46–47 properties / business N=165–169 properties. Source: MetroEngines Research; compiled by the HotelBank Editorial Team
While Hyogo city hotels were 12.4% below last year in June 2026, they were 8.3% above the same month two years earlier. In other words, June 2025 was an exceptionally high month within these three years. Business hotels show the same shape, but because the June 2025 level was a mild +5.1% against 2024, the 2026 pullback was limited to −0.4%. The reading that the height of the comparison partner set the size of the swing applies more readily the higher the price band.
Line up the three Kansai prefectures and Hyogo is the only one positive in both categories on the H1 average
Looking at Hyogo alone, June’s −12.4% looks heavy; measured against neighboring prefectures on the same yardstick, its position changes. The chart below compares the January–June average settled ADR estimate with the same period a year earlier.
Average settled ADR estimate for January–June 2026 vs. the same period last year (confirmed value vs. confirmed value). Scope (each month, January–June 2026): Hyogo city N=47 / business N=166–167; Osaka city N=91–95 / business N=495–499; Kyoto city N=56–58 / business N=319–329. Source: MetroEngines Research; compiled by the HotelBank Editorial Team
Hyogo was the only prefecture positive in both city and business categories on the H1 average. Osaka came in at city −8.8% and business −18.4%; Kyoto at city −4.2% and business +1.3%. In June alone the contrast is starker still — Osaka at city −26.3% / business −32.8% and Kyoto at city −14.6% / business −9.8% — which puts Hyogo’s city figure of −12.4% among the smaller declines in Kansai. The month-by-month path of Osaka’s deepening decline is broken down in Osaka Settled ADR June 2026: City -26.3%, Business -32.8% Post-Expo, and the composition of Kyoto’s June drop across both categories in Kyoto Hotel ADR Falls YoY in June 2026: City -14.6%, Business -9.8%.
Worth keeping in mind as background is the demand environment of 2025, the comparison partner. Expo 2025 Osaka, Kansai ran from April 13 to October 13, 2025, drawing 25.58 million general visitors (29.02 million total visitors) (Expo 2025 Osaka, Kansai official website). The spring and summer of 2025 that overlapped the run of the Expo was a period when the baseline for accommodation demand was lifted across Kansai as a whole. One reading of why 2026 year-on-year figures sink into negative territory is that they are being measured against this elevated base. Indeed, at the national level, total guest nights in June 2026 were reported at 46.78 million, down 6.5% year on year, of which foreign guest nights were 12.51 million, down 11.9% (Japan Tourism Agency, “Overnight Travel Statistics Survey,” released July 31, 2026). Hyogo’s decline is best seen as part of a wider base effect rather than a circumstance specific to Hyogo.
Even in June, when rates fell, inventory sell-through itself held at a high level
A negative year-on-year on rate does not mean rooms were not selling. Looking at the estimated OCC for the same Hyogo market (OTA-listed inventory basis) as a monthly average, June was 87.7% for city and 89.1% for business, and July 89.3% for city and 90.9% for business. By the nature of the metric it runs higher than actual room occupancy, but there is no sign of the level breaking down through the back half of the first period. Note that even within Hyogo, how inventory fills toward the stay date differs substantially by category (for detail, see Hyogo Booking Curves: 3.6x Pickup Gap, Ryokan Sellout Rate 28.4%).
| Stay month (2026) | City estimated OCC | Business estimated OCC | Observed properties |
|---|---|---|---|
| April | 87.7% | 88.4% | City 40–43 / Business 140–148 |
| May | 89.2% | 89.6% | City 39–45 / Business 133–149 |
| June | 87.7% | 89.1% | City 42–46 / Business 140–148 |
| July | 89.3% | 90.9% | City 42–46 / Business 142–149 |
Monthly average estimated OCC (OTA-listed inventory basis). Source: MetroEngines Research; compiled by the HotelBank Editorial Team
Broken out by day of week, the difference in character between the two categories comes through one step more clearly. In June 2026, estimated OCC for city hotels was 94.2% on Saturday against 83.6% on Monday, a 10.6-point spread; business hotels were 92.8% on Saturday against 86.0% on Monday, a 6.8-point spread. July was similar: city at 94.5% Saturday and 85.0% Monday (a 9.5-point gap), business at 93.2% Saturday and 87.0% Monday (a 6.2-point gap). City hotels concentrate more heavily into the weekend, leaving relatively thicker weekday inventory. Because the shape of demand differs by day of week, rates are structurally more likely to stretch and compress on the weekend side.
| Day of week | City, June | Business, June | City, July | Business, July |
|---|---|---|---|---|
| Monday | 83.6% | 86.0% | 85.0% | 87.0% |
| Tuesday | 86.1% | 89.9% | 89.2% | 92.5% |
| Wednesday | 86.5% | 90.7% | 90.1% | 93.4% |
| Thursday | 89.5% | 92.3% | 89.7% | 93.2% |
| Friday | 90.8% | 89.2% | 89.0% | 88.9% |
| Saturday | 94.2% | 92.8% | 94.5% | 93.2% |
| Sunday | 85.0% | 83.5% | 87.6% | 87.6% |
Estimated OCC (OTA-listed inventory basis), day-of-week averages, June / July 2026. Source: MetroEngines Research; compiled by the HotelBank Editorial Team
For revenue managers running city and business hotels in Hyogo — implications and an action plan
1. Do not judge your property’s execution on a single month’s year-on-year alone. Hyogo city hotels were at −12.4% in June, but +1.7% on the January–June average and +8.3% against the same month two years earlier. The same performance can look negative or positive depending on which baseline you choose. In your own H1 review, line up all three — year-on-year for the month, the H1 average, and the two-year comparison — and decide up front which basis you will explain results on.
2. The “expected swing” differs by your price band. The H1 year-on-year swing was 35.2 points for city hotels and 11.7 points for business hotels. The more a property competes in the upper price band, the more room there is to build an annual budget on the premise that good years and bad years will diverge widely. Conversely, if you are seeing a double-digit swing in the business price band, you have grounds to suspect property-specific factors rather than market ones.
3. Anchor the rate-revision calendar to the shape of the season. For Hyogo business hotels, May was the highest level of the first half in 2024, 2025 and 2026 alike; for city hotels, May was the peak in both 2025 and 2026. February sat second from the bottom of the first half in both 2025 and 2026 (third from the bottom in 2024). Because the ordering of highs and lows is reproduced even in years when year-on-year figures are turbulent, next year’s revision calendar will be more stable if it is designed on this shape rather than on year-on-year change.
4. Evaluate rate and inventory sell-through separately. While June’s year-on-year on rate was negative, estimated OCC stood at a high 87.7% for city and 89.1% for business. By day of week, the gap between city hotels’ 94.2% on Saturday and 83.6% on Monday is 10.6 points. How to handle weekday inventory under a weekend-weighted demand shape is a question to decide separately from the year-on-year on rate.
| Time frame | Action | Decision trigger (tied to figures in this article) | Purpose |
|---|---|---|---|
| Today to this week | Re-lay your H1 results across three baselines (year-on-year for the month, the January–June average, and the two-year comparison) | If your June year-on-year is worse than the market’s city −12.4% / business −0.4%, prioritize isolating factors that are not base effects | Separating market factors from property factors |
| Today to this week | Benchmark your rate for the most recent confirmed month (July) against the market level | If your July remains well below the level of ¥12,131 for city / ¥7,673 for business, consider resetting your price band | Knowing where you stand |
| Within two weeks | Move to an operation that handles inventory differently by day of week | If your day-of-week spread is wider than the market’s city 10.6pt / business 6.8pt (June), there is room to revisit weekday selling design | Smoothing weekend concentration |
| Within two weeks | Inspect the distance between your upper and lower price bands | The market’s city-to-business multiple went from 1.75x in January to 1.58x in June. Check whether the gap between your premium and standard plans has narrowed similarly | Maintaining price-band structure |
| Toward next month | Draft next year’s rate-revision calendar on a seasonal-shape basis | For business hotels, May was the H1 peak in all three years, and February was second from the bottom of the first half in each of the last two years. Place strength and weakness on this ordering | Stabilizing revision timing |
| Toward next month | Set the range for next period’s budget on the premise of a wide-area base effect | Hyogo is the only one of the three Kansai prefectures positive in both categories on the H1 average (city +1.7% / business +2.9%). Use neighboring prefectures’ declines as a reference for your downside scenario | Making the budget range realistic |
Source: MetroEngines Research; compiled by the HotelBank Editorial Team
Summary — three yardsticks to take away from the first half
Yardstick 1: read three baselines, not a single month. June 2026 for Hyogo city hotels was −12.4% year on year, but +1.7% on the January–June average and +8.3% against the same month two years earlier. All describe the same performance. Deciding in advance which baseline you will explain results on keeps you from being buffeted by a single month’s number.
Yardstick 2: the normal size of the swing differs by price band. The H1 year-on-year moved across 35.2 points for city hotels and 11.7 points for business hotels. The higher the price band, the more it is dragged by the height of the base year; the lower the band, the more the level holds. Which of these two norms your own swing resembles becomes a premise for budget design.
Yardstick 3: separate rate from inventory sell-through. Even in June, when the year-on-year on rate was negative, estimated OCC stood high at 87.7% for city and 89.1% for business, and by day of week Saturday was in the 90s for both categories. It is premature to look only at the year-on-year on price and conclude that demand itself thinned. In practice, an H1 review works best when these two axes are set out separately and then overlaid again.
About the data
- Definition of estimated OCC: “Occupancy on an OTA-listed inventory basis = 100 − 100 × rooms remaining on OTA listings ÷ total rooms. This is an estimate based on how inventory offered for sale on OTAs is being taken up, and is defined differently from actual room occupancy (it reads higher).” The scope is city and business hotels in Hyogo Prefecture, for the months April to July 2026.
- Booking curve: based on observations from 90 days before the stay date up to the present.
- Definition of the settled ADR estimate: a transacted price level (tax-excluded equivalent) estimated from OTA and other sales data (lowest-plan level × category-specific coefficient, ensembled across multiple channels). Past months are confirmed values; the current and future months are estimates based on present sales conditions. Reconciliation against published operating results gives a median error of 6.6%. Every year-on-year figure in this article compares confirmed values with confirmed values; current and future months, computed on a different basis, are excluded from comparison.
- Breakdown of N: Hyogo city hotels N=46–47 properties (each month from January 2024 to July 2026); Hyogo business hotels N=165–169 properties (same period). For the reference comparisons, Osaka was city N=89–97 / business N=487–503 properties, and Kyoto city N=55–58 / business N=312–329 properties. Observed property counts for estimated OCC were 39–46 for city and 133–149 for business (daily range within the month). Note that November 2025 is excluded from the aggregations and charts in this article, as its property count falls well below the series median — a thin-coverage month.
- Data as of: August 20, 2026. Sales conditions and inventory change daily, so the figures in this article are a snapshot as of the time of retrieval.
References and sources
■ Data sources
Settled ADR estimates were taken from monthly area aggregations for January 2024 to July 2026, covering city hotels (property category) and business hotels in Hyogo, Osaka and Kyoto (Hyogo: city N=46–47 properties / business N=165–169 properties). Estimated OCC covers city and business hotels in Hyogo, aggregated as monthly and day-of-week averages from daily observations for April to July 2026 (observed properties: city 39–46, business 133–149). External statistics reference the Japan Tourism Agency’s “Overnight Travel Statistics Survey” and official announcements from Expo 2025 Osaka, Kansai. Data retrieved as of August 20, 2026.
■ Calculation assumptions
All year-on-year figures compare confirmed values with confirmed values (past months, verified-history basis); current and future months, computed on a different basis, are excluded. The H1 average compares the simple monthly averages of January–June 2026 and January–June 2025. The two-year comparison uses the 2024 value for the same month as its base. The multiple between categories is calculated by dividing the city settled ADR estimate by the business settled ADR estimate. Thin-coverage months whose property count falls well below the series median (November 2025) are excluded from the aggregations and charts.
■ Limitations and caveats
The settled ADR estimate is a transacted price level (tax-excluded equivalent) estimated from sales data, not the actual realized rate of any individual property (reconciliation against published operating results gives a median error of 6.6%). Estimated OCC is an OTA-listed inventory metric and reads higher than actual room occupancy. This article indicates the level and direction of area aggregates and does not represent the results of any individual property. The Expo period and the national demand environment are noted as background to the year-on-year figures, but these are observations recorded over the same period, not identified causes of the rate movements.
- Japan Tourism Agency, “Overnight Travel Statistics Survey (May 2026 second preliminary report; June 2026 first preliminary report)” (released July 31, 2026)
- Japan Tourism Agency, “Overnight Travel Statistics Survey” top page
- Expo 2025 Osaka, Kansai official website, “Visitor numbers and admission ticket sales”
Related reading
- H1 2026 ADR YoY: 16 Prefectures Aligned, 31 Split Across 4 Categories
- Osaka Settled ADR June 2026: City -26.3%, Business -32.8% Post-Expo
- Kyoto Hotel ADR Falls YoY in June 2026: City -14.6%, Business -9.8%
- Hyogo Booking Curves: 3.6x Pickup Gap, Ryokan Sellout Rate 28.4%
- Kanagawa ADR Splits: City Hotels +20.9%, Business −1.7% in June 2026
- Hokkaido ADR H1 2026: City −5.7%, Business +4.1%, April the Turn
- Chiba Settled ADR: H1 2026 Beats Last Year, July Turns -8.2%
- Kyoto Day-of-Week OCC: Thursday 90.4% Edges Friday, May–Jul 2026