

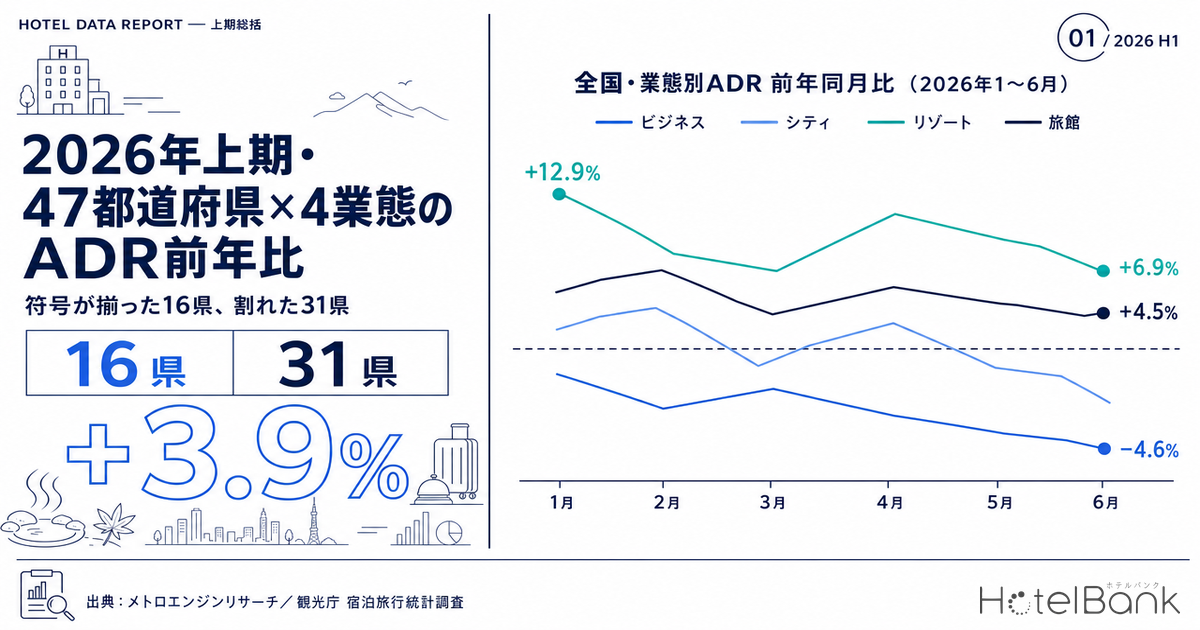
The first half of 2026 (January–June) is now final. There is no shortage of articles covering hotel room rates for a single prefecture in a single month, but no one has yet taken in all 47 prefectures broken out by four hotel categories at once. Using MetroEngines Research settled ADR estimates, this article tests all 47 prefectures × 4 categories = 188 series for whether each month from January to June 2026 came in above the same month a year earlier, counting the “number of months above prior year” on a 0–6 scale. The headline result: first-half rates rose +3.9% year on year on a national composite basis, but the shape of that growth diverged sharply by category — only 16 prefectures had all four categories pointing the same way, while the remaining 31 were split by category.
Metric Definitions Used in This Article
- ADR (average daily rate): A settled-rate estimate (tax-exclusive equivalent) calculated by applying category-specific adjustment coefficients to the lowest published plan level each property lists on OTAs (two guests per room, per-room rate, tax included). Cross-checked against property-level results disclosed by listed hotel REITs, the median error is approximately 7%. These are estimates and differ from each property’s actual transacted rates and accounting figures. Area-level ADR is the median of the properties covered (the level of a typical property in that area).
- Months above prior year: For each month from January to June 2026, the number of months (0–6) in which that prefecture’s settled ADR estimate for that category exceeded the same month a year earlier.
- Category: Four segments — Business, City, Resort, and Ryokan. Aggregation is performed independently within each category, and no ratios are calculated across categories (all-category published prices and category-level settled ADR estimates have different scopes). National figures are weighted by the property count of each prefecture.
- Data source: MetroEngines Research (all January–June 2026 figures are aggregated on a finalized basis). Macro guest-night and occupancy figures are from the Japan Tourism Agency’s Overnight Travel Statistics Survey.
- — National composite +3.9% — Settled ADR estimates for H1 2026 rose +3.9% year on year. But 17.5 points of deceleration occurred over six months, from +12.9% in January to −4.6% in June.
- — Resort +6.9%, Ryokan +4.5% led the way, while Business +2.3% and City +1.7% stayed close to flat. The two leisure categories and the two urban categories grew at clearly different rates.
- — Only 16 prefectures were aligned — Across the 188 series that make up 47 prefectures × 4 categories, just 16 prefectures had all four categories moving in the same direction; the remaining 31 were split by category.
- — Months above prior year averaged 4.91 for Business and 3.43 for City. Categories built on corporate demand were the most stable, while those swung by event and inbound demand showed the widest spread between prefectures.
- — Osaka was negative in all four categories (6 points out of 24, last among all prefectures). This is payback against a year-earlier concentration of demand, however — Hyogo, Kyoto, and Shiga all held flat or better.
Nationwide: Resort and Ryokan Led, and All Four Categories Turned Negative in June After a January Peak
Start with the national picture. Weighting first-half settled ADR estimates by property count, year-on-year changes by category were Resort +6.9% (N=1,542 properties), Ryokan +4.5% (N=6,796 properties), Business +2.3% (N=7,355 properties), City +1.7% (N=1,096 properties). The two leisure-heavy categories grew, while the two that absorb urban accommodation demand stayed close to flat.
Looking only at that half-year average, however, misses what actually happened in the first half. Broken out by month, all four categories peaked in January, decelerated steadily from there, and sank into negative territory across the board in June. Resort was +15.8% year on year in January but −2.7% in June. City moved further still, from +13.5% in January to −8.0% in June — a 21.5-point shift in the year-on-year level over six months. Averaging across the six-month first-half frame erases this “earned it early, stalled late” shape.
Source: MetroEngines Research; compiled by the HotelBank Editorial Team
Behind the deceleration is a base effect: the year-earlier level was itself high. The first half of 2025 saw demand concentrate around large-scale events centered on Kansai and Osaka, which makes the 2026 year-on-year comparison progressively heavier toward the back half. On top of that, as discussed below, inbound guest nights ran below prior year throughout the first half, gradually weakening the upward pressure on rates.
Main Chart: Across 47 Prefectures × 4 Categories, How Many of Six Months Beat Prior Year
This is the core of the article. For each of the 188 series we counted how many of the six months came in above the same month a year earlier, and color-coded the result from 0 to 6 in the table below. Higher numbers are shaded darker blue. The right-hand block adds the first-half year-on-year change (%) for reference. Rows are sorted by the total months above prior year across all four categories (0–24), highest first.
| Prefecture | Months above prior year (0–6) | Total /24 |
H1 YoY (%) | ||||||
|---|---|---|---|---|---|---|---|---|---|
| B | C | R | Ry | B | C | R | Ry | ||
| Okinawa | 6 | 6 | 6 | 6 | 24 | +19.1 | +18.5 | +21.4 | +13.9 |
| Tokyo | 5 | 4 | 6 | 6 | 21 | +2.4 | +0.3 | +35.5 | +6.5 |
| Tokushima | 6 | 5 | 5† | 5 | 21 | +6.9 | +11.9 | +11.4 | +9.0 |
| Wakayama | 4 | 6† | 6 | 5 | 21 | +1.9 | +10.9 | +12.9 | +3.8 |
| Fukushima | 4 | 5 | 6 | 6 | 21 | -0.1 | +3.1 | +5.8 | +13.0 |
| Kanagawa | 5 | 6 | 5 | 4 | 20 | +4.1 | +20.1 | +10.0 | +4.2 |
| Nagano | 6 | 5 | 4 | 5 | 20 | +6.1 | +7.7 | +6.8 | +9.4 |
| Fukui | 5 | 5 | 6† | 3 | 19 | +4.1 | +5.7 | +33.5 | +1.3 |
| Ehime | 6 | 4 | 6† | 3 | 19 | +6.0 | +4.5 | +29.3 | +3.0 |
| Shimane | 5 | 4 | 5† | 5 | 19 | +3.1 | +2.6 | +14.3 | +7.8 |
| Hokkaido | 6 | 3 | 4 | 6 | 19 | +6.2 | +5.3 | -0.4 | +15.1 |
| Hiroshima | 5 | 5 | 3 | 6 | 19 | +4.4 | +4.9 | +2.0 | +11.3 |
| Chiba | 6 | 5 | 5 | 3 | 19 | +5.5 | +5.3 | +7.4 | -1.4 |
| Nagasaki | 6 | 1 | 5 | 6 | 18 | +3.1 | -2.5 | +9.4 | +17.8 |
| Tottori | 5 | 4† | 5 | 4 | 18 | +3.7 | +1.4 | +15.0 | +1.3 |
| Oita | 6 | 1 | 6 | 5 | 18 | +9.0 | -5.3 | +12.2 | +4.6 |
| Aichi | 5 | 5 | 4 | 4 | 18 | +4.5 | +10.0 | +2.1 | +3.8 |
| Saga | 6 | 4† | 5† | 3 | 18 | +1.9 | -0.3 | +16.9 | +1.4 |
| Miyazaki | 2 | 5 | 5 | 5 | 17 | -0.8 | +15.5 | +11.3 | +9.0 |
| Miyagi | 6 | 5 | 1 | 5 | 17 | +10.1 | +14.9 | -8.3 | +9.8 |
| Nara | 5 | 1† | 6† | 5 | 17 | +6.3 | -8.6 | +14.6 | +6.1 |
| Yamagata | 3 | 5 | 4 | 5 | 17 | +0.8 | +5.0 | +3.0 | +7.5 |
| Kagawa | 4 | 4 | 3 | 6 | 17 | +4.3 | +5.1 | -5.9 | +12.1 |
| Akita | 6 | 4 | 3† | 4 | 17 | +4.3 | +3.0 | -2.3 | +4.5 |
| Ibaraki | 6 | 3 | 3 | 5 | 17 | +4.4 | -2.4 | -9.7 | +15.9 |
| Aomori | 4 | 3 | 3† | 6 | 16 | +3.7 | -4.7 | +2.8 | +20.1 |
| Kagoshima | 5 | 3 | 2 | 6 | 16 | +3.1 | -0.7 | -4.9 | +20.5 |
| Fukuoka | 6 | 6 | 2 | 2 | 16 | +10.9 | +10.8 | -3.8 | -1.5 |
| Gunma | 6 | 2 | 4 | 4 | 16 | +5.3 | -4.9 | +10.9 | +3.8 |
| Tochigi | 5 | 3 | 3 | 5 | 16 | +1.6 | -2.8 | -3.1 | +9.2 |
| Saitama | 5 | 5 | 0† | 6 | 16 | +2.3 | +5.8 | -35.3 | +13.7 |
| Shizuoka | 4 | 3 | 4 | 4 | 15 | +1.5 | +4.7 | +4.5 | +6.4 |
| Kumamoto | 5 | 3 | 5 | 2 | 15 | +2.7 | +3.7 | +9.1 | -3.8 |
| Kochi | 5 | 4† | 2† | 4 | 15 | +4.0 | +6.6 | -6.3 | +3.2 |
| Ishikawa | 2 | 4 | 5† | 4 | 15 | -0.4 | +2.9 | +3.2 | -0.2 |
| Iwate | 5 | 5 | 2 | 3 | 15 | +4.3 | +1.7 | -3.8 | +0.2 |
| Kyoto | 3 | 2 | 6 | 3 | 14 | +1.3 | -4.2 | +32.2 | +0.5 |
| Niigata | 6 | 1 | 4 | 3 | 14 | +4.9 | -3.1 | +8.1 | +1.9 |
| Hyogo | 4 | 3 | 3 | 4 | 14 | +2.9 | +1.7 | +2.9 | +2.9 |
| Gifu | 6 | 0 | 4 | 4 | 14 | +6.7 | -4.2 | +0.6 | +4.5 |
| Okayama | 5 | 3 | 1 | 5 | 14 | +3.4 | -3.8 | -8.2 | +10.8 |
| Yamaguchi | 6 | 0 | 4 | 3 | 13 | +3.4 | -6.4 | +9.6 | -1.2 |
| Shiga | 6 | 2 | 1 | 4 | 13 | +4.8 | -1.7 | -2.9 | +4.3 |
| Mie | 4 | 1 | 3 | 3 | 11 | +5.2 | -3.9 | -2.3 | -0.1 |
| Yamanashi | 6 | 1† | 3 | 1 | 11 | +7.8 | -18.5 | +0.7 | +0.0 |
| Toyama | 3 | 1 | 4† | 1 | 9 | -0.9 | -3.7 | +10.0 | -6.8 |
| Osaka | 1 | 1 | 3† | 1 | 6 | -18.4 | -8.8 | -7.9 | -10.5 |
B = Business, C = City, R = Resort, Ry = Ryokan. † marks series with fewer than 10 properties in the sample (a thin base, where single-month swings show up large). 19 of the 188 series are flagged.
Source: MetroEngines Research; compiled by the HotelBank Editorial Team
Scanning the table, the likelihood of beating prior year clearly differs by category. Averaged across the 47 prefectures, months above prior year run 4.91 for Business, 4.21 for Ryokan, 3.94 for Resort, and 3.43 for City. Business cleared prior year in all six months in 19 prefectures, while City did so in only 4. City also had 10 prefectures with one month or less above prior year — the least directionally settled of the four categories.
Source: MetroEngines Research; compiled by the HotelBank Editorial Team
The gap is explained by who drives the demand. Business rests on the relatively stable base of corporate travel, and labor-shortage cost pass-through works almost anywhere in the country. City, by contrast, is pulled by both inbound visitors and MICE/event demand, so prefectures that hosted large-scale business a year earlier take the payback head-on. For Resort and Ryokan, local tourism assets themselves determine drawing power, which produces wide variation between prefectures.
Prefectures That Stayed Aligned: 10 Where All Four Categories Beat Prior Year in at Least Four Months
Ten prefectures cleared prior year in at least four of six months in every one of the four categories. Whichever category you look at within these markets, rate increases stuck — a sign of underlying strength.
| Prefecture | Months above prior year | H1 YoY | Properties B/C/R/Ry | ||||||
|---|---|---|---|---|---|---|---|---|---|
| Okinawa | 6 | 6 | 6 | 6 | +19.1% | +18.5% | +21.4% | +13.9% | 195/11/265/18 |
| Tokyo | 5 | 4 | 6 | 6 | +2.4% | +0.3% | +35.5% | +6.5% | 910/106/18/55 |
| Tokushima | 6 | 5 | 5 | 5 | +6.9% | +11.9% | +11.4% | +9.0% | 74/10/6/50 |
| Wakayama | 4 | 6 | 6 | 5 | +1.9% | +10.9% | +12.9% | +3.8% | 72/8/36/108 |
| Fukushima | 4 | 5 | 6 | 6 | -0.1% | +3.1% | +5.8% | +13.0% | 155/18/31/237 |
| Kanagawa | 5 | 6 | 5 | 4 | +4.1% | +20.1% | +10.0% | +4.2% | 212/41/47/270 |
| Nagano | 6 | 5 | 4 | 5 | +6.1% | +7.7% | +6.8% | +9.4% | 166/16/123/517 |
| Shimane | 5 | 4 | 5 | 5 | +3.1% | +2.6% | +14.3% | +7.8% | 54/10/6/102 |
| Tottori | 5 | 4 | 5 | 4 | +3.7% | +1.4% | +15.0% | +1.3% | 51/8/10/79 |
| Aichi | 5 | 5 | 4 | 4 | +4.5% | +10.0% | +2.1% | +3.8% | 326/30/10/138 |
Source: MetroEngines Research; compiled by the HotelBank Editorial Team
The leader is Okinawa, the only prefecture where all four categories beat prior year for six straight months. First-half year-on-year changes were Business +19.1%, City +18.5%, Resort +21.4%, and Ryokan +13.9%. Resort posted growth above 20% on a thick base of 265 properties, which cannot be explained by single-month chance. Beyond its standing as a destination for domestic leisure demand, a relatively heavy share of inbound visitors from outside East Asia appears to have underpinned the resilience through the first half.
Tokyo benefited from both corporate and leisure accommodation demand. Business rose +2.4% on a base of 910 properties — among the largest in the country — and Ryokan rose +6.5%, clearing prior year in all six months. City, however, was flat at +0.3% and beat prior year in only four months. The high-price segment in central Tokyo was already at a high level a year earlier, and finding further headroom has become difficult.Kanagawa was led by City at +20.1% (N=41 properties), above prior year in all six months. Ryokan in Hakone and Yugawara (N=270 properties) were also solid at +4.2%, so both the urban and hot-spring layers of this two-tier market worked at once.
Nagano secured close to double-digit growth at +9.4% across 517 ryokan, one of the largest bases in the country. The January–March ski season drove it, with January at +21.9%. Fukushima stands out even within the Tohoku region, with ryokan above prior year in all six months at +13.0% (N=237 properties). As the +31.4% in January shows, winter hot-spring demand pushed rates up firmly. Tokushima, Wakayama, Tottori, Shimane all had smaller property bases, but all four categories moved up together — regional destinations where a recovery in leisure demand and steady corporate demand took hold at the same time.
Fifteen prefectures were positive year on year in all four categories in the first half. Of the ten above, Fukushima does not qualify because Business was −0.1%; the remaining nine are joined by Fukui, Hyogo, Yamagata, Hiroshima, Ehime, and Shizuoka. Conversely, only one prefecture was negative in all four categories: Osaka, discussed below.
Prefectures That Split: 31 Where Direction Differed by Category
The most distinctive finding in this analysis is that 31 of the 47 prefectures split by category. Framing the market as “the prefecture went up” or “went down” in fact does not hold for the majority of prefectures. Seventeen prefectures had at least one category at +3% or better sitting alongside another at −3% or worse; the twelve with the widest gaps are listed below (restricted to series with at least 10 properties on both sides).
| Prefecture | Strongest category | Category with the most room to recover | Gap |
|---|---|---|---|
| Kyoto | Resort +32.2% (N=14) | City -4.2% (N=58) | 36.4pt |
| Ibaraki | Ryokan +15.9% (N=97) | Resort -9.7% (N=13) | 25.6pt |
| Kagoshima | Ryokan +20.5% (N=86) | Resort -4.9% (N=50) | 25.4pt |
| Aomori | Ryokan +20.1% (N=74) | City -4.7% (N=16) | 24.8pt |
| Miyagi | City +14.9% (N=20) | Resort -8.3% (N=17) | 23.2pt |
| Okayama | Ryokan +10.8% (N=58) | Resort -8.2% (N=21) | 19.0pt |
| Kagawa | Ryokan +12.1% (N=43) | Resort -5.9% (N=13) | 18.0pt |
| Oita | Resort +12.2% (N=39) | City -5.3% (N=14) | 17.5pt |
| Yamaguchi | Resort +9.6% (N=14) | City -6.4% (N=10) | 16.0pt |
| Gunma | Resort +10.9% (N=34) | City -4.9% (N=12) | 15.8pt |
| Fukuoka | Business +10.9% (N=335) | Resort -3.8% (N=13) | 14.7pt |
| Kumamoto | Resort +9.1% (N=20) | Ryokan -3.8% (N=235) | 12.9pt |
Source: MetroEngines Research; compiled by the HotelBank Editorial Team
Covers the 34 prefectures with at least 10 properties in both Resort and Ryokan. Upper right (both positive) 19 prefectures; lower right and upper left (split signs) 13; lower left (both negative) 2.
Source: MetroEngines Research; compiled by the HotelBank Editorial Team
The nature of the split differs by prefecture. Five patterns can be distinguished.
1. Prefectures where a metropolitan core and tourist destinations coexist — Kyoto. Resort rose sharply at +32.2% (N=14 properties), while City was −4.2% (N=58 properties) and beat prior year in only two months. City hotel supply within Kyoto City has continued to accumulate, making it harder to clear the high level of a year earlier. Resort, on the other hand, swings widely on a thin base, and it is worth noting that the occupancy mix at a small number of high-price properties moves the figure. Kyoto’s rate trend is broken down by month in a separate article.
2. Prefectures led by hot-spring ryokan while Resort works through payback — Ibaraki, Kagoshima, Okayama, and Kagawa. Ibaraki had Ryokan at +15.9% (N=97 properties) against Resort at −9.7% (N=13 properties); Kagoshima had Ryokan at +20.5% (N=86 properties) against Resort at −4.9% (N=50 properties). Both have thick ryokan bases, so the growth is reliable. Ryokan can pass the rising food cost of one-night-two-meal stays through to rates, so changes in cost structure show up directly in pricing. Resort, meanwhile, is absorbing payback from a year in which group and tour demand was heavy.
3. Prefectures with strong corporate demand where the leisure side paused — Fukuoka, Gifu, Mie, and Iwate. Fukuoka delivered a clear result with Business at +10.9% (N=335 properties), above prior year in all six months, while Resort at −3.8% (N=13 properties) and Ryokan at −1.5% (N=74 properties) moved the other way. Corporate and business-trip demand plus MICE attendance in Fukuoka City pushed rates up, while the prefecture’s hot-spring and coastal areas are still chasing the year-earlier level. On Fukuoka’s first half, see also our single-prefecture breakdown.
4. Prefectures where the urban segment grew and Resort still has room to recover — Miyagi. City at +14.9% (N=20 properties) and Business at +10.1% (N=140 properties) grew close to double digits, while Resort was −8.3% (N=17 properties). Corporate and event demand in Sendai clearly worked, while resorts within the prefecture faced a high year-earlier level and remain mid-recovery.
5. Prefectures where hot-spring ryokan are in payback and Resort grew — Kumamoto and Oita. Kumamoto had Ryokan at −3.8% (N=235 properties) against Resort at +9.1% (N=20 properties). With a ryokan base as thick as 235 properties, this indicates that hot-spring ryokan across the prefecture are at the stage of chasing the year-earlier level. Oita had Resort at +12.2% (N=39 properties) against City at −5.3% (N=14 properties), splitting between the resort profile of Beppu and Yufuin and the urban profile of central Oita City.
In every one of these cases, describing a prefecture with a single average number misreads what is happening. The more a property anchors its pricing to the prefecture average, the more likely it is to drift away from the actual shape of its own category.
Where Kansai’s Payback Sits in the National Comparison
Osaka is the only prefecture where all four categories were negative in the first half. Its total months above prior year was 6 out of 24 — last among the 47 prefectures. First-half year-on-year changes were Business −18.4% (N=498 properties), Ryokan −10.5% (N=39 properties), City −8.8% (N=91 properties), and Resort −7.9% (N=6 properties).
Broken out by month, however, this is not “weak throughout the first half” but “sharply heavier from the month it ran into the year-earlier demand peak.” Business was actually above prior year in January at +3.9%, then the shortfall widened to −23.8% in April, −27.5% in May, and −32.8% in June. City likewise went from +25.0% in January to −26.3% in June. Once the comparison reaches the period when large-scale events concentrated demand a year earlier, the denominator in the year-on-year calculation jumps.
Source: MetroEngines Research; compiled by the HotelBank Editorial Team
What matters is that this is a phase specific to Osaka, not a national trend. Elsewhere in Kansai, Hyogo was positive in all four categories in the first half (Business +2.9%, City +1.7%, Resort +2.9%, Ryokan +2.9%), and Kyoto held roughly flat with Business +1.3% and Ryokan +0.5%. In Shiga, Business beat prior year in all six months (+4.8%). Kansai as a whole did not sink; the single point where demand concentrated most a year earlier is now absorbing the payback. Osaka’s rates retain room to return to a normal growth path once the year-earlier outlier has been worked through.
Volume Fell, Rates Rose — Cross-Checking Against Japan Tourism Agency Statistics
It is worth setting the rate movements above against the “volume” side. According to the Japan Tourism Agency’s Overnight Travel Statistics Survey, total guest nights in the first half of 2026 came in below the same month a year earlier in every month: January 45.46 million (−6.5% YoY), February 47.65 million (−0.7%), March 54.41 million (−2.2%), April 49.11 million (−7.2%), May 54.29 million (−3.2%), and June 46.78 million (−6.5%). The simple six-month total is approximately 297.70 million guest nights (January–May are second preliminary figures; June is a first preliminary figure).
In June, inbound guest nights were 12.51 million, −11.9% year on year, and the room occupancy rate was 56.2% (as of June 2026), down 2.6 points from the same month a year earlier. Occupancy by facility type (as of June 2026) was 70.9% for business hotels, 69.1% for city hotels, 50.4% for resort hotels, 35.3% for ryokan, and 23.0% for simple accommodations.
Source: Japan Tourism Agency, Overnight Travel Statistics Survey / MetroEngines Research; compiled by the HotelBank Editorial Team
Volume down, rates up. That is the combination the first-half accommodation market moved on. In June, however, both turned negative at once — a point at the end of the first half where the lift in rates could no longer absorb the decline in volume. That June crossover is material worth weighing when setting second-half pricing.
Note on statistical comparability: Beginning with the January 2026 survey, the Japan Tourism Agency’s Overnight Travel Statistics Survey changed the stratification basis of its sample design from number of employees to number of guest rooms. The Agency itself notes that year-on-year changes and differences may include effects of this revision. The year-on-year figures above need to be read with that change factored in.
Summary — Taking Stock of the First Half, and How to Read the Second
Viewing all 47 prefectures × 4 categories of H1 2026 at once, four points stand out.
First, national settled ADR estimates grew +3.9% year on year, but that growth was front-loaded. From +12.9% in January to −4.6% in June, 17.5 points of deceleration occurred in six months. A single first-half average number conceals this shape.
Second, how readily a category beat prior year differed clearly by segment. Months above prior year averaged 4.91 for Business against 3.43 for City. The more a category rests on corporate demand, the more stable it was; the more it is swung by event and inbound demand, the wider the spread between prefectures.
Third, 31 of the 47 prefectures split by category. The “the prefecture rose / fell” framing in fact applies only to a minority of prefectures. Some, like Kyoto, opened a gap of nearly 37 points between Resort and City; others, like Fukuoka, opened nearly 15 points between Business and Resort. The reference point for your own pricing should be the same category in the same prefecture, not the prefecture average.
Fourth, most prefectures below prior year are working through payback from the year before. Osaka was negative in all four categories, but this is payback against a year-earlier concentration of demand, not structural weakness. Ryokan in Kumamoto and resorts in Ibaraki and Miyagi are likewise at the stage of chasing a high year-earlier level. Markets that finish absorbing the payback retain room to return to the next growth path.
Looking to the second half, the focus is the June point where volume and rates turned negative together. How to get through months carrying a heavy year-earlier base, and identifying which of the two waves your own category is riding within your prefecture, will determine pricing accuracy.
Related Reading
- Kyoto Hotel ADR Falls YoY in June 2026: City −14.6%, Business −9.8%, Broken Down by Month
- Fukuoka Settled ADR Beat Prior Year in All Six Months of H1 — Osaka −32.8% in June, and How to Redraw the Mid-Tier Price Range
- Aichi Settled ADR, 18 Months Final — City Swung 25.0pt Year on Year, Business 14.0pt
- Tokyo Business Hotel ADR, 12-Month Trend | A 30% Price Gap Between the Central 5 Wards and the Outer 18
References and Sources
■ Data Sources
MetroEngines Research settled ADR estimates (47 prefectures × 4 categories × January 2025–June 2026, 188 series in total; Business N=7,355 / City N=1,096 / Resort N=1,542 / Ryokan N=6,796 properties). Volume metrics (guest nights, room occupancy rate) are from the Japan Tourism Agency’s Overnight Travel Statistics Survey.
■ Calculation Assumptions
“Months above prior year” counts as 1 each month in which a prefecture’s settled ADR estimate for a given category exceeded the same month a year earlier, aggregated on a 0–6 scale across the six months from January to June 2026. The H1 year-on-year change is on a six-month total basis. National figures are weighted by each prefecture’s property count, and no ratios are calculated across categories.
■ Limitations and Caveats
Settled ADR is an estimate produced by applying category-specific adjustment coefficients to OTA published prices; cross-checked against property-level disclosures from listed hotel REITs, the median error is approximately 7%. It differs from actual transacted rates and accounting figures. Series with fewer than 10 properties in the sample (19 of the 188) show large single-month swings. Beginning with the January 2026 survey, the Japan Tourism Agency changed the stratification basis of its sample design from number of employees to number of guest rooms, so year-on-year figures may include effects of this revision.
■ Market Data
- MetroEngines Research — settled ADR estimates (47 prefectures × 4 categories × January 2025–June 2026, 188 series in total; Business N=7,355 / City N=1,096 / Resort N=1,542 / Ryokan N=6,796 properties)
■ Government Statistics
- Japan Tourism Agency, Overnight Travel Statistics Survey (June 2026 first preliminary figures and others)
- Japan Tourism Agency press release, “Overnight Travel Statistics Survey (April 2026 second preliminary, May 2026 first preliminary, and 2025 annual figures (final))”
- Japan Tourism Agency press release, “Overnight Travel Statistics Survey (March 2026 second preliminary, April 2026 first preliminary)” — includes a note on the stratification basis change
- Japan Tourism Agency press release, “Overnight Travel Statistics Survey (February 2026 second preliminary, March 2026 first preliminary)”