

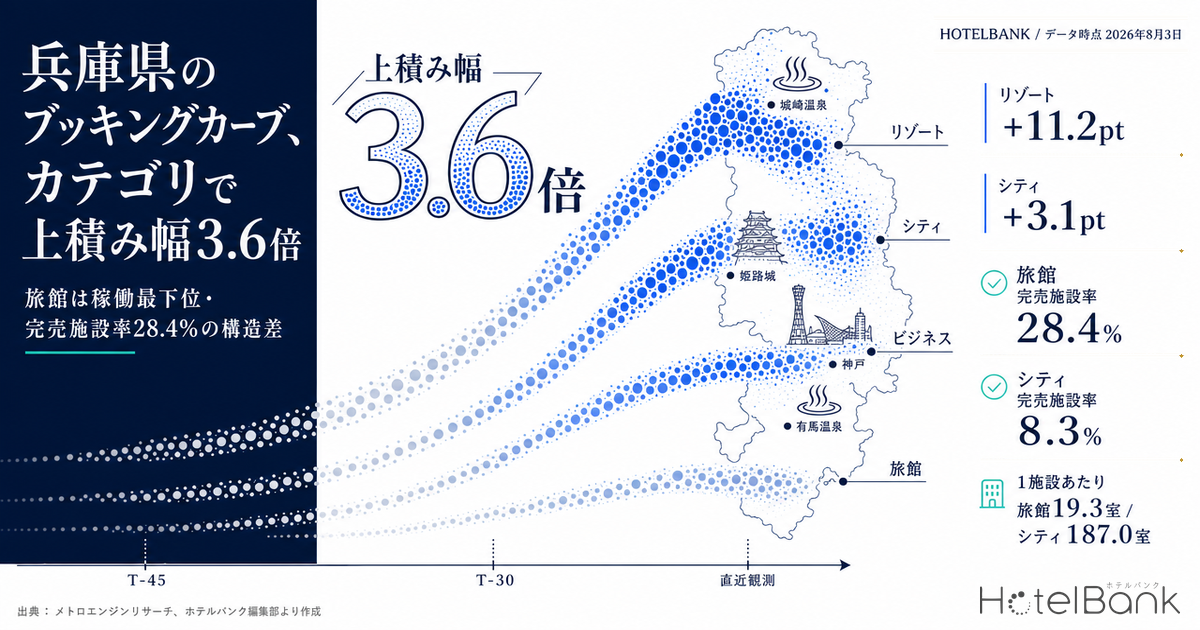
As of August 3, 2026, lining up Hyogo Prefecture’s booking curves by category shows that for the same stay date, categories differ not only in how much has already been booked but also in how many points are still left to add. Estimated OCC at 45 days before the stay date (T-45) reads 80.8% for city hotels (as of August 2026), 75.0% for business hotels, 67.7% for resort hotels and 65.8% for ryokan (all five-stay-date averages, OTA-listed-inventory basis). The pickup from there to the latest observation is +11.2pt for resort hotels, +6.8pt for business hotels, +4.7pt for ryokan and +3.1pt for city hotels — a spread of as much as 3.6x. At the latest observation, ryokan post the lowest estimated OCC of the four categories at 70.5% (as of August 2026, five-stay-date average), yet their sellout rate of 28.4% is 3.4x that of city hotels (8.3%). This inversion — the category with the lowest occupancy having the most sold-out properties — is explained by a difference in inventory structure: an average of 19.3 rooms per property for ryokan versus 187.0 rooms for city hotels. This article compares the booking curves of Hyogo’s four categories at three fixed points (T-45, T-30 and the latest observation) and sets out how to read them for revenue management.
Scope: Hyogo Prefecture — city hotels N=46 properties, business hotels N=149 properties, ryokan N=253 properties, resort hotels N=47 properties (all at the latest observation cross-section). Price figures in this article are estimated settled ADR (the transaction price level estimated from OTA and other sales data, tax-exclusive equivalent); occupancy figures are estimates on an OTA-listed-inventory basis. Definitions for both are given at the end of the article. Data as of August 3, 2026.
- — Estimated OCC at T-45 is 80.8% for city hotels, 75.0% for business hotels, 67.7% for resort hotels and 65.8% for ryokan (as of August 2026, five-stay-date averages). The ranking by level tracks property scale almost exactly.
- — Pickup differs by as much as 3.6x. From T-45 to the latest observation: resort hotels +11.2pt, business hotels +6.8pt, ryokan +4.7pt, city hotels +3.1pt. How much time is left to recover varies by category.
- — Ryokan sit last on estimated OCC at 70.5% (as of August 2026) yet lead on sellout rate at 28.4%, 3.4x the city hotel figure (8.3%). Occupancy and tightness invert.
- — The inversion comes from inventory scale. Average rooms per property are 19.3 for ryokan versus 187.0 for city hotels — a gap of roughly 9.7x — so room-count-weighted OCC masks tightness at the individual-property level.
- — Price direction splits by category. Year-on-year estimated settled ADR for confirmed months: city hotels -12.4% in June 2026 and -7.5% in July; business hotels -0.4% and +1.5%.
Pickup from T-45 varies by a factor of 3.6 across categories
The table below averages estimated OCC (OTA-listed-inventory basis) at three fixed points — T-45, T-30 and the latest observation — across five stay dates in August 2026 (August 15, 19, 22, 26 and 29). For all five dates the observation window runs from 45 days before the stay date to the latest reading (observed August 2, 2026), and at the latest observation the remaining days to arrival range from 13 to 27.
| Category | 45 days out | 30 days out | Latest observation | Pickup (45 days out → latest) |
Observed properties, range (45 days / 30 days / latest) |
|---|---|---|---|---|---|
| City hotels | 80.8% | 83.3% | 83.9% | +3.1pt | 42-44 / 43-46 / 46 |
| Business hotels | 75.0% | 78.7% | 81.8% | +6.8pt | 137-141 / 139-146 / 147-149 |
| Resort hotels | 67.7% | 72.7% | 78.8% | +11.2pt | 41-45 / 43-45 / 46 |
| Ryokan | 65.8% | 68.8% | 70.5% | +4.7pt | 175-206 / 175-221 / 246-249 |
Source: compiled by the HotelBank Editorial Team from MetroEngines Research data. Pickup is calculated on unrounded values, so it may differ from the difference of the displayed figures by up to 0.1pt
The single most important point here is that the ranking by level and the ranking by pickup do not match. At T-45, city hotels sit highest (80.8%) and ryokan lowest (65.8%), but on pickup, resort hotels stand out (+11.2pt) while city hotels are the smallest (+3.1pt). In other words, city hotels have essentially finished building their book early and depend little on last-minute demand. Resort hotels, conversely, sit only third of the four categories at T-45 yet reach 78.8% at the latest observation, closing in on business hotels. Even when two properties are both “not growing occupancy,” the meaning is entirely different for a city hotel and a resort hotel. This structure, in which pickup diverges sharply by category, is not unique to Hyogo — the same pattern of separate curves by property type appears in Tokyo, where booking curves fall into three distinct types.
The chart below overlays the four categories’ estimated OCC for a Saturday, August 29, 2026 stay, from 45 days out to the latest observation (27 days out). Look not at the height of the lines but at the difference in their slopes.
Source: compiled by the HotelBank Editorial Team from MetroEngines Research data
Taking the Saturday, August 29 stay date on its own, city hotels move from 83.6% at 45 days out (43 properties observed) to 86.2% at 27 days out (46 properties), a pickup of just +2.6pt, while resort hotels move from 72.1% (45 properties) to 79.2% (46 properties), a gain of +7.1pt. Business hotels go from 77.9% (139 properties) to 81.8% (147 properties), +3.9pt, and ryokan from 65.0% (206 properties) to 67.6% (246 properties), +2.6pt. Ryokan stay low in level and their curve is close to flat. That means the simple reading — “there is plenty of room left to sell” — does not apply, and the following sections examine why from a structural angle.
Day-of-week gaps are category-specific too — for ryokan, Saturday and weekdays are level
Next, to hold observation conditions constant, we isolate the T-45 cross-section alone and line it up by stay date. Because every figure is measured at the same 45 days out, the day-of-week pattern can be read without worrying about differences in booking progress.
| Stay date | City | Business | Resort | Ryokan |
|---|---|---|---|---|
| Sat, August 15 | 79.5% (N=42) | 75.8% (N=137) | 73.6% (N=41) | 66.7% (N=185) |
| Wed, August 19 | 78.8% (N=44) | 75.2% (N=139) | 59.6% (N=45) | 64.8% (N=175) |
| Sat, August 22 | 84.7% (N=44) | 75.9% (N=138) | 73.9% (N=43) | 67.4% (N=202) |
| Wed, August 26 | 77.5% (N=42) | 70.2% (N=141) | 59.1% (N=44) | 65.0% (N=180) |
| Sat, August 29 | 83.6% (N=43) | 77.9% (N=139) | 72.1% (N=45) | 65.0% (N=206) |
| Tue, September 1 | 75.8% (N=42) | 67.1% (N=139) | 58.2% (N=38) | 67.0% (N=157) |
| Sat, September 5 | 87.8% (N=43) | 79.7% (N=140) | 68.3% (N=44) | 65.2% (N=193) |
| Tue, September 8 | 76.9% (N=45) | 70.5% (N=143) | 65.8% (N=42) | 63.7% (N=189) |
| Sat, September 12 | 85.2% (N=46) | 78.4% (N=138) | 70.8% (N=47) | 63.8% (N=246) |
| Wed, September 16 | 75.7% (N=46) | 68.6% (N=145) | 59.2% (N=46) | 67.4% (N=237) |
| Saturday average (5 dates) | 84.2% | 77.5% | 71.7% | 65.6% |
| Weekday average (5 dates) | 76.9% | 70.3% | 60.4% | 65.6% |
| Saturday − weekday | +7.2pt | +7.2pt | +11.4pt | +0.0pt |
Source: compiled by the HotelBank Editorial Team from MetroEngines Research data. All figures are estimated OCC (OTA-listed-inventory basis) at 45 days before the stay date
Even at a stage as early as T-45, the gap between Saturdays and weekdays already separates clearly by category. Resort hotels are the most weekend-skewed at +11.4pt, while city hotels and business hotels both read +7.2pt. Ryokan, by contrast, average 65.6% across five Saturdays and 65.6% across five weekdays — effectively zero difference.
There are two ways to read the day-of-week flatness of ryokan. One is that weekend inventory was already filled at a stage even earlier than T-45, so that by the 45-days-out cross-section the quality of remaining inventory has evened out across weekends and weekdays alike. The other is a structural constraint: each property simply does not hold enough inventory to absorb demand concentrated on weekends. Hyogo’s ryokan category is centred on small properties in onsen towns such as Kinosaki and Arima, which makes the latter factor more likely to bind. Either way, the reading is that in the ryokan category the conventional day-of-week playbook — hold price on weekends, fill weekdays — is already hard to run at the T-45 cross-section.
“Last on occupancy, first on sellout rate” for ryokan is explained by inventory structure
This is the core of the article. At the latest observation (13 to 27 days out, averaged across five stay dates in August 2026), estimated OCC for ryokan is the lowest of the four categories at 70.5% (as of August 2026). Yet at the same cross-section their sellout rate is the highest at 28.4%, 3.4x the city hotel figure (8.3%). An inversion is occurring in which the category with the lowest occupancy has the most properties whose listed inventory can no longer be found.
| Category | July 2026 confirmed average estimated OCC |
Latest observation estimated OCC |
Latest observation sellout rate |
Average rooms per property |
|---|---|---|---|---|
| City hotels | 89.3% (N=42-46) | 83.9% | 8.3% | 187.0 rooms |
| Business hotels | 90.9% (N=142-149) | 81.8% | 13.4% | 114.5 rooms |
| Resort hotels | 83.7% (N=39-47) | 78.8% | 18.3% | 49.4 rooms |
| Ryokan | 82.7% (N=189-256) | 70.5% | 28.4% | 19.3 rooms |
Source: compiled by the HotelBank Editorial Team from MetroEngines Research data. Average rooms per property is total rooms divided by property count at the August 29, 2026 stay-date cross-section; the breakdown at that cross-section is city hotels 46 properties / 8,601 rooms, business hotels 147 properties / 16,829 rooms, resort hotels 47 properties / 2,320 rooms, ryokan 253 properties / 4,879 rooms
Source: compiled by the HotelBank Editorial Team from MetroEngines Research data
As the chart shows, sellout rate lines up cleanly in the opposite direction to average rooms per property. At 19.3 rooms for ryokan against 187.0 rooms for city hotels, property scale differs by roughly 9.7x. That gap is what produces the inversion between estimated OCC and sellout rate.
The mechanism works as follows. Estimated OCC is a room-count-weighted metric: it expresses how much listed inventory has been absorbed relative to the prefecture’s total room count. Sellout rate, by contrast, is a ratio counted one property at a time. At the August 29, 2026 stay-date cross-section, the ryokan category comprises 253 properties and 4,879 total rooms. Because a single property holds fewer than 20 rooms, only a handful of bookings is enough for its listed inventory to disappear, and such properties pile up. Yet the weight of any one property within those 4,879 rooms is tiny, so even as sellouts accumulate at the property level, prefecture-wide estimated OCC barely moves up. City hotels are the reverse: 46 properties and 8,601 rooms. Because each property holds a large block of inventory, property-level sellouts are rare, but when one property moves, its contribution to prefecture-wide estimated OCC is large.
This asymmetry feeds directly into revenue management for the ryokan category. Reading the prefecture-wide estimated OCC figure of 70.5% (as of August 2026) as “a market that is still 30% empty” leads to the wrong call. In reality, close to 30% of the 246 to 249 properties observed already show no findable listed inventory, and the remaining inventory sits concentrated in particular properties and particular room types. Average market occupancy and the tightness of the competitive set a given property actually faces are especially prone to diverge in the ryokan category. This divergence between market OCC and sellout rate in the ryokan category is not specific to Hyogo: the same configuration shows up in Nagano’s late-summer booking curve for 2026, where the sellout rate for the first week of September reads 25.9%.
Price can be verified for city and business hotels — year-on-year for June and July 2026
On price, we look at year-on-year change for confirmed months in the two categories for which estimated settled ADR has been validated: city hotels and business hotels. Hyogo’s estimated settled ADR (tax-exclusive equivalent) for city hotels was ¥11,473 in June 2026 (N=47 properties) against ¥13,098 in the same month a year earlier (N=47 properties), or -12.4%, and ¥12,131 in July 2026 (N=47 properties) against ¥13,120 a year earlier (N=47 properties), or -7.5%. Business hotels, by contrast, read ¥7,260 in June 2026 (N=166 properties) against ¥7,290 a year earlier (N=167 properties), or -0.4%, and ¥7,673 in July 2026 (N=166 properties) against ¥7,559 a year earlier (N=168 properties), or +1.5% — essentially flat.
Source: compiled by the HotelBank Editorial Team from MetroEngines Research data. November 2025 is excluded from the comparison because its property counts (city hotels N=10, business hotels N=22) differ from other months
On a year overlay, city hotels sit below their 2025 level in both June and July. Business hotels track roughly on top of the prior year, so the direction of price differs between the two categories. Figures from August 2026 onward are estimates based on current sales conditions (city hotels: August ¥14,955, N=47 properties; September ¥14,001, N=47 properties / business hotels: August ¥10,758, N=163 properties; September ¥10,493, N=159 properties) and may move until month-end as sales conditions change. Note that confirmed months are calculated on a validated historical basis whereas the current and following month are calculated on a listing-snapshot basis, so the calculation bases themselves differ. The August and September 2026 estimates reading higher than the confirmed July value reflects that difference in basis together with peak-season sales mix, and a direct comparison against confirmed values has to wait for month-end settlement. Note also that this section covers only validated categories and does not address price levels for ryokan or resort hotels.
For revenue managers running hotels and ryokan in Hyogo — implications and an action plan
(1) Benchmark your curve against your own category’s pickup, not the market average. Pickup from T-45 to the latest observation differs widely: city hotels +3.1pt, business hotels +6.8pt, resort hotels +11.2pt, ryokan +4.7pt. If you run a city hotel and are not at the market level of 80.8% by T-45, the market will only add about +3.1pt over the remaining period. The same condition — “below market at T-45” — leaves a resort hotel +11.2pt of recovery room on the market side, while for a city hotel T-45 is close to the effective final checkpoint. It is worth reframing this as categories having different amounts of usable time left to recover.
(2) How day-of-week strategy works inverts by category. At the T-45 cross-section the Saturday-versus-weekday gap is +11.4pt for resort hotels and +7.2pt for both city and business hotels. Ryokan, meanwhile, show +0.0pt — no gap at all. For resort, city and business hotels, a design that pursues a weekend premium is consistent with the shape of the market; for ryokan there is room to build inventory and pricing on the premise that Saturdays and weekdays are treated with the same intensity. It is worth checking whether your own day-of-week settings run counter to this market shape.
(3) For ryokan, look at sellout rate before market OCC. At the latest observation, ryokan estimated OCC is the lowest at 70.5% (as of August 2026) while their sellout rate is the highest at 28.4%. Given a structure of 19.3 average rooms per property, average market vacancy and actual competitive tightness are prone to diverge. Loosening price because market OCC sits in the 70s (as of August 2026) risks being the only property pricing low in an environment where listed inventory is in fact thin. In the ryokan category, it is worth considering an approach that treats sellout rate as the primary tightness indicator and relegates market OCC to a supporting reference.
(4) The direction of price splits by category. Year-on-year estimated settled ADR for confirmed months reads -12.4% in June 2026 and -7.5% in July for city hotels, and -0.4% in June and +1.5% in July for business hotels. City hotels as a market are building occupancy at a lower price band than a year ago, while business hotels are holding the prior-year level. It is worth reviewing which of these two movements your own pricing calendar has been built around.
| Time horizon | Move | Decision trigger | Objective |
|---|---|---|---|
| Today to this week | Overlay your property’s booking curve for late August to early September on your own category’s three fixed points (45 days out / 30 days out / latest observation) | If your stay dates within 30 days out sit below your category’s latest-observation level (city 83.9%, business 81.8%, resort 78.8%, ryokan 70.5%) | Establish whether you are behind, measured as a gap against your category’s standard shape |
| Today to this week | Compare the intensity gap between your weekend (Saturday) and weekday settings against the market shape for your category | If you run a resort hotel with near-identical Saturday and weekday settings (market T-45 gap +11.4pt), or a ryokan with a large Saturday differential (market T-45 gap +0.0pt) | Align day-of-week design with the direction of the market shape |
| Within two weeks | If you run a ryokan, make your competitive set’s sellout rate the primary tightness indicator and demote market OCC to a supporting reference | If the sellout rate around your property exceeds the ryokan category average of 28.4% while market OCC stays near 70.5% (as of August 2026) | Avoid price cuts driven by an apparent sense of vacancy |
| Within two weeks | If you run a city hotel, switch to treating T-45 as the final checkpoint and keep inventory adjustments beyond that point within a limited range | If market pickup is confined to +3.1pt and your property sits well below the market level of 80.8% at T-45 | Curb excessive discounting during a period with little recovery room |
| Looking to next month | If you run a city hotel, review your price band from October onward alongside the market’s trend in confirmed months | If your settings are moving counter to the market’s confirmed estimated settled ADR (¥12,131 in July 2026) and its -7.5% year-on-year direction | Catch any divergence from the market’s price direction early |
| Looking to next month | If you run a business hotel, rebuild your annual calendar using the prior-year level as the baseline | If the market’s confirmed estimated settled ADR is tracking at prior-year levels (-0.4% in June 2026, +1.5% in July) while your property alone is set well below the prior year | Confirm how much room there is to hold price steady |
Source: compiled by the HotelBank Editorial Team from MetroEngines Research data
Summary — three yardsticks to take away from Hyogo
Yardstick 1: Fix your category’s remaining pickup before anything else. Hyogo’s pickup from T-45 to the latest observation is +3.1pt for city hotels, +6.8pt for business hotels, +11.2pt for resort hotels and +4.7pt for ryokan. Before evaluating your own progress, hold as a fixed value how much your category’s market adds over the remaining period. The same condition — “below market at T-45” — differs by more than 3x in meaning and in the urgency of the response.
Yardstick 2: How day-of-week effects work is an attribute of the category. The Saturday-minus-weekday gap at the T-45 cross-section is +11.4pt for resort hotels, +7.2pt for city and business hotels and +0.0pt for ryokan. Day-of-week strategy should be designed to fit your category’s market shape rather than an industry standard. For ryokan in particular, treating weekends and weekdays with the same intensity is what fits the shape of the market.
Yardstick 3: The smaller the category’s scale, the more market OCC understates tightness. Because average rooms per property differ by roughly 9.7x — 19.3 for ryokan versus 187.0 for city hotels — ryokan can simultaneously post estimated OCC of 70.5% (as of August 2026, lowest of the four) and the highest sellout rate at 28.4%. In categories with small property scale, put the property-level sellout rate rather than room-count-weighted market OCC at the centre of your reading. Keeping that distinction in hand improves the accuracy with which market data translates into decisions at your own property.
About the data
■ Data sources
• Definition of estimated OCC (OTA-listed-inventory basis): occupancy on an OTA-listed-inventory basis = 100 − 100 × rooms remaining on OTA listings ÷ total rooms. It is an estimate based on how far inventory offered for sale on OTAs has been absorbed, and its definition differs from actual room occupancy (it reads higher). Scope is Hyogo Prefecture; the target month is July 2026 (confirmed actuals) plus each stay date from August 15 to September 16, 2026 (progress cross-sections).
• Booking curves: based on observations from 45 days before the stay date through to the most recent reading. The latest observation date is August 2, 2026. Source: aggregated data from MetroEngines Research & Consulting (re-aggregated by the HotelBank Editorial Team).
• Breakdown of N: the booking-curve scope is Hyogo Prefecture — city hotels N=46 properties (8,601 total rooms), business hotels N=149 properties (17,116 rooms), ryokan N=253 properties (4,879 rooms) and resort hotels N=47 properties (2,320 rooms). Actual observed property counts at each observation point are as given in the ranges in the tables in the body text.
■ Calculation assumptions
• The three fixed points (45 days out / 30 days out / latest observation) are simple averages of estimated OCC at each cross-section across the five stay dates of August 15, 19, 22, 26 and 29, 2026. Pickup is calculated on unrounded values and may differ from the difference of the displayed figures by up to 0.1pt.
• Sellout rate: the estimated share of properties whose listed inventory can no longer be found on OTAs and similar channels. It is a ratio counted one property at a time, so its denominator is taken differently from room-count-weighted estimated OCC. The denominator is the set of properties in the same cross-section, and in this article it is based on observation points 13 to 27 days out and the distribution of observed property counts. Occupancy and sellout rate moving in opposite directions stems from this difference in how the denominator is taken.
• Definition of estimated settled ADR: the transaction price level (tax-exclusive equivalent) estimated from OTA and other sales data (lowest-plan level × property-type coefficient, ensembled across multiple channels). Past months are confirmed values on a validated historical basis, while the current and future months are estimates on a listing-snapshot basis; the two are calculated on different bases. Median error against published operating results is 6.6%. Scope is the validated categories, namely city hotels (N=47 properties) and business hotels (N=166 properties), both for the confirmed month of July 2026.
■ Limitations and caveats
• November 2025 is a thin-coverage month whose property counts (city hotels N=10, business hotels N=22) differ substantially from other months, so it is excluded from the price comparison.
• Observed property counts vary by cross-section (for ryokan, 175 to 206 properties at 45 days out against 246 to 249 at the latest observation). Differences between cross-sections can include differences in the depth of the underlying population, so it is more appropriate to use these figures for comparing shapes within the same category than for reading absolute levels.
• Ryokan and resort hotels are not included among the validated categories for estimated settled ADR, so this article does not address their price levels.
• Data as of August 3, 2026. Sales conditions and inventory change daily, so the figures in this article are a snapshot at the time of retrieval.
Related reading
- Tochigi Booking Curves by Type: Resort 81.1% at T-45, Only +2.6pt Left
- Nagano Late-Summer Booking Curve 2026: Ryokan -11.8pt at 45 Days Out
- Hokkaido City Hotels: Only Aug 15 Trails at 78.7% OCC, 45 Days Out
- Osaka Obon 2026 Booking Curve: Aug 14 at 74.9%, Aug 16 Stuck at 64.1%
- Aichi Settled ADR 18 Months: City Swings 25.0pt, Business 14.0pt