

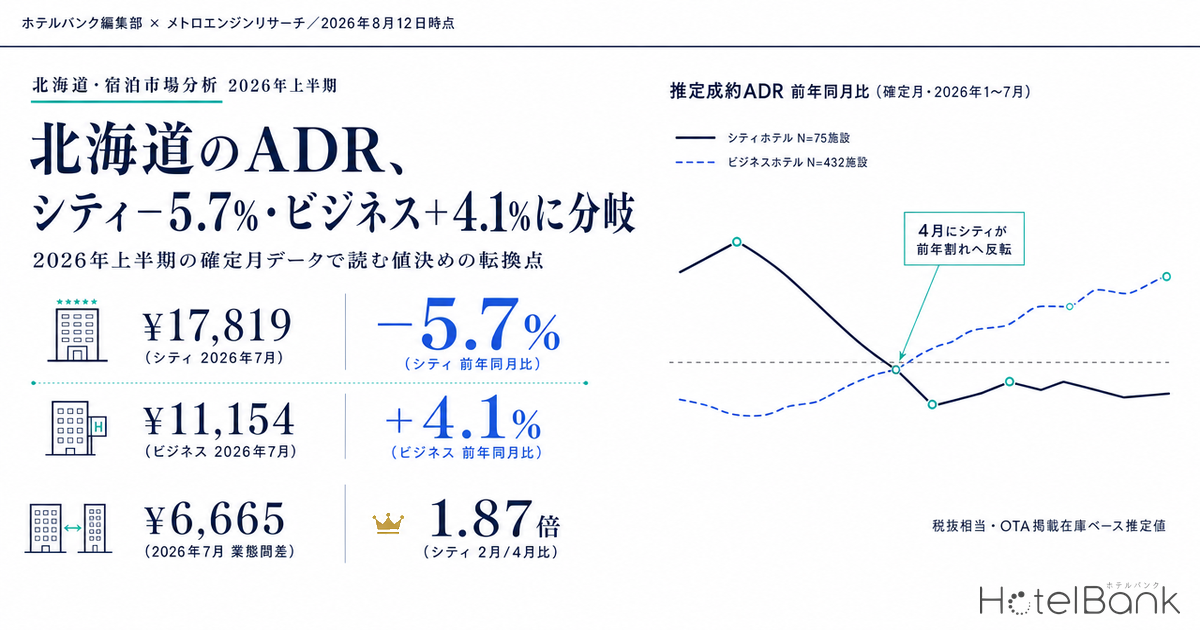
In Hokkaido’s accommodation market, pricing outcomes have split clearly by hotel category. Estimated settled ADR for July 2026 (finalized) came in at ¥17,819 for city hotels (N=75 properties), down 5.7% year on year, while business hotels reached ¥11,154 (N=432 properties), up 4.1% year on year. Early in the year both categories were running well ahead of the prior year, but April marked the turn: city hotels fell below year-ago levels, while business hotels held positive for seven straight months. As a result, the gap between the two categories narrowed by roughly ¥1,500 — from ¥8,179 in July 2025 to ¥6,665 in July 2026. This article uses only finalized-month-to-finalized-month year-on-year comparisons to break down, month by month, what happened across Hokkaido’s two categories, and how to translate that into day-to-day pricing decisions.
Scope: Hokkaido city hotels N=75 properties; business hotels N=429–441 properties (finalized months, January–July 2026). Resort hotels N=128–146 properties are shown for reference. The price metric in this article is estimated settled ADR (the transaction price level estimated from OTA and other sales data, on a pre-tax equivalent basis); occupancy is an estimate based on OTA-listed inventory. Definitions for both appear at the end of the article. Data as of: August 12, 2026.
- — City −5.7% / Business +4.1% — In July 2026, the year-on-year sign for estimated settled ADR split between Hokkaido’s two categories (city ¥17,819, business ¥11,154; both finalized figures).
- — April was the turning point — City hotels reversed from +29.4% in January to −0.9% in April, and the decline then widened in one direction through −5.7% in July.
- — Occupancy stayed high — Estimated OCC in July 2026 was 93.6% for city and 94.2% for business hotels. This is not about unsold rooms; the issue is where the price band is set.
- — Category gap ¥8,179 → ¥6,665 — The distance between the upper and lower price tiers narrowed by about ¥1,500 in one year, changing the premise for setting rate floors.
- — The seasonal shape differs — The February-to-April ratio is 1.87x for city hotels and 1.23x for business hotels. Winter-shaped and flat-shaped properties need separate rate-revision calendars.
Year-on-year by finalized month — city and business diverged from April
First, we match the finalized months (actuals-confirmed basis) from January through July 2026 against the same finalized months a year earlier. Every year-on-year figure is a comparison of finalized values with finalized values; no comparison against current-snapshot estimates is included.
City hotels were in positive territory for the first three months of the year — +29.4% in January, +4.4% in February and +8.4% in March — then slipped marginally below the prior year in April at −0.9%, with the decline widening month by month: −1.4% in May, −3.6% in June and −5.7% in July. Business hotels, by contrast, stayed positive in all seven months, from +14.4% in January to +4.1% in July. Even in April, their weakest month, they held at +0.3%, level with the prior year.
This pattern — where only the upper price tier falls below the prior year — is not unique to city hotels. Resort hotels, a verified category, moved in the same direction at −6.1% in May, −4.9% in June and −4.0% in July. The natural reading is that in Hokkaido the higher-priced categories declined together year on year, and business hotels alone were on the upside. This divergence in sign between categories is not confined to Hokkaido; we break it down by prefecture and category in Japan Hotel ADR Polarization 2026.
Source: MetroEngines Research; compiled by the HotelBank Editorial Team
Laying the figures out month by month makes the breakdown of the category gap more concrete. The table below shows estimated settled ADR and year-on-year change for matched finalized months, along with the monetary gap between the two categories.
| Month | City 2025 | City 2026 | YoY | Business 2025 | Business 2026 | YoY | 2026 category gap |
|---|---|---|---|---|---|---|---|
| January | ¥11,324 | ¥14,658 | +29.4% | ¥7,057 | ¥8,074 | +14.4% | ¥6,584 |
| February | ¥17,410 | ¥18,171 | +4.4% | ¥8,112 | ¥8,769 | +8.1% | ¥9,402 |
| March | ¥10,939 | ¥11,858 | +8.4% | ¥7,018 | ¥7,593 | +8.2% | ¥4,265 |
| April | ¥9,820 | ¥9,728 | −0.9% | ¥7,120 | ¥7,142 | +0.3% | ¥2,586 |
| May | ¥13,738 | ¥13,551 | −1.4% | ¥8,440 | ¥8,857 | +4.9% | ¥4,694 |
| June | ¥15,356 | ¥14,796 | −3.6% | ¥9,298 | ¥9,545 | +2.7% | ¥5,251 |
| July | ¥18,891 | ¥17,819 | −5.7% | ¥10,712 | ¥11,154 | +4.1% | ¥6,665 |
Estimated settled ADR (pre-tax equivalent, finalized values). City N=75 properties (74–76 properties for January–July 2025); business N=429–441 properties (421–426 properties for January–July 2025). Source: MetroEngines Research; compiled by the HotelBank Editorial Team
What deserves attention is how the category gap moved. In February it was essentially flat — ¥9,298 in 2025 against ¥9,402 in 2026 — meaning the two categories held distinctly separate positions through the winter. July, by contrast, narrowed from ¥8,179 in 2025 to ¥6,665 in 2026. As a multiple, city hotels fell from 1.76x business hotels (July 2025) to 1.60x (July 2026). In the same Hokkaido summer demand phase, the price distance the upper tier had maintained over the lower tier thinned markedly in the space of a year.
City in winter, business in summer — the seasonal shape is entirely different by category
Overlaying the annual shapes shows that Hokkaido’s two categories earn in different months to begin with. City hotels build a large peak in February. The finalized figure of ¥18,171 for February 2026 was the highest month of January–July that year, exceeding July’s ¥17,819. The ratio against April (¥9,728), the low season, is 1.87x — wider still than 1.77x in 2025. The structure in which the year’s performance hinges on how much rate can be stacked in winter has, if anything, intensified.
Source: MetroEngines Research; compiled by the HotelBank Editorial Team
Business hotels have an entirely different shape. Across the finalized months of 2026, July’s ¥11,154 was the high and February came in at ¥8,769. February against April (¥7,142) is a ratio of just 1.23x (1.14x in 2025). The swing across the year is small, rising gently toward summer. In other words, within the same Hokkaido market, city hotels build their year on winter rate, while business hotels build theirs by lifting the floor across all twelve months.
Source: MetroEngines Research; compiled by the HotelBank Editorial Team. Figures from August onward are current-snapshot estimates based on present sales conditions (dotted line); because they rest on a different basis from finalized values, levels are not compared directly.
Note that all months from August 2026 onward are current-snapshot estimates based on present sales conditions, which rest on a different basis from finalized values. Year-on-year comparison should wait until the month in question is finalized, and every year-on-year figure in this article is limited to matched finalized months from January to July.
Listed inventory is close to sold out — and rate still falls short of last year
Did rate fall below the prior year because demand thinned? Estimated OCC (OTA-listed-inventory basis) over the same period shows that, at the very least, this is not a case of rooms going unsold.
| Month | Category | Monthly avg. estimated OCC | Lowest day in month | Highest day in month | Properties observed |
|---|---|---|---|---|---|
| June 2026 | City | 90.8% | 81.8% (Sun, Jun 7) | 96.6% (Wed, Jun 24) | 70–74 |
| June 2026 | Business | 91.0% | 79.6% (Sun, Jun 7) | 97.2% (Wed, Jun 24) | 372–391 |
| July 2026 | City | 93.6% | 88.0% (Mon, Jul 20) | 97.5% (Sat, Jul 18) | 68–74 |
| July 2026 | Business | 94.2% | 84.9% (Mon, Jul 20) | 98.4% (Sat, Jul 18) | 368–394 |
Estimated OCC (OTA-listed-inventory basis). Scope: Hokkaido; months covered: June and July 2026. Source: MetroEngines Research; compiled by the HotelBank Editorial Team
Estimated OCC for July 2026 was 93.6% for city and 94.2% for business hotels — a level at which listed inventory is close to sold out. The pace at which Hokkaido’s city category depletes inventory ahead of the stay date is tracked as a fixed-point comparison at 45 days out, 30 days out and most recently in Hokkaido City Hotels: Only Aug 15 Trails at 78.7% OCC, 45 Days Out. On a daily basis, the city category’s lowest day was 88.0% on Monday, July 20, and days below 90% were limited. With listed inventory depleting to this degree, estimated settled ADR for city hotels still came in 5.7% below the same month a year earlier — and that is the core of this data. It is a decline that volume does not readily explain, suggesting instead that the placement of the price band itself, or the mix of higher-rate room types and plans, shifted from the prior year.
Business hotels, conversely, sustained the same 90%-plus depletion pace while pushing rate above the prior year for seven consecutive months. Hokkaido’s business category has a large property base (N=429–441 properties in finalized months), which supports reading this as the market’s floor being lifted overall. The ¥1,500 narrowing between the two categories is the combined result of city hotels coming down and business hotels going up.
For revenue managers running city and business hotels in Hokkaido — implications and an action plan
1. Determine first whether your own property fits the “occupancy is there but rate falls short of last year” pattern. The market’s city category held estimated OCC at 93.6% in July 2026 while estimated settled ADR was down 5.7% year on year. If your own results for that month show the same combination — occupancy flat or better, rate below the prior year — there is room to examine this as a question of where the price band sits rather than one of insufficient demand. If occupancy is also down, that is a different discussion.
2. Match the market range against your own price band on a monthly basis. The finalized-month range for Hokkaido’s city category in 2026 runs from ¥9,728 (April) to ¥18,171 (February); for the business category, from ¥7,142 (April) to ¥11,154 (July). Check where your property sits within that range, and whether its relative position shifts month to month. The city category in particular swings widely by month, so the same “in line with the market” means something different in February than it does in April.
3. Split the rate-revision calendar by whether the property is winter-shaped or summer-shaped. The February-to-April ratio is 1.87x for city and 1.23x for business hotels. Because the two build their annual peak differently within the same region, the months that warrant the most attention also differ. City-shaped properties can concentrate effort on winter rate design; business-shaped properties can concentrate on managing the floor across the full year.
4. Build the narrowing category gap into the premise for your rate floor. The category gap in July 2026 was ¥6,665, down from ¥8,179 the previous July. Upper-tier properties may want to reset their floor on the assumption that the distance to the tier below is no longer what it was. Lower-tier properties can read the narrowed distance as a phase in which to test for upside.
The sequence of actions implied by the above, organized on a timeline:
| Timeline | Action | Decision trigger (figures from this article) | Objective |
|---|---|---|---|
| Today – this week | Lay out your own May–July 2026 by month and separate whether rate or occupancy moved | The market’s city category posted estimated OCC of 93.6% and estimated settled ADR of −5.7% YoY in July 2026. If your property shows the same combination, move to examining the price side | Separate the cause of the decline into demand versus pricing |
| Today – this week | Take stock of floor rates by room type and check whether upper-type floors have drifted too close to lower types | The category gap narrowed from ¥8,179 to ¥6,665 in July | Prevent the price floor of upper types from giving way |
| Within two weeks | Check monthly whether the offered price for the same room under the same conditions differs across sales channels | Where listed inventory keeps depleting in the 90% range yet rate continues to fall short of the prior year | Suppress unintended exposure of low rates |
| Within two weeks | Check whether the sales mix of higher-rate plans (upper room types, meal-inclusive and similar) has shifted from the prior year | If your estimated settled level for the month sits lower than expected against the market’s city ¥17,819 / business ¥11,154 (July 2026, finalized) | Identify rate decline caused by mix |
| Toward next month | Begin winter (January–February) rate design and set monthly target rates in advance | The city category’s February-to-April ratio widened to 1.87x (1.77x the prior year). The market’s finalized February figure is ¥18,171 | Avoid losing the annual peak |
| Toward next month | Establish finalized-month year-on-year change as a standing metric in the monthly review | The market’s reversal had already begun in April (city −0.9%) | Catch turning points earlier |
Source: MetroEngines Research; compiled by the HotelBank Editorial Team
Summary — three yardsticks
Here is Hokkaido’s first half of 2026 in a form you can reuse.
Yardstick 1: The reversal happened in April. Year-on-year change for city hotels fell from +29.4% in January to −0.9% in April, then widened in one direction to −5.7% in July. Taking comfort in the positive figures early in the year means missing the turning point for six months. The habit of lining up finalized-month year-on-year change every month is what catches this kind of reversal soonest.
Yardstick 2: Read occupancy and rate together. Estimated OCC in July 2026 stood high at 93.6% for city and 94.2% for business hotels, and city rate still came in below the prior year. Selling well does not mean the rate is being captured. Only by placing listed-inventory depletion and estimated settled ADR side by side for the same month does the quality of pricing become visible.
Yardstick 3: Do not mix the seasonal shapes of the two categories. City hotels are winter-shaped at a February-to-April ratio of 1.87x; business hotels are flat-shaped at 1.23x. Tracking the market average as a single line means chasing a benchmark that carries no meaning for your own category. If you are designing pricing in Hokkaido, the natural order is to first decide which shape your property belongs to, then set the monthly targets.
About the data
| Item | Detail |
|---|---|
| Definition of estimated OCC | OTA-listed-inventory-based occupancy = 100 − 100 × rooms remaining listed on OTAs ÷ total rooms. It is an estimate based on the depletion of inventory sold on OTAs, and differs in definition from actual room occupancy (it reads higher). The months covered in this article are June 2026 and July 2026. |
| Booking curve | Based on observations from 90 days before the stay date up to the present (estimated OCC uses the final observation point immediately before the stay date). |
| Definition of estimated settled ADR | The transaction price level (pre-tax equivalent) estimated from OTA and other sales data (lowest-plan level × category-specific coefficient, ensembled across multiple channels). Past months are finalized values; the current and future months are current-snapshot estimates based on present sales conditions. Median error of 6.6% against publicly disclosed operating results. |
| Breakdown of N | Estimated settled ADR = Hokkaido / city hotels N=75 properties (January–July 2026, finalized), N=74–76 properties for the same period in 2025. Business hotels N=429–441 properties (January–July 2026, finalized), N=421–426 properties for the same period in 2025. Resort hotels, shown for reference, N=128–146 properties (January–July 2026) and N=127–141 properties (January–July 2025). Estimated OCC = Hokkaido / city, 68–74 properties observed; business, 368–394 properties observed. |
| Treatment of year-on-year change | Year-on-year comparison is made only between finalized values (actuals-confirmed basis). Figures from August 2026 onward are current-snapshot estimates based on present sales conditions; direct comparison against finalized values waits for month-end finalization. No year-on-year comparison is made for estimated OCC. |
| Data timestamp | Data as of: August 12, 2026. Because sales conditions and inventory change daily, the figures in this article are a snapshot at the time of retrieval. |
Related reading
- Hokkaido City Hotels: Only Aug 15 Trails at 78.7% OCC, 45 Days Out
- A 4.1 Review Score Is Average, Not a Strength: Sapporo Price Position
- Aichi Settled ADR 18 Months: City Swings 25.0pt, Business 14.0pt
- Ishikawa ADR H1 2026: City +3.6%, Business −1.3%, a 14.2pt Gap
- Shiga Settled ADR H1 2026: Business Hotels +4.8%, Resort Hotels −2.9%
- Kyoto Hotel ADR Falls YoY in June 2026: City -14.6%, Business -9.8%
- Chiba Settled ADR: H1 2026 Beats Last Year, July Turns -8.2%
- Japan Hotel ADR Polarization 2026: 57.6pt Prefecture×Category Gap