

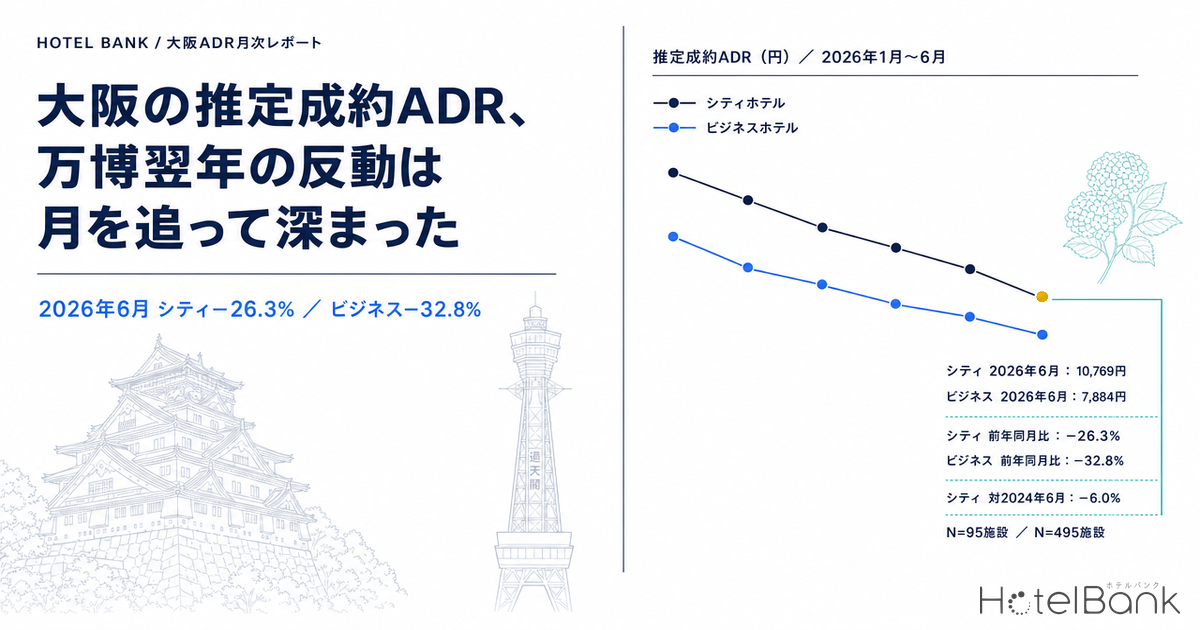
In June 2026, Osaka’s estimated settled ADR came to ¥10,769 for city hotels (N=95 properties), down 26.3% year on year, and ¥7,884 for business hotels (N=495 properties), down 32.8%. Both are comparisons between finalized figures. Yet in the same prefecture, January 2026 swung the other way for city hotels at +25.0%, so “Osaka rates are falling” is too broad a statement. The decline begins in the month that overlaps the Expo 2025 Osaka, Kansai, Japan (大阪・関西万博) run, which opened on April 13, 2025 — April at −18.1%, May at −16.6%, and June at −26.3% for city hotels — deepening month by month. This article breaks that rebound down month by month using the estimated settled ADR, sets it alongside the declines in neighboring prefectures and nationwide REIT portfolios, and works through how to reset the comparison baseline year and rate floors.
Scope: city hotels (June 2026, N=95 properties) and business hotels (same month, N=495 properties) in Osaka. Price figures in this article are the estimated settled ADR (the settled price level estimated from OTA and other sales data, pre-tax equivalent); occupancy is an estimate based on OTA-listed inventory. Both definitions appear at the end of this article. Data as of August 2, 2026.
- — June 2026 in Osaka: city hotels −26.3% YoY, business hotels −32.8% — estimated settled ADR of ¥10,769 for city hotels (N=95 properties) and ¥7,884 for business hotels (N=495 properties). Both are finalized-to-finalized comparisons.
- — The step down came in April — January through March ranged from +25.0% to −8.9%, but from April, when the Expo period enters the denominator, the figures dropped to −18.1% and −23.8% and kept deepening through May and June.
- — Reset the baseline to 2024 and April and May flip — against 2024, city hotels are +7.2% in both April and May, with only June negative at −6.0%. June is the only month that fell below the pre-Expo level.
- — Osaka’s decline is roughly double that of neighboring prefectures — in June 2026, city hotels were −14.6% in Kyoto, −12.4% in Hyogo and −12.8% in Tokyo, against −26.3% in Osaka. The gap is even wider for business hotels.
- — Volume held up; the troughs are by day of week — estimated OCC for June 10–30 averaged 87.7% for city hotels and 81.8% for business hotels. Business hotels ran 73.9% on Sundays against 88.4% on Saturdays, a 14.5-point spread.
Nothing showed through March; from April the decline deepened month by month
First, Osaka’s estimated settled ADR from January to June 2026, set against the finalized figures for the same months a year earlier. Everything here is a comparison between finalized figures for past months, with no mixing of current-point estimates.
| Stay month | City 2026 | City 2025 | YoY | Business 2026 | Business 2025 | YoY |
|---|---|---|---|---|---|---|
| January | ¥14,015 | ¥11,210 | +25.0% | ¥9,144 | ¥8,798 | +3.9% |
| February | ¥11,421 | ¥11,772 | −3.0% | ¥8,430 | ¥9,480 | −11.1% |
| March | ¥12,792 | ¥13,200 | −3.1% | ¥9,324 | ¥10,234 | −8.9% |
| April | ¥13,091 | ¥15,981 | −18.1% | ¥9,845 | ¥12,917 | −23.8% |
| May | ¥12,878 | ¥15,441 | −16.6% | ¥9,699 | ¥13,383 | −27.5% |
| June | ¥10,769 | ¥14,621 | −26.3% | ¥7,884 | ¥11,735 | −32.8% |
Observed properties: city hotels N=91–95 in 2026 / N=89–91 in 2025; business hotels N=495–499 in 2026 / N=500–503 in 2025. All figures are finalized.
Source: MetroEngines Research; compiled by the HotelBank Editorial Team
The shape is clear. From January to March, city hotels ran +25.0% → −3.0% → −3.1% and business hotels +3.9% → −11.1% → −8.9%, holding at roughly flat or single-digit declines. But as soon as April arrives — the month that overlaps the Expo run — city hotels drop to −18.1% and business hotels to −23.8%, and the gap widens further in May and June. Expo 2025 Osaka, Kansai, Japan ran for 184 days from April 13 to October 13, 2025, drawing a cumulative attendance of approximately 29.02 million (Source: EXPO 2025 Osaka, Kansai, Japan official website, “Expo 2025 in Data”). Only from April onward, when that run enters the YoY denominator, does the decline turn double-digit.
Plotting the years on top of one another makes the structure easier still to read. The chart places 2024 (grey), 2025 (pale blue) and 2026 (blue) on a common January-to-December axis.
Estimated settled ADR for Osaka city hotels (monthly). July–December 2026 are current-point estimates based on present sales conditions (dotted line) and may move. Observed properties: N=83–88 in 2024, N=89–91 in 2025, N=91–96 in 2026.
Source: MetroEngines Research; compiled by the HotelBank Editorial Team
City hotels jumped to ¥15,981 in April 2025 and peaked for the year at ¥17,291 in August. Seen from that August 2025 level, June 2026’s ¥10,769 sits 37.7% lower. Business hotels follow the same shape, with 2025 peaking at ¥13,450 in September.
Estimated settled ADR for Osaka business hotels (monthly). July–December 2026 are current-point estimates based on present sales conditions (dotted line) and may move. Observed properties: N=484–499 in 2024, N=487–503 in 2025, N=433–499 in 2026.
Source: MetroEngines Research; compiled by the HotelBank Editorial Team
From July 2026 onward the figures are current-point estimates based on present sales conditions and cannot be compared directly with finalized figures, so only the apparent level is described here. City hotels are estimated to rise from ¥11,726 in July to ¥15,124 in October, and business hotels from ¥8,460 in July to ¥11,546 in November — both trending upward into autumn. Note that the observed property count thins to N=433 for business hotels in December, so the further out the month, the more the estimate can move.
Compare against “pre-Expo” rather than “last year” and the floor moves
A YoY comparison means something different in months where a one-off major event sits in the denominator. The same months are set here against the finalized 2024 figures — the pre-Expo baseline.
| Segment and stay month | 2026 (finalized) | 2025 (finalized) | 2024 (finalized) | vs 2025 | vs 2024 |
|---|---|---|---|---|---|
| City, April | ¥13,091 | ¥15,981 | ¥12,216 | −18.1% | +7.2% |
| City, May | ¥12,878 | ¥15,441 | ¥12,018 | −16.6% | +7.2% |
| City, June | ¥10,769 | ¥14,621 | ¥11,460 | −26.3% | −6.0% |
| Business, April | ¥9,845 | ¥12,917 | ¥9,529 | −23.8% | +3.3% |
| Business, May | ¥9,699 | ¥13,383 | ¥9,108 | −27.5% | +6.5% |
| Business, June | ¥7,884 | ¥11,735 | ¥8,339 | −32.8% | −5.5% |
Observed properties: city hotels N=94–95 in 2026 / N=91 in 2025 / N=83–85 in 2024; business hotels N=495–499 in 2026 / N=502–503 in 2025 / N=492–494 in 2024. All comparisons are between finalized figures.
Source: MetroEngines Research; compiled by the HotelBank Editorial Team
Reset the baseline year to 2024 and the picture flips for April and May. City hotels are +7.2% against 2024 in both months, and business hotels +3.3% and +6.5% — above the pre-Expo level. In other words, the double-digit declines in those two months are the flip side of 2025 running unusually high; the level itself has not fallen below where it stood two years ago. Separating the premium that accrued during the Expo period from the underlying trend means decomposing each month into an event-driven component and a baseline component — which is exactly what holding two baseline years side by side sets up.
June is the exception. June alone came in below the pre-Expo level even against 2024, at −6.0% for city hotels and −5.5% for business hotels. It is the only month in the first half of 2026 to fall below the same month two years earlier, which makes it different in kind from April and May. The YoY figures (−26.3% and −32.8%) are largest in June, but on a two-year baseline April and May are still in positive territory and June is the first month to cross into negative — reading them in that order stays closer to what actually happened.
One piece of context: new openings in Osaka have continued at 51 properties and 6,524 rooms in 2024, 54 properties and 5,501 rooms in 2025, and 32 properties and 2,521 rooms in 2026 (2026 includes scheduled openings), for a three-year total of 137 properties and 14,546 rooms. When rooms are being added just as a demand event falls away, YoY alone becomes a poor gauge of how far rates have recovered.
The property and room counts above are compiled on an OTA-listing-confirmed basis. Only around 19% of properties are listed on OTAs before opening, and more than half are listed after opening, so counts for recent years such as 2026 may rise as further listings appear. Please read them as a lower bound as of now (Source: MetroEngines Research, OTA-listing-confirmed basis).
Is the decline specific to Osaka? Setting it against neighboring prefectures and national portfolios
Osaka was not the only market where rates fell in June 2026. Kyoto, Hyogo and Tokyo are shown here for the same finalized month on the same estimated settled ADR basis.
| Prefecture and segment | June 2026 | June 2025 | YoY | N (June 2026) |
|---|---|---|---|---|
| Osaka, city | ¥10,769 | ¥14,621 | −26.3% | 95 properties |
| Osaka, business | ¥7,884 | ¥11,735 | −32.8% | 495 properties |
| Kyoto, city | ¥17,738 | ¥20,768 | −14.6% | 57 properties |
| Kyoto, business | ¥9,616 | ¥10,659 | −9.8% | 324 properties |
| Hyogo, city | ¥11,473 | ¥13,098 | −12.4% | 47 properties |
| Hyogo, business | ¥7,260 | ¥7,290 | −0.4% | 166 properties |
| Tokyo, city | ¥22,195 | ¥25,441 | −12.8% | 108 properties |
| Tokyo, business | ¥11,890 | ¥12,474 | −4.7% | 915 properties |
Observed properties in June 2025: Osaka city N=91, business N=502; Kyoto city N=58, business N=319; Hyogo city N=47, business N=167; Tokyo city N=106, business N=910. All comparisons are between finalized figures.
Source: MetroEngines Research; compiled by the HotelBank Editorial Team
All four prefectures were below the prior year in June 2026, but the magnitudes differ sharply. City hotels cluster in a roughly −12% to −15% band — Kyoto −14.6%, Hyogo −12.4%, Tokyo −12.8% — while Osaka alone sits at −26.3%, about twice as deep. The gap is wider still for business hotels: Hyogo −0.4%, Tokyo −4.7% and Kyoto −9.8% against Osaka’s −32.8%. That difference is where the nationwide softening ends and the Osaka-specific rebound begins. For how Kyoto’s −14.6% and −9.8% took shape month by month, Kyoto Hotel ADR Falls YoY in June 2026: City −14.6%, Business −9.8% breaks it down using the same metric.
It is also worth setting the listed hotel REITs’ published results alongside these figures. For monthly operating results in June 2026, Invincible Investment Corporation (8963) reported 82.7% occupancy, ADR of ¥12,412 and RevPAR of ¥10,264 across 101 domestic hotels, with ADR down 3.9% year on year (monthly operating status dated July 24, 2026). Japan Hotel REIT Investment Corporation (8985) reported 81.2% occupancy, ADR of ¥18,509 and RevPAR of ¥15,023 across 29 hotels under variable-rent and similar structures, with ADR up 1.6% year on year (the corporation’s IR disclosures). Ichigo Hotel REIT Investment Corporation (3463) reported 80.6% occupancy for its full portfolio in June 2026, ADR of ¥8,872 and RevPAR of ¥7,147, with ADR down 5.9% year on year (monthly operating status dated July 27, 2026). These are published results for nationwide portfolios, and because their sample, aggregation definitions and tax treatment differ from the estimated settled ADR used here, the levels are not compared directly. Still, with national operating results running roughly in a −6% to +2% YoY range, they give a sense of just how far outside that range Osaka’s −26.3% and −32.8% sit. Estimates serve to capture market-wide movement early and broadly; published results show the finalized outcome for individual portfolios. The two are complements, not substitutes.
Estimated OCC in June 2026 held high — the troughs fall on Sunday and Monday
In a month when rates moved this much, what happened on the volume side? The chart below shows estimated OCC (on an OTA-listed-inventory basis) for Osaka in June 2026 by day of week. The window is the 21 days from Wednesday, June 10 to Tuesday, June 30 — three full weeks, giving three observations of each weekday — where observation is stable.
Estimated OCC by day of week (OTA-listed-inventory basis) for Osaka, June 10–30, 2026. Observed properties: city hotels N=89–92, business hotels N=445–450. Period averages: 87.7% for city hotels, 81.8% for business hotels.
Source: MetroEngines Research; compiled by the HotelBank Editorial Team
For city hotels the highs are Saturday at 92.1%, Friday at 90.4% and Thursday at 89.1%, with the lows on Monday at 84.7% and Sunday at 85.2%. The spread is 7.4 points, so the within-week shape is relatively gentle. Business hotels run 88.4% on Saturday against 73.9% on Sunday and 76.3% on Monday, a spread of 14.5 points — close to double that of city hotels. The weekend peak and the start-of-week trough are far more pronounced for business hotels.
Both averaged high over the period, at 87.7% for city hotels and 81.8% for business hotels. In a month when rates fell sharply from the prior year, the take-up of listed inventory was by no means weak. Note that this article does not read estimated OCC against the prior year. What can be compared on a finalized-to-finalized basis is the rate side, and that is where the −26.3% and −32.8% figures come from.
For revenue managers running city and business hotels in Osaka — implications and an action plan
(1) The YoY yardstick behaves differently from April onward. Osaka’s YoY figures stayed within a +25.0% to −8.9% range from January to March 2026, then stepped down to −18.1% and −23.8% from April. That step is best read not as a change in your own property’s selling power but as a reflection of one-off demand sitting in the denominator. Monthly reviews through October 2026 need a framing that does not treat the YoY figure as a shortfall at face value.
(2) Reset the baseline year to 2024 and the verdict splits between April–May and June. City hotels are +7.2% against 2024 in both April and May — above the pre-Expo level — yet sink to −6.0% in June alone. Business hotels likewise run +3.3% in April and +6.5% in May against −5.5% in June. If your own results set against the same months of 2024 are positive in April and May and negative in June, you are moving with the market. If every month is negative, there is room to look beyond market factors.
(3) Osaka’s decline is about twice that of neighboring prefectures, and the gap between segments is wide. City hotels: Kyoto −14.6%, Hyogo −12.4% and Tokyo −12.8% against Osaka’s −26.3%. Business hotels: Hyogo −0.4% and Tokyo −4.7% against Osaka’s −32.8%. If you operate across multiple areas, judging Osaka’s numbers on a single company-wide yardstick invites misreading. There is a case for separating benchmarks by area and by segment.
(4) Volume held high, and the troughs sit on particular days of the week. Estimated OCC for June 10–30 averaged 87.7% for city hotels and 81.8% for business hotels. For business hotels the troughs are Sunday at 73.9% and Monday at 76.3%, 14.5 points below Saturday’s 88.4%. Rather than setting a single flat floor, consider designing the lower bound differently for trough days and peak days. Cutting the floor uniformly across all days in a soft-rate period tends to leave money on the table on the peak days.
The measures that follow from this, organized by time horizon:
| Horizon | Measure | Trigger | Objective |
|---|---|---|---|
| Today to this week | Add a 2024 same-month column to the monthly report | If April–October 2026 is being viewed on YoY alone. In the market, city hotels are +7.2% against 2024 in April and May but −6.0% in June — the signs diverge | Give months overlapping the Expo run a second evaluation axis |
| Today to this week | Set your own June results against the market level | If your June ADR sits far from the market’s estimated settled ADR (¥10,769 for city hotels, ¥7,884 for business hotels) | Identify whether you have cut too far or held too firm |
| Within two weeks | Reset rate floors by day of week | If, in the business segment, the same floor is applied to Sunday at 73.9% and Monday at 76.3% as to Saturday at 88.4% | Reduce both trough-day misses and peak-day discounting at once |
| Within two weeks | Separate evaluation benchmarks by area | If, across a multi-area portfolio, Osaka city at −26.3% is placed on the same benchmark as Tokyo at −12.8% and Kyoto at −14.6% | Separate the Osaka-specific rebound from the nationwide softening |
| Looking to next month | Bring the autumn rate-revision calendar forward | Current-point market estimates trend upward, from ¥11,726 in July to ¥15,124 in October for city hotels and from ¥8,460 in July to ¥11,546 in November for business hotels. If your own settings remain at July levels | Preserve headroom to raise rates into the autumn demand period |
| Looking to next month | Decide the baseline series for the 2027 budget in advance | If April–October 2026 will be used as prior-year actuals as-is. That period carries the 2025 Expo run in the denominator, which tends to overstate the following year’s growth rate | Avoid distorting the starting point of the budget |
Source: MetroEngines Research; compiled by the HotelBank Editorial Team
In summary — three yardsticks
First, look at where the step is. Osaka’s YoY figures run from +25.0% to −8.9% in January–March and from −18.1% to −32.8% from April onward — a clear step in April. Whether that step lines up with the start of the Expo run on April 13, 2025 is what decides whether the decline should be read as a demand event falling away.
Second, hold two baseline years. Against 2025, city hotels sink uniformly — April −18.1%, May −16.6%, June −26.3% — but against 2024 the signs diverge: April +7.2%, May +7.2%, June −6.0%. Keeping in mind that June is the first month to go negative on a two-year baseline lets you vary the strength of your response month by month.
Third, read price and volume on separate axes. Estimated OCC in June averaged a high 87.7% for city hotels and 81.8% for business hotels, while the rate side — where finalized-to-finalized comparison is possible — shows −26.3% and −32.8%. What the volume axis reveals is the day-of-week shape (the 14.5-point gap between business hotels’ 73.9% on Sunday and 88.4% on Saturday), and floor design is easier to tie to that.
About the data
- Definition of estimated OCC (OTA-listed-inventory basis): OTA-listed-inventory occupancy = 100 − 100 × OTA-listed remaining rooms ÷ total rooms. It is an estimate based on the take-up of inventory sold on OTAs and differs in definition from actual room occupancy (it runs higher). The scope in this article is the 21 days from June 10 to June 30, 2026 in Osaka.
- Booking curve: based on observations from 45 days before the stay date up to the most recent reading.
- Definition of estimated settled ADR: the settled price level (pre-tax equivalent) estimated from OTA and other sales data (lowest-plan level × segment-specific coefficients, ensembled across multiple channels). Past months are finalized figures; the current and future months are estimates based on present sales conditions. Median error of 6.6% when reconciled against published operating results.
- Breakdown of N: Osaka city hotels, June 2026 N=95, June 2025 N=91, June 2024 N=85; Osaka business hotels, June 2026 N=495, June 2025 N=502, June 2024 N=494. For the comparison markets as of June 2026: Kyoto city N=57 / business N=324; Hyogo city N=47 / business N=166; Tokyo city N=108 / business N=915. Observed properties for estimated OCC: city hotels N=89–92, business hotels N=445–450.
- Published REIT results: monthly operating results disclosed by each investment corporation are quoted without rounding. Because their sample and aggregation definitions differ from the estimated settled ADR, levels are not compared directly.
- Data as of: August 2, 2026. Sales conditions and inventory change daily, so the figures in this article are a snapshot at the time of retrieval.
References and sources
■ Data sources
The estimated settled ADR and listed property counts (N) come from monthly area aggregations of the OTA public price and inventory data collected by MetroEngines Research (Osaka, Kyoto, Hyogo and Tokyo; city hotels and business hotels; January 2024 to December 2026). Estimated OCC by day of week comes from daily inventory observations within the same collected data (Osaka, by segment, June 10–30, 2026). Monthly operating results for listed hotel REITs are taken from each investment corporation’s published materials, and the Expo run and attendance figures from the EXPO 2025 Osaka, Kansai, Japan official website. Data retrieved as of August 2, 2026.
■ Calculation assumptions
Both the YoY and versus-2024 comparisons are calculated solely between finalized months (past months). Estimates from July 2026 onward are described only in terms of apparent level and are not used in ratio calculations against finalized figures. Estimated OCC is not matched against the prior year; only the day-of-week shape within the month is discussed. The comparison with published REIT results is limited to the direction of YoY change and is not a direct comparison of levels. New-opening property and room counts are lower bounds on an OTA-listing-confirmed basis and may rise with future listings.
■ Limitations and caveats
The estimated settled ADR has a median error of 6.6% when reconciled against published operating results. The listed property count N varies by month (Osaka city hotels N=91 in June 2025 → N=95 in June 2026; business hotels N=502 → N=495), so turnover in the sample is embedded in the YoY figures. Estimated OCC is an estimate based on the take-up of OTA-listed inventory and differs in definition from actual room occupancy, running higher. Estimates from July 2026 onward move more readily in months with thinner observation, and business hotels thin to N=433 in December. Published REIT results cover nationwide portfolios, and their sample, aggregation definitions and tax treatment differ from the estimated settled ADR. Inventory and pricing change daily, so all figures in this article are a snapshot at the time of retrieval.
■ External sources and references
- EXPO 2025 Osaka, Kansai, Japan official website, “Expo 2025 in Data” (run of 184 days, April 13 to October 13, 2025; cumulative attendance of approximately 29.02 million)
- EXPO 2025 Osaka, Kansai, Japan official website, “Overview”
- Invincible Investment Corporation, monthly operating status dated July 24, 2026 (PDF)
- Ichigo Hotel REIT Investment Corporation, monthly operating status dated July 27, 2026 (PDF)
- Japan Hotel REIT Investment Corporation, official website (IR materials)