

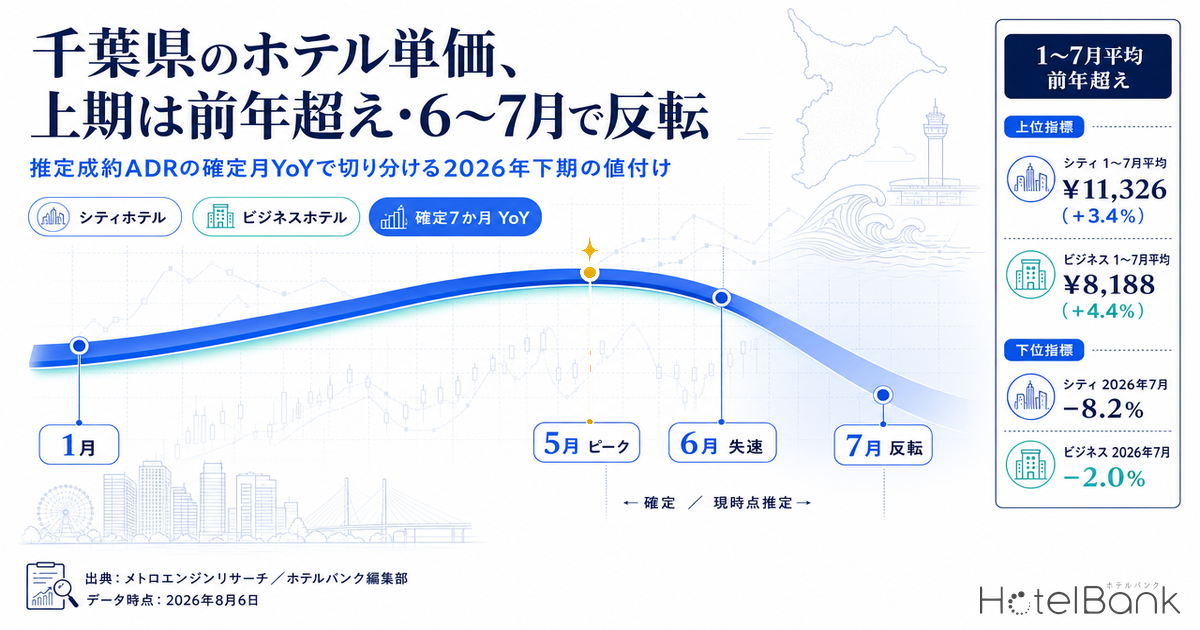
Chiba’s hotel market moved in two distinct phases in 2026, and the finalized figures now show both: the first half came in above last year, and June onward reversed. On an estimated settled ADR basis (tax-exclusive equivalent), using finalized months only, city hotels averaged ¥11,326 over January–July 2026 (versus ¥10,957 in the same period of 2025), up 3.4% year on year, while business hotels averaged ¥8,188 (versus ¥7,843), up 4.4%. Both beat the prior year. Yet in July 2026 — the most recent finalized month — city hotels came in at ¥10,105, down 8.2% YoY, and business hotels at ¥7,739, down 2.0%. Both turned negative together. This article separates the first-half gain and the recent stall into two different stories — “last year was high” versus “this year isn’t growing” — by placing each month alongside its 2025 counterpart.
Scope: city hotels in Chiba (N=51–53 properties) and business hotels in Chiba (N=160–165 properties). The price metric in this article is estimated settled ADR (a settled-price level estimated from OTA and other sales data, tax-exclusive equivalent); occupancy is an estimate based on OTA-listed inventory. Full definitions appear at the end of the article. Data as of August 6, 2026.
- — Finalized figures for January–July 2026 beat the prior year across the first half — Chiba city hotels averaged ¥11,326 (+3.4% YoY) and business hotels ¥8,188 (+4.4% YoY).
- — The gain vanished in June, and July turned negative for both categories — city ¥10,105 (−8.2%) and business ¥7,739 (−2.0%) reversed in the latest finalized month.
- — July’s shortfall cannot be explained as a base effect — July 2025 sat at a within-year index of 100.5, right at average, while July 2026 sank to 89.2. That puts pricing itself on the inspection list.
- — April’s −7.1%, by contrast, is a textbook base effect — April 2025 was a standout peak at a within-year index of 116.2. Same sign, different mechanism.
- — Demand shape is polarizing by category — in July 2026, estimated OCC spanned 17.5 points from Monday to Saturday for city hotels and 12.0 points for business hotels. That is a basis for designing floor prices differently.
Seven finalized months of YoY — January to May above last year, June stalls, July reverses
All finalized months through July 2026 are now in. Estimated settled ADR for Chiba’s city hotels (N=51–53 properties) started at ¥12,020 in January (+19.6% YoY), then ran above the prior year at ¥11,334 in February (+3.2%) and ¥11,786 in March (+7.8%). April dipped below last year once at ¥11,822 (−7.1%), but May reached ¥12,264 (+10.9%) — the highest of any finalized month in 2026. Up to that point, this was a year that sold at higher prices than the last.
The trend changes in June. City hotels came in at ¥9,952, essentially flat at +0.3% YoY, and July followed at ¥10,105, clearly below the prior year at −8.2%. Business hotels (N=160–165 properties) traced the same shape: every month from January (¥8,374, +12.3%) through May (¥8,754, +8.3%) stayed positive, then June (¥7,878, +0.1%) erased the gain and July (¥7,739, −2.0%) went negative. This June pivot, with both categories dropping below the prior year together, is not unique to Chiba — our breakdown of Kyoto on the same finalized-month basis, Kyoto Hotel ADR Falls YoY in June 2026, treats the same month as the turning point.
Monthly estimated settled ADR for city hotels in Chiba. August–December 2026 are current-snapshot estimates based on inventory now on sale. Source: MetroEngines Research; compiled by the HotelBank Editorial Team
The other thing worth noting is how wide the January–May swings were. For city hotels, January–May 2025 ranged from ¥10,054 to ¥12,731 (a ¥2,677 spread), whereas 2026 stayed within ¥11,334 to ¥12,264 (a ¥930 spread). Against a prior year that swung sharply month to month, the first half of 2026 formed a plateau in a narrow band from the ¥11,300s to the ¥12,200s. For business hotels, the January–May spread was ¥629 in 2025 and ¥586 in 2026 — almost identical — so the shape of the range held while the level alone rose by roughly ¥500. The question of how much the YoY swing differs between categories shows up in the same form in Aichi Settled ADR 18 Months, which tested it across 18 finalized months.
To check whether this deceleration is specific to Chiba, it helps to place Tokyo alongside it on the same finalized-month basis. Tokyo city hotels were down 12.8% YoY in June 2026 and down 17.1% in July; Tokyo business hotels were down 4.7% in June and down 5.3% in July. The declines are larger than Chiba’s. On a January–July average, Tokyo city hotels came in at −2.2% and business hotels at +1.3%, both below Chiba’s +3.4% and +4.4%. In other words, the June–July drop below the prior year is not something that happened only in Chiba — and within that pattern, Chiba is on the side that is holding up relatively well. For what sits behind Tokyo business hotels turning to −4.7% in June 2026, Tokyo Business Hotel ADR 12-Month Trend tracks it split between the five central wards and the 18 outer wards.
| Finalized month | Chiba city | YoY | Chiba business | YoY | Ref. Tokyo city | Ref. Tokyo business |
|---|---|---|---|---|---|---|
| January 2026 | ¥12,020 | +19.6% | ¥8,374 | +12.3% | +8.3% | +5.1% |
| February 2026 | ¥11,334 | +3.2% | ¥8,168 | +5.2% | +4.0% | +0.4% |
| March 2026 | ¥11,786 | +7.8% | ¥8,181 | +4.4% | +5.8% | +2.9% |
| April 2026 | ¥11,822 | -7.1% | ¥8,223 | +2.9% | +0.5% | +3.9% |
| May 2026 | ¥12,264 | +10.9% | ¥8,754 | +8.3% | -3.8% | +5.7% |
| June 2026 | ¥9,952 | +0.3% | ¥7,878 | +0.1% | -12.8% | -4.7% |
| July 2026 | ¥10,105 | -8.2% | ¥7,739 | -2.0% | -17.1% | -5.3% |
| Jan–Jul average | ¥11,326 | +3.4% | ¥8,188 | +4.4% | -2.2% | +1.3% |
Estimated settled ADR (tax-exclusive equivalent); YoY calculated between finalized figures (history) only. Chiba city N=51–53 properties, Chiba business N=160–165 properties, Tokyo city N=105–108 properties, Tokyo business N=902–924 properties. Source: MetroEngines Research; compiled by the HotelBank Editorial Team
Base effect or genuine weakness — separating them by within-year position
A year-on-year figure changes when either the numerator (this year) or the denominator (last year) moves. Read “+19.6%” or “−8.2%” straight as a measure of demand strength and you will misjudge it. So we convert each year into an index with that year’s January–July average set to 100, and look at where each month sat within its own year. If the prior year was a within-year trough, a high YoY comes easily; if it was a within-year peak, a low YoY comes easily.
Monthly estimated settled ADR for business hotels in Chiba. August–December 2026 are current-snapshot estimates based on inventory now on sale. Source: MetroEngines Research; compiled by the HotelBank Editorial Team
With that substitution, four distinct situations emerge for Chiba’s city hotels. Start with January’s +19.6%. January 2025 sat at a within-year index of 91.8 — a trough for that year — while January 2026 sat at 106.1, high within its own year. So the figure is a composite of a “filled-in trough from last year” effect and a “strong January this year” effect; neither alone explains it. Next, April’s −7.1%. April 2025 indexed at 116.2, a standout peak among the seven months. April 2026, at 104.4, still ranked high within its own year, so the level itself is not weak. This is the textbook “last year was high” base effect.
July is the problem. July 2025 indexed at 100.5 — an entirely ordinary month, right at the within-year average. July 2026, however, came in at 89.2, the second-lowest of the year after June (87.9). Because there was no peak on the base-year side and this year still moved down, July’s −8.2% cannot be explained as a base effect. The straightforward reading is that July simply did not grow this year. As for June, both years sat in their within-year troughs — 90.6 in 2025 and 87.9 in 2026. A flat YoY of +0.3% indicates less “held the prior-year level” than “both years fall the same way in this month, and pricing has not moved.”
Business hotels have a different shape. The 2025 within-year index stayed inside a range of 8.1 points, from 95.0 to 103.1 — an almost flat year. In 2026, by contrast, the range widened to 12.4 points, from 94.5 to 106.9. May formed a peak at an index of 106.9 (YoY +8.3%) and July formed a trough at 94.5 (YoY −2.0%). January’s +12.3% is a trough-filling figure driven by January 2025 sitting at an index of 95.0, while May’s +8.3% was pushed up by a peak on this year’s side. Same positive sign, different mechanism.
| Month | City, 2025 index | City, 2026 index | Business, 2025 index | Business, 2026 index | How to read the city figure |
|---|---|---|---|---|---|
| January | 91.8 | 106.1 | 95.0 | 102.3 | Prior-year trough filled in, plus a peak this year |
| February | 100.2 | 100.1 | 99.0 | 99.8 | Both years at the within-year average |
| March | 99.8 | 104.1 | 99.9 | 99.9 | Pushed up from this year’s side |
| April | 116.2 | 104.4 | 101.9 | 100.4 | Prior year was a standout peak = base effect |
| May | 101.0 | 108.3 | 103.1 | 106.9 | Pushed up by this year’s peak |
| June | 90.6 | 87.9 | 100.4 | 96.2 | A within-year trough in both years |
| July | 100.5 | 89.2 | 100.7 | 94.5 | Prior year at average = weakness on this year’s side |
Index with each year’s January–July average estimated settled ADR set to 100. Finalized figures (history) only. Chiba city N=51–53 properties, Chiba business N=160–165 properties. Source: MetroEngines Research; compiled by the HotelBank Editorial Team
Looking ahead to second-half pricing, the shape of the 2025 finalized figures for the second half is also worth holding on to. City hotels ran ¥11,824 in August, ¥11,017 in September, ¥11,277 in October, ¥12,299 in November and ¥11,430 in December — September and October formed the trough, November was the second-half high (the 2025 within-year high was April’s ¥12,731). Business hotels ran ¥8,186 in August, ¥7,944 in September, ¥7,749 in October, ¥8,116 in November and ¥7,815 in December — October was the trough, with August and November running high. For August–December 2026, current-snapshot estimates are ¥11,003–¥12,939 for city hotels (N=50–53 properties) and ¥10,120–¥11,220 for business hotels (N=138–159 properties). These reflect the composition of inventory currently on sale, so any straight comparison with finalized figures has to wait until each month closes.
Demand shape polarizes by day of week — estimated OCC in July 2026
We keep the day-of-week lens out of the price discussion, but the shape of demand itself differs sharply by day. Averaging Chiba’s estimated OCC (based on OTA-listed inventory) for July 2026 (actuals for the elapsed month) by day of week, city hotels span 17.5 points, from 76.0% on Monday to 93.5% on Saturday (month average 84.3%, 51–53 properties observed). Business hotels span 12.0 points, from 81.0% on Monday to 93.0% on Saturday, with a shallower weekday dip (month average 85.9%, 135–142 properties observed).
Estimated OCC by day of week (based on OTA-listed inventory), Chiba, July 2026. Source: MetroEngines Research; compiled by the HotelBank Editorial Team
Saturday and Friday run nearly level between the two categories — 93.5% and 87.6% for city hotels, 93.0% and 87.2% for business hotels. The gap opens at the front of the week. City hotels fall to 78.9% on Tuesday and 76.0% on Monday, while business hotels hold at 84.5% and 81.0%. Looking at individual days within the prefecture, the city-hotel high was 97.5% on Saturday, July 11, 2026 and the low 74.8% on Monday, July 20. For business hotels, the high was 96.7% on Saturday, July 18 and the low 77.8% on Sunday, July 5. Within the same prefecture, city hotels concentrate revenue in the weekend peak while business hotels fill through the week. That difference in demand shape is not unrelated to the fact that first-half pricing traced different shapes by category.
For revenue managers running city and business hotels in Chiba — implications and an action plan
1. Break down what the first-half “win” was actually made of. Chiba city hotels finished the January–July finalized months at +3.4% YoY and business hotels at +4.4%, both above the prior year. But January’s +19.6% (city) and +12.3% (business) were also supported by January 2025 sitting at within-year indices of 91.8 and 95.0 — troughs. When you review your own first-half results, lining up “where that month sat within your own year” rather than the size of the YoY figure makes next year’s targets harder to get wrong.
2. July’s decline may not be a base effect. July 2025 was average, at a within-year index of 100.5, while July 2026 came in at 89.2. This year moved down where the base year had no peak. If your own July fell below the prior year, don’t file it under “last year was too good” — put July’s pricing itself on the inspection list.
3. Plan on the assumption that June is a trough in both years. The city-hotel June index was 90.6 in 2025 and 87.9 in 2026 — a within-year trough in both. A flat YoY of +0.3% is also evidence that nothing moved. If you have set June as the month to claw back the annual budget, that premise is worth revisiting.
4. With demand shapes differing by category, floor-price design should differ too. Estimated OCC in July 2026 ran from 76.0% on Monday to 93.5% on Saturday for city hotels (a 17.5-point gap) and from 81.0% to 93.0% for business hotels (12.0 points). City hotels tend to carry vacancy into the front of the week; business hotels are the flatter type. Even within Chiba, the answer to how much latitude to allow on weekdays splits by category.
5. The June–July decline is not a Chiba-specific story. On the same finalized-month basis, Tokyo city hotels were down 12.8% in June and 17.1% in July, and business hotels down 4.7% and 5.3% — larger drops than Chiba’s. Relative to neighboring markets, Chiba is on the side that is holding up. Before concluding that your own shortfall is a property-specific problem, check the shape of the market first.
| Time horizon | Action | Decision trigger (figures from this article) | Purpose |
|---|---|---|---|
| Today to this week | Line up your own seven finalized months against the market’s finalized months | The market averaged ¥11,326 (city) and ¥8,188 (business) over January–July. Check which side of that range your own same-period average falls on | Fix your first-half position on finalized figures before building the second half |
| Today to this week | Sort July’s shortfall into base effect or not | The market’s city-hotel July indexed at 89.2 (prior year 100.5), a shape a base effect cannot explain. If your own July has the same shape, inspect the pricing side | Avoid overreacting in the second half by misreading the cause |
| Within two weeks | Lock in the timing of September–October price revisions ahead of schedule | In the 2025 finalized figures, city hotels troughed at ¥11,017 in September and ¥11,277 in October, and business hotels hit a second-half low of ¥7,749 in October. If your property shares that trough shape, set the revision before the trough begins | Avoid chasing prices down once you are already inside the trough |
| Within two weeks | Rebuild November on the same design thinking as May in the first half | The market’s city-hotel November came in at ¥12,299 in the 2025 finalized figures, the second-half high. Consider whether the price band that produced ¥12,264 in May 2026 (index 108.3) can be reproduced in November | Leave upside room in the second half’s strongest pricing month |
| Looking to next month | Split day-of-week floor-price ranges by category | In July 2026 estimated OCC, city hotels ran 76.0–78.9% on Monday and Tuesday, business hotels 81.0–84.5%. Change the design depending on whether your property carries city-type vacancy early in the week | Fill weekdays without breaking the weekend peak |
| Looking to next month | Switch to reviewing the floor on lowest-priced OTA plans monthly | Check whether your setting for the month in question is stuck below the market’s finalized-month estimated settled ADR (city ¥9,952–¥12,264, business ¥7,739–¥8,754) | Prevent a trough-month floor from becoming the annual reference level |
Source: MetroEngines Research; compiled by the HotelBank Editorial Team
Summary — three yardsticks
Judged on finalized figures, the first half of 2026 was a year in which Chiba beat the prior year. City hotels averaged ¥11,326 over January–July, up 3.4%, and business hotels ¥8,188, up 4.4%. But the composition was not uniform: the gain disappeared in June, and July saw both categories fall below the prior year. There are three yardsticks to take away.
First, always read a year-on-year figure together with the prior year’s within-year position. The city hotels’ +19.6% in January includes the filling-in of a 91.8 index trough, while April’s −7.1% was the pullback from a 116.2 index peak. Same sign, different meaning. Second, when the base year was at average but this year moved down, inspect your own pricing without waiting for a market-side explanation. July 2026 for city hotels (index 89.2 versus 100.5 the prior year) is exactly that shape. Third, keep the seasonal shape of price and the day-of-week shape of demand as separate instruments. Use monthly finalized figures to pin down the within-year peaks and troughs in price, and estimated OCC to pin down how deep the vacancy runs early in the week. In Chiba, the Monday-to-Saturday gap was 17.5 points for city hotels and 12.0 points for business hotels — split by category.
In the second half, the 2025 finalized figures gave city hotels a peak of ¥12,299 in November and a trough of ¥11,017 in September, and business hotels a peak of ¥8,186 in August and a trough of ¥7,749 in October. There is no guarantee that shape repeats, but it does give you a starting point for discussing where to put the price-revision calendar.
About the data
| Item | Detail |
|---|---|
| Definition of estimated OCC | Occupancy based on OTA-listed inventory = 100 − 100 × rooms still listed on OTAs ÷ total rooms. It is an estimate based on how listed inventory is being taken up on OTAs, and is defined differently from actual room occupancy (it reads high). The target month in this article is July 2026 (actuals for the elapsed month). |
| Booking curve | Based on observations from 90 days before the stay date up to the present (the estimated OCC in this article uses the most recent observation for each stay date). |
| Definition of estimated settled ADR | A settled-price level (tax-exclusive equivalent) estimated from OTA and other sales data (lowest-plan level × category-specific coefficients, ensembled across multiple channels). Past months are finalized figures; the current and future months are current-snapshot estimates based on inventory now on sale. Cross-checked against published operating results, the median error is 6.6%. Year-on-year figures are calculated between finalized figures only. |
| Property counts | Estimated settled ADR: Chiba city hotels N=51–53 properties, Chiba business hotels N=160–165 properties (for the current-snapshot estimates for August–December 2026, city N=50–53 properties and business N=138–159 properties). For reference, Tokyo is city N=105–108 properties and business N=902–924 properties. Estimated OCC (July 2026): Chiba city 51–53 properties observed, Chiba business 135–142 properties observed. |
| Data date | Data as of August 6, 2026. Sales conditions and inventory change daily, so the figures in this article are a snapshot at the time of retrieval. |
Source: MetroEngines Research; compiled by the HotelBank Editorial Team
■ Data source
Proprietary aggregation (MetroEngines Research) of publicly listed OTA prices and inventory, collected daily at the property level and rolled up monthly. For Chiba and, for reference, Tokyo, we used estimated settled ADR (tax-exclusive equivalent) and estimated OCC split between city hotels and business hotels. The scope is the finalized months from January 2025 to July 2026; August–December 2026 is handled separately as current-snapshot estimates based on inventory now on sale. Data as of August 6, 2026.
■ Calculation assumptions
Year-on-year figures are calculated between finalized figures (history) only; no comparison mixes them with current-snapshot estimates. The within-year index sets each year’s January–July average estimated settled ADR to 100 and indexes each month’s level against it, for the purpose of separating out the prior year’s within-year position. The January–July average is a simple average of each month’s estimated settled ADR, with no weighting by property count or number of days. The day-of-week estimated OCC is a simple average of daily values for July 2026 grouped by day of week.
■ Limitations and caveats
Estimated settled ADR carries a median error of 6.6% when cross-checked against published operating results, and does not match the actual settled rate of any individual property. Estimated OCC is an OTA-listed-inventory metric and therefore reads higher than actual room occupancy. The number of properties in scope varies by month (Chiba city N=51–53 properties, Chiba business N=160–165 properties), so differences in monthly levels may include the effect of turnover in the underlying population. The August–December 2026 estimates reflect the composition of inventory currently on sale and cannot be compared directly with finalized figures.
Related reading
- Aichi Settled ADR 18 Months: City Swings 25.0pt, Business 14.0pt
- Fukuoka Settled ADR +10.9% in H1 2026 While Osaka Falls 32.8% in June
- Kyoto Hotel ADR Falls YoY in June 2026: City -14.6%, Business -9.8%
- Tokyo Business Hotel ADR 12-Month Trend: 30% Central vs Outer Ward Gap
- Japan Hotel ADR Polarization 2026: 57.6pt Prefecture×Category Gap