

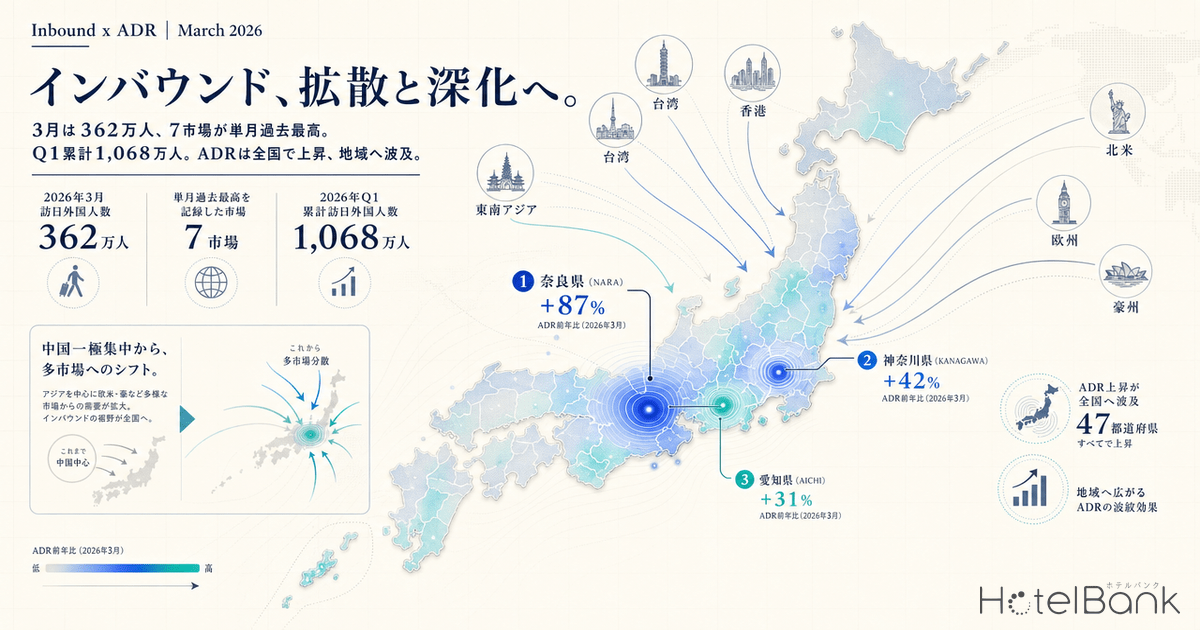
In March 2026, inbound visitors to Japan reached 3.619 million, a new all-time high for the month. Seven markets including the United States and Vietnam set single-month records, while 13 markets including South Korea, Taiwan, and Malaysia simultaneously achieved March highs. Cumulative arrivals for the first three months of the year totaled 10.68 million — the second consecutive year exceeding 10 million in Q1. But how much price pressure has this “volume expansion” actually delivered to the lodging market? Using public price data from MetroEngines Research covering 28,765 properties across all 47 prefectures of Japan, this article quantitatively examines the transmission path from inbound demand to ADR and the reality of regional dispersion.
Metric Definitions Used in This Article: ADR (Average Daily Rate) is the average of public sales prices listed by surveyed properties; it differs from actual transaction prices. Sell-out rate is the share of plans that had stopped accepting reservations at the time of survey, which differs from a property’s overall room occupancy. Prices are per-room rates (tax included) for double-occupancy stays.
JNTO Statistics for March 2026: Why Seven Markets Set Single-Month Records
According to estimates released by the Japan National Tourism Organization (JNTO) on April 15, 2026, inbound arrivals in March 2026 reached 3,618,900 (+3.5% year-over-year), an all-time high for the month. What stands out is the lineup of markets driving the growth. The seven markets setting single-month records — Indonesia, Vietnam (+43.5%), the United States (+9.7%), Canada, the United Kingdom (+20.7%), Germany, and the Nordic region — are concentrated in Southeast Asia and the Western markets (Europe, North America, and Oceania).
By contrast, arrivals from China dropped sharply to 292,000 (-55.9% YoY), continuing a steep decline. In other words, March 2026 marks an accelerating structural shift in inbound growth from a “China-concentrated” model to a “multi-market dispersed” model. South Korea (796,000, +15%) and Taiwan (653,000, +24.9%) continue to anchor the volume zones, while emerging markets such as Vietnam (92,000) and Malaysia (77,000, +44.2%) post rapid gains.
The cherry blossom season, combined with school holidays aligned with the April Easter break, is believed to have lifted demand from Western markets. Cumulative arrivals for the first three months of the year reached 10.684 million (+1.4% YoY), exceeding 10 million in Q1 for the second consecutive year (Source: JNTO Inbound Visitor Estimates for March 2026). For a deeper look at how this nationality shift affects lodging rate sensitivity, see also March 2026: 3.62M Inbound Visitors and 10M Cumulative — Reading the Nationality Shift and Hotel Rate Sensitivity.
| Market | Arrivals | YoY | Record |
|---|---|---|---|
| South Korea | 795,600 | +15.0% | March High |
| Taiwan | 653,300 | +24.9% | March High |
| United States | 375,900 | +9.7% | All-Time High |
| China | 291,600 | -55.9% | — |
| Hong Kong | 216,300 | +3.8% | — |
| Vietnam | 92,000 | +43.5% | All-Time High |
| Malaysia | 76,600 | +44.2% | March High |
| United Kingdom | 70,200 | +20.7% | All-Time High |
Source: Compiled by HotelBank Editorial Team from JNTO “Inbound Visitor Arrivals (March 2026 Estimates)”
YoY ADR Map of Japan’s 47 Prefectures: 45 Posted Positive Growth
According to MetroEngines Research data, of the nationwide ADR for all 47 prefectures in March 2026 (N=28,765 properties), 45 prefectures recorded year-over-year growth. Only Ibaraki (-0.7%) and Ehime (-1.4%) posted declines. The national average YoY change was +11.0%, indicating that the upward pricing trend driven by both expanding inbound demand and cost pass-through is now firmly established across the country.
The most striking gains came from the top three prefectures: Nara (+87.3%), Kanagawa (+42.3%), and Aichi (+31.4%). For Nara, supply-side changes among luxury properties — including the high-rate renewal plans of Nara Hotel ahead of its full renovation in autumn 2026 and the anticipated opening of a prison-themed hotel utilizing the former Nara Prison — appear to be major contributors. In Kanagawa, inbound demand in the Hakone area has grown more than tenfold compared to 2024, and the successive entries of foreign luxury brands are pushing the average rate higher.
Source: Compiled by HotelBank Editorial Team from MetroEngines Research (N=28,765 properties, March 2026)
Correlation Between Inbound Concentration and ADR Growth
To quantify how inbound stays affect ADR, we cross-referenced the foreign guest ratio by prefecture from the Japan Tourism Agency’s “Overnight Travel Statistics Survey” (January 2026, second preliminary release) with the March 2026 YoY ADR data from MetroEngines Research.
In “high inbound concentration” areas where the foreign guest ratio exceeds 40% — Tokyo (56.2%), Hokkaido (45.5%), Osaka (44.3%), and Kyoto (43.5%) — ADR YoY growth was solid, ranging from +7.5% to +18.6%. What is noteworthy, however, is that “medium concentration” areas with foreign guest ratios of 20-35% are also posting double-digit ADR gains in many cases. Iwate (foreign guest ratio 15.1% / ADR +15.1%), Miyagi (estimated ratio in the low 20s / ADR +14.8%), and Kagawa (ratio +10pp YoY / ADR +14.1%) all illustrate the ripple effect of inbound demand into regional Japan.
In addition, Aichi’s ADR growth of +31.4% stands out despite a relatively modest foreign guest ratio. This appears to result not from inbound factors alone, but from a combination of recovering domestic business demand and supply constraints in central Nagoya. For details on the surge in business hotel ADR nationwide, see also The Reality of Business Hotel Price Surges — Nationwide ADR Analysis and Top 10 Cost-Effective Prefectures for Business Travel. On the other hand, in southern Kyushu prefectures with low foreign guest ratios, such as Kagoshima (+0.3%) and Miyazaki (+0.1%), the ADR ripple has been limited.
Source: Compiled by HotelBank Editorial Team from MetroEngines Research (ADR) and Japan Tourism Agency “Overnight Travel Statistics Survey” (Foreign Guest Ratio)
March ADR Trends in Six Major Cities: Kyoto Stands Out at ¥46,500
Looking at March 2026 ADR for six major areas — Tokyo, Kyoto, Osaka, Hokkaido, Okinawa, and Fukuoka — Kyoto leads with ¥46,500, maintaining double-digit YoY growth at +18.6%. In addition to demand concentration during the cherry blossom season, the higher pricing in the machiya (traditional townhouse) and deluxe hotel categories (deluxe hotel average ¥161,800, N=34 properties) is lifting the overall figure.
Tokyo came in at ¥36,800 (+11.1%), softer than the ¥41,200 recorded in January 2026 but still posting double-digit growth on a YoY basis. Osaka registered ¥24,900 (+9.5%), growing steadily from the low ¥20,000s, although the price gap with Kyoto and Tokyo continues to widen. Hokkaido stood at ¥29,700 (+7.5%); March marks a seasonal decline from the winter peak (January ¥34,900, February ¥33,900) at the end of the ski season, but the rate still exceeded year-ago levels.
Why, then, do ADR growth rates differ so much between cities? One hypothesis is the “category mix effect.” Kyoto has a structure rich in high-priced segments — from deluxe hotels (¥161,800) to machiya (¥49,400) — making it easier to attract affluent inbound travelers and lift overall ADR. That said, business hotels are at ¥20,200, meaning the price gap between categories has reached eightfold, and the polarization should not be overlooked. For more on how Kyoto’s lodging tax revision is structurally accelerating ADR growth, see Kyoto’s New Lodging Tax After One Month: Kyoto ADR +18.6% YoY.
Source: Compiled by HotelBank Editorial Team from MetroEngines Research
| Area | ADR Mar 2026 | ADR Mar 2025 | YoY | Properties |
|---|---|---|---|---|
| Kyoto | ¥46,500 | ¥39,200 | +18.6% | 1,550 |
| Tokyo | ¥36,800 | ¥33,100 | +11.1% | 1,652 |
| Hokkaido | ¥29,700 | ¥27,600 | +7.5% | 1,490 |
| Fukuoka | ¥29,300 | ¥28,500 | +2.7% | 716 |
| Okinawa | ¥26,900 | ¥24,800 | +8.5% | 1,710 |
| Osaka | ¥24,900 | ¥22,700 | +9.5% | 872 |
Source: Compiled by HotelBank Editorial Team from MetroEngines Research
Reading the Three-Stage “Ripple Path” of Regional Dispersion
When the YoY ADR figures for all 47 prefectures are organized hierarchically, three distinct patterns emerge in how inbound demand ripples outward.
Stage 1: Gateway Cities (ADR +8% to +19%) — Tokyo, Kyoto, Osaka, Hokkaido, Okinawa, and Fukuoka, the six major destinations, have benefited earliest as direct stay destinations for inbound travelers. This trend continues in March 2026, but growth rates diverge. Against Kyoto’s +18.6%, Fukuoka registers only +2.7%, showing that even within the same gateway tier, “inbound traveler spend per stay” and “property category mix” significantly determine growth.
Stage 2: Adjacent Ripple Areas (ADR +10% to over +30%) — Prefectures adjacent to gateway cities, within day-trip or single-overnight range, fall into this layer. Representative examples include Kanagawa (+42.3%, Hakone and Yokohama), Nara (+87.3%, day-trip range from Kyoto), Saitama (+18.7%), Chiba (+20.1%), and Shiga (+11.8%). In these areas, overflow demand from saturated gateway lodging and rediscovery as “another destination” by inbound travelers appear to operate simultaneously.
Stage 3: Emerging Ripple Areas (ADR +5% to +15%) — Regions where inbound ratios remain low at around 15% but are growing rapidly fall into this stage. Iwate (+15.1%), Miyagi (+14.8%), Kagawa (+14.1%), and Nagano (+13.4%) belong here. Iwate’s foreign guest ratio surged from 9.2% in January 2025 to 15.1% in January 2026, an increase of +6.0pp, moving in step with ADR growth. Theme-driven demand such as “adventure travel” and “snow-country experiences” appears to be supporting inbound dispersion into these areas. For more on how Western and Southeast Asian travelers are lifting regional ADR, see also May 2026 Inbound Booking Trends: Western and Southeast Asian Travelers Lifting Regional ADR.
Source: Compiled by HotelBank Editorial Team from MetroEngines Research (N=28,765 properties)
Is There a Ceiling for ADR Growth? — The Impact of Falling China Demand and the Sustainability of the Multi-Market Model
Inbound arrivals in March 2026 grew a solid +3.5%, but the growth rate itself is decelerating. With 2025 full-year arrivals up +15.8% to 42.68 million, 2026 can be characterized as a phase shift from “volume growth” to “quality (rate) growth.”
The 55.9% drop in the China market is clearly negative on the volume side, but its impact on ADR is limited. Chinese group tours tend to use lower-priced lodging, while the growing Western markets tend to stay longer and at higher rates. Indeed, in Q1 2026 inbound consumption statistics, lodging’s share of spending reached 36.7%, up +3.2 percentage points from 33.5% in the same period last year (Source: Yamatogokoro.jp). For more on the structural changes that the China decline brings to nationality composition and the regional lodging market, see The -60% China Shock: Q1 2026 Nationality Mix Shift and Tectonic Changes in Japan’s Lodging Market.
That said, whether ADR growth is sustainable also depends on supply-side dynamics. As previously reported, Tokyo’s foreign guest ratio has reached 56.2%, surfacing the structural challenge of “a capital city where Japanese can no longer stay.” In Osaka, the 2025 World Expo effect has run its course, and 2026 faces a backlash. On the regional front, however, capacity for receiving inbound travelers continues to be developed, and substantial room for ADR ripple remains.
YoY ADR Ranking of All 47 Prefectures (March 2026)
| Rank | Prefecture | ADR (Mar 2026) | YoY | Properties |
|---|---|---|---|---|
| 1 | Nara | ¥59,600 | +87.3% | 241 |
| 2 | Kanagawa | ¥42,800 | +42.3% | 852 |
| 3 | Aichi | ¥31,100 | +31.4% | 619 |
| 4 | Okayama | ¥33,300 | +20.5% | 314 |
| 5 | Chiba | ¥36,700 | +20.1% | 981 |
| 6 | Saitama | ¥25,100 | +18.7% | 262 |
| 7 | Kyoto | ¥46,500 | +18.6% | 1,550 |
| 8 | Iwate | ¥23,600 | +15.1% | 322 |
| 9 | Miyagi | ¥27,800 | +14.8% | 422 |
| 10 | Kagawa | ¥30,800 | +14.1% | 364 |
| … (Ranks 11-43 fall in the +1.1% to +13.6% range) … | ||||
| 44 | Tottori | ¥29,300 | +0.1% | 211 |
| 45 | Miyazaki | ¥19,000 | +0.1% | 264 |
| 46 | Ibaraki | ¥25,000 | -0.7% | 376 |
| 47 | Ehime | ¥27,800 | -1.4% | 319 |
Source: Compiled by HotelBank Editorial Team from MetroEngines Research (N=28,765 properties, March 2026)
Summary
JNTO’s March 2026 statistics — “seven markets with single-month records and cumulative arrivals exceeding 10 million” — show that even as inbound demand approaches volume maturity, market diversification (the rise of Western and Southeast Asian markets) and higher-rate stay consumption are advancing simultaneously. From MetroEngines Research’s 47-prefecture ADR analysis, we can confirm that this demand shift is permeating lodging prices through a “three-stage ripple path” — gateway cities, adjacent areas, and emerging regions.
The result of 45 prefectures posting positive growth is evidence that the inbound price ripple is spreading nationwide, but the disparity in growth rates (from Nara at +87.3% to Ehime at -1.4%) also suggests that the degree of benefit varies dramatically by each area’s “inbound reception infrastructure,” “property category mix,” and “access environment.” Future ADR trends will hinge on three variables: the recovery scenario for the China market, the durability of high-rate demand from Western markets, and the expansion of regional reception capacity. For hoteliers, identifying which “ripple stage” their own area occupies and building a pricing strategy aligned with their target market will be essential.
Related Reading
- May 2026 Inbound Booking Trends: Western and Southeast Asian Travelers Lifting Regional ADR
- China Labour Day May 1-5 Holiday: Will “Labour Day Bookings” Grow Even With Inbound -60%? Verifying With OTA Prices
- The -60% China Shock: Q1 2026 Nationality Mix Shift and Tectonic Changes in Japan’s Lodging Market
- JTA’s FY2026 Budget of ¥138.3 Billion: Regional Dispersion Ideal vs. the 2.5x ADR Gap Reality
- National Civil Servant Travel Allowance vs. Real ADR — Visualizing the Gap Across 47 Prefectures (Latest 2026)
- March 2026: 3.62M Inbound Visitors and 10M Cumulative — Reading the Nationality Shift and Hotel Rate Sensitivity
- JTA January 2026 Preliminary Deep Dive: Tokyo’s Foreign Guest Ratio Settles Above 50% as Domestic Demand Thins
- Weekday ADR Analysis of Tokyo, Nagoya, Osaka, and Fukuoka: Visualizing the Recovery of Business Demand
- Kyoto’s New Lodging Tax After One Month: Kyoto ADR +18.6% YoY, with Price Bands Shifting to Higher Class
- The Reality of Business Hotel Price Surges — Nationwide ADR Analysis and Top 10 Cost-Effective Prefectures for Business Travel
- How Mandarin Oriental Setouchi Will Reshape the Regional Luxury Market: The Backdrop of Kagawa’s +17% ADR and an Opening-Impact Estimate
- Hokkaido in June, Free of the Rainy Season: How Will Hotel Prices Move? A Six-City ADR Comparison for 2026
- The True Nature of Labor-Cost Pass-Through ADR: Decoding the 2026 Hotel Pricing Structure via OCC-ADR Divergence
- JNTO Release: January 2026 Inbound Visitors Total 3,597,500 — Down 4.9% YoY, but South Korea Sets All-Time Single-Month Record Above 1.1 Million
- Summer 2026: Comprehensive Hotel Price Comparison of Okinawa, Hokkaido, and Kyoto — When Is the Best Time to Book?
- Marriott vs. Hyatt Japan Expansion Strategies in Data: 122 Properties / 15 Brands vs. 22 Properties / 7 Brands — Where Will the Next Foreign Brand Land in Regional Japan?