

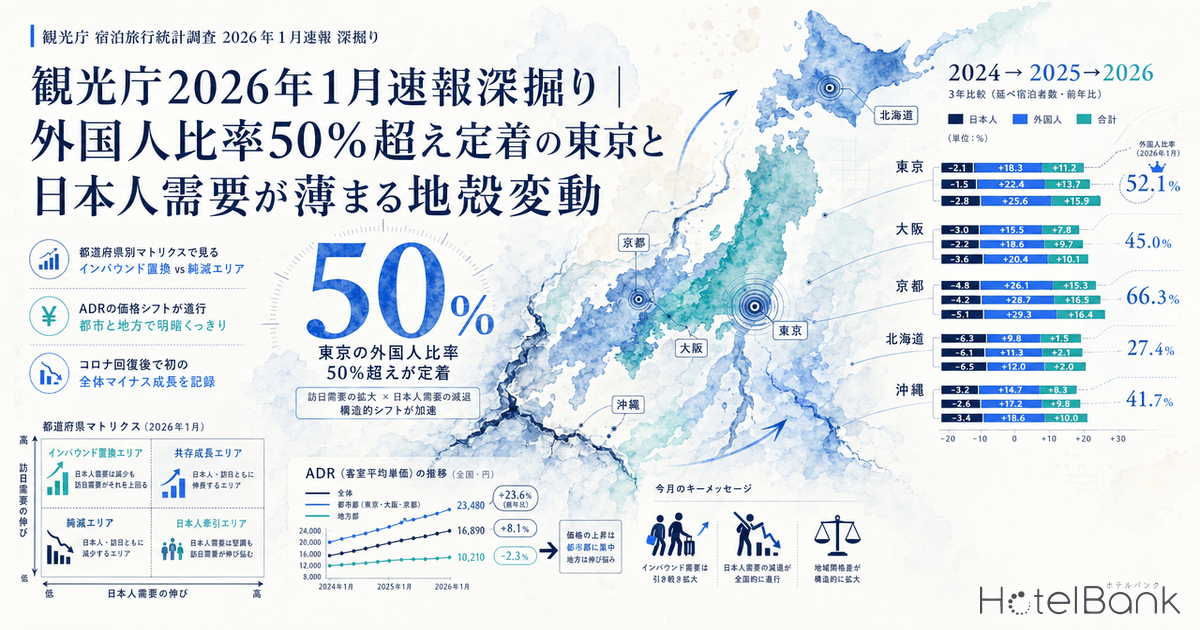

The Japan Tourism Agency’s “Overnight Travel Statistics Survey (January 2026, 2nd Preliminary Report),” released on March 31, 2026, contains structural shifts more important than the headline numbers suggest. Total guest nights came in at -7.0% year-over-year, with Japanese -3.3% and foreign -15.3% — an across-the-board slowdown. But when broken down by prefecture, two completely different trends are running in parallel. In this article, we cross-reference three years of prefecture-level data (January 2024, 2025, and 2026) to examine the trajectory of foreign-guest ratios, rank prefectures by Japanese guest declines, and conduct a matrix analysis separating “areas where foreign demand has substituted for Japanese demand” from “areas in pure contraction.” Combined with ADR trends, we test whether the hypothesis of “price tiers Japanese travelers can no longer afford” is actually playing out.
Metric Definitions Used in This Article
- ADR (Average Daily Rate): Average of publicly listed prices on OTAs and similar platforms. Differs from actual transacted prices. Per-room rate for double occupancy (tax included), averaged across all plans (room-only through dining-included).
- Data Source: MetroEngines Research
Overall Picture of the January 2026 Preliminary Report: A Rare “All-Direction Negative”
Total guest nights for January 2026 were 45.46 million (-7.0% YoY). The breakdown: Japanese guests at 32.63 million nights (-3.3%) and foreign guests at 12.83 million nights (-15.3%). Foreign guests as a share of total guest nights came to 28.2%. The sharp post-COVID rebound has run its course, and this is essentially the first time since 2024 that both inbound and domestic demand have turned negative simultaneously.
The main driver of the foreign-guest decline was the calendar effect of Chinese New Year (Spring Festival), which fell in January 2025 but shifted to February 2026, combined with a sharp -62.9% YoY drop in mainland Chinese guest nights. Taiwan, South Korea, and the United States all exceeded the prior-year month, but were unable to offset the China shortfall.
Source: Compiled by HotelBank Editorial Team from JTA “Overnight Travel Statistics Survey (January 2026, 2nd Preliminary Report)”
Three-Year Trend in Top Prefectures by Foreign Ratio: Only Tokyo Holds Above 50%
Lining up prefecture-level foreign-guest ratios (foreign guest nights / total guest nights) for the January cross-sections of 2024, 2025, and 2026 reveals that the landscape is shifting more than expected.
The most symbolic case is Tokyo. The ratio rose from 46.4% in January 2024 to 55.4% in January 2025 and 56.2% in January 2026 — clearing 50% for two consecutive years and cementing Tokyo’s status as “the capital where more foreigners stay overnight than Japanese.” Meanwhile, Kyoto, which had risen to 50.9% in January 2025, fell back to 43.5% in January 2026 — the prefecture most directly affected by the Chinese New Year calendar shift.
Worth noting: even prefectures that look like “overall negatives” in headline terms have seen their foreign-guest ratios climb meaningfully versus 2024. Gifu went from 20.6% to 27.5% (+6.9pp), Fukuoka from 30.1% to 36.8% (+6.7pp), Yamagata from 12.0% to 18.5% (+6.5pp), and Iwate from 9.2% to 15.1% (+6.0pp) — inbound is gradually taking root in snow-country prefectures, regional cities, and hot-spring towns. Kagawa’s +10.0pp was the largest gain among all 47 prefectures.
Source: Compiled by HotelBank Editorial Team from JTA “Overnight Travel Statistics Survey” (January 2nd Preliminary Reports for each year)
Prefectures Ranked by Japanese Guest Decline: Concentrated in Major Cities
Japanese guest nights for January 2026 were down -3.3% nationally. By prefecture, the steepest declines were Oita (-17.8%), Osaka (-16.1%), Tokyo (-15.7%), Saga (-14.9%), and Fukuoka (-14.5%).
The fact that the three biggest inbound cities — Osaka, Tokyo, and Fukuoka — all posted double-digit Japanese declines is something industry players should pay close attention to. These cities overlap with the high-foreign-ratio prefectures, and the pattern aligns with the “price tiers Japanese travelers can no longer afford” hypothesis discussed below.
| Rank | Prefecture | Jan 2025 Japanese | Jan 2026 Japanese | YoY | Jan 2026 Foreign Ratio |
|---|---|---|---|---|---|
| 1 | Oita | 502,130 | 413,000 | -17.8% | 26.1% |
| 2 | Osaka | 2,453,900 | 2,058,350 | -16.1% | 44.3% |
| 3 | Tokyo | 3,802,690 | 3,205,010 | -15.7% | 56.2% |
| 4 | Saga | 172,940 | 147,210 | -14.9% | 9.6% |
| 5 | Fukuoka | 1,223,330 | 1,046,020 | -14.5% | 36.8% |
| 6 | Hokkaido | 2,176,450 | 1,942,160 | -10.8% | 45.5% |
| 7 | Okayama | 338,360 | 302,210 | -10.7% | 10.6% |
| 8 | Gifu | 421,880 | 381,380 | -9.6% | 27.5% |
| 9 | Mie | 660,770 | 599,520 | -9.3% | 2.5% |
| 10 | Kagoshima | 551,060 | 500,410 | -9.2% | 11.7% |
Source: Compiled by HotelBank Editorial Team from JTA “Overnight Travel Statistics Survey (January 2026, 2nd Preliminary Report).” Top 10 prefectures by Japanese YoY decline.
“Substitution vs. Pure Contraction” Matrix Analysis: Where Is the Real Tectonic Shift?
It would be premature to lump all Japanese-decline prefectures together as “demand loss.” Even within the same negative bucket, prefectures where foreign demand has expanded enough to hold the total steady are fundamentally different from those where both segments have shrunk. We mapped all 47 prefectures onto a four-quadrant grid using Japanese YoY and foreign YoY as the two axes.
Source: Compiled by HotelBank Editorial Team from JTA “Overnight Travel Statistics Survey (January 2026, 2nd Preliminary Report)”
The result: the 47 prefectures fall into four groups.
| Quadrant | # of Prefectures | Main Examples | Interpretation |
|---|---|---|---|
| Q1: Substitution (JP -, Foreign +) | 6 | Oita, Iwate, Yamagata, Okinawa, Hyogo, Hiroshima | Foreign demand is plugging the hole left by domestic decline — the quadrant most directly aligned with this article’s central theme |
| Q2: Pure Contraction (JP -, Foreign -) | 18 | Osaka, Tokyo, Fukuoka, Hokkaido, Aichi, Kanagawa | Direct hit from the Chinese New Year calendar shift. The higher the inbound dependency, the bigger the rebound |
| Q3: Both Positive (JP +, Foreign +) | 12 | Ibaraki, Kochi, Fukushima, Tottori, Yamaguchi, Tochigi | Growth areas where total demand is expanding. Inbound is penetrating regional Japan |
| Q4: Domestic Return (JP +, Foreign -) | 11 | Kyoto, Toyama, Nara, Aomori, Nagasaki, Nagano | Domestic demand has filled the hole left by the Chinese New Year shift. Kyoto is the prime example |
Source: Compiled by HotelBank Editorial Team from JTA “Overnight Travel Statistics Survey (January 2026, 2nd Preliminary Report)” (N=47 prefectures)
What stands out is the presence of the Q1 “substitution” group: Oita, Iwate, Yamagata, and Okinawa. All four show negative Japanese YoY but double-digit foreign growth — clear evidence that demand mix is shifting decisively toward foreign guests. Oita is especially striking, with Japanese -17.8% and foreign +6.2%, the country’s most pronounced “substitution” case. In hot-spring destinations like Beppu and Yufuin, inbound demand is unmistakably backfilling domestic demand.
By contrast, the headline-grabbing Tokyo, Osaka, and Fukuoka actually fall into Q2 “pure contraction.” Precisely because they have high foreign-guest ratios, they took the brunt of the Chinese New Year calendar shift, ending the month with double-digit declines on both Japanese and foreign sides. January 2026 was the month when high inbound dependency surfaced as vulnerability to external shocks.
ADR Trends and Testing the “Price Tiers Japanese Can’t Afford” Thesis
So is the sharp drop in Japanese guests in cities like Tokyo and Kyoto really being driven by rising price tiers? We pulled prefecture-level ADR trends for January 2024, 2025, and 2026 from MetroEngines Research’s public-pricing dataset.
Source: Compiled by HotelBank Editorial Team from MetroEngines Research. Per-room rate for double occupancy (tax included). Sample sizes for January 2026: Tokyo N=7,187, Kyoto N=5,813, Hokkaido N=13,790, Fukuoka N=4,960, Okinawa N=6,337, Osaka N=5,291.
The result is unambiguous. Tokyo’s January 2026 ADR was ¥41,200 — up +47.2% from January 2024’s ¥28,000. Kyoto rose from ¥35,400 to ¥41,700 (+17.7%), Hokkaido from ¥30,400 to ¥34,900 (+14.7%), and Fukuoka from ¥25,800 to ¥28,800 (+11.7%). Osaka, by contrast, moved only modestly from ¥21,200 to ¥23,000 (+8.7%) — much smaller than Tokyo or Kyoto.
Tokyo’s +47.2% rise dramatically outpaces the growth in real Japanese wages over the same two-year stretch (the Ministry of Health, Labour and Welfare’s “Monthly Labour Survey” shows roughly flat to slightly positive movement across 2024-2025), suggesting a widening gap between hotel pricing and what Japanese travelers can pay. The -15.7% Japanese decline in Tokyo likely reflects both calendar effects and a structurally meaningful “price-affordability gap.”
| Prefecture | Jan 2024 ADR | Jan 2025 ADR | Jan 2026 ADR | vs. 2024 | Jan 2026 JP YoY |
|---|---|---|---|---|---|
| Tokyo | ¥28,000 | ¥29,600 | ¥41,200 | +47.2% | -15.7% |
| Kyoto | ¥35,400 | ¥35,000 | ¥41,700 | +17.7% | +0.2% |
| Hokkaido | ¥30,400 | ¥29,800 | ¥34,900 | +14.7% | -10.8% |
| Fukuoka | ¥25,800 | ¥27,600 | ¥28,800 | +11.7% | -14.5% |
| Okinawa | ¥22,500 | ¥23,900 | ¥24,900 | +10.7% | -2.4% |
| Osaka | ¥21,200 | ¥22,000 | ¥23,000 | +8.7% | -16.1% |
Source: Compiled by HotelBank Editorial Team from MetroEngines Research and JTA “Overnight Travel Statistics Survey.” ADR is monthly average for January, per-room rate for double occupancy (tax included).
Kyoto’s positioning in Q4 “domestic return” (Japanese +0.2%, foreign -25.6%) is also notable. Despite ADR rising +17.7% versus 2024, Japanese demand edged up slightly. One plausible explanation: the sharp drop in foreign demand brought back discount plans, temporarily restoring booking opportunities for Japanese travelers. This can be read as a temporary swing back from the “Japanese travelers being priced out of Kyoto” pattern observed throughout 2025.
Structural Shift Through the Occupancy Lens: Rooms Stay Full, but Filled by Whom?
National occupancy in January 2026 was 52.7% (-1.9pp YoY). The top five prefectures: Tokyo 70.7%, Fukuoka 63.7%, Osaka 62.8%, Chiba 61.8%, and Saitama 60.5%. Notably, Tokyo, Osaka, and Fukuoka — all prefectures that posted double-digit Japanese declines — are still maintaining top-tier occupancy. This signals that foreign demand remains at a high level and confirms a structural pattern of “rooms stay full even as Japanese demand recedes.”
In regional cities, however, several prefectures saw occupancy drop sharply YoY. Osaka fell -8.9pp, Tottori -7.7pp, Saga -7.0pp, Gifu -5.5pp, and Yamagata -4.1pp. In regional Japan, prefectures that haven’t successfully captured inbound demand see Japanese-side weakness flow directly through to occupancy.
Source: Compiled by HotelBank Editorial Team from JTA “Overnight Travel Statistics Survey (January 2026, 2nd Preliminary Report)”
Implications for Investors and Operators: Beyond a Simple “Inbound Winners vs. Losers” Framework
The data raises several structural points hotel investors and operators should keep in mind. To organize them:
1. The “50%+ foreign-ratio club” is consolidating around Tokyo alone
In January 2024, no prefecture cleared 50%. In January 2025, Tokyo and Kyoto did. In January 2026, only Tokyo did. Kyoto’s swing back below 50% underscores why these year-over-year ratios need to be smoothed before being interpreted. At minimum, Tokyo can now be considered a structurally “foreign-led” market.
2. The “price tiers Japanese can’t afford” pattern is most pronounced in Tokyo
Tokyo ADR’s +47.2% rise versus 2024 dramatically outpaces the growth in Japanese pay, suggesting that pricing factors carry non-trivial weight in the -15.7% Japanese decline. The structural setup makes it harder for Japanese demand to fill any gap when inbound demand temporarily slows.
3. “Substitution” prefectures merit attention as medium- to long-term investment targets
Q1 prefectures like Oita, Iwate, Yamagata, and Okinawa are seeing inbound demand backfill structural Japanese declines. Domestic demand in regional Japan is on a long-term gradual decline due to depopulation, but the inbound penetration that’s covering the gap is a positive for hotel investment. Meanwhile, Q3 “both positive” prefectures — Kochi, Ibaraki, Fukushima, Tottori, Yamaguchi — are smaller in scale today but rank among the country’s top growth performers and warrant close watching.
4. The higher the inbound dependency, the more vulnerable to short-term volatility
Tokyo, Osaka, Fukuoka, and Hokkaido all landing in Q2 “pure contraction” is the direct result of the Chinese New Year calendar effect. As monthly volatility intensifies, operators need to look at multi-month averages rather than reacting to single-month numbers. At the same time, pricing strategy flexibility — keeping plans aimed at Japanese guests, running parallel domestic-focused campaigns, etc. — contributes to revenue stabilization during demand drops.
5. Watch for the post-Chinese-New-Year rebound from February 2026 onward
The 1st preliminary report for February 2026 shows total guest nights at 46.25 million (-3.5% YoY) — a smaller decline than January. Chinese demand likely returned with the February shift of Chinese New Year. Whether the underlying structural slowdown is real, and how deep it runs, will need to be reassessed using the February 2nd preliminary report scheduled for release on April 30, with January and February combined.
Summary: Bifurcation Underway Behind the Headline Numbers
At first glance, January 2026’s headline of “overall -7.0%” looks like bad news. But broken out by prefecture, three patterns are running in parallel: areas where total demand is shrinking (Q2 pure contraction), areas where the demand mix is shifting toward foreign guests (Q1 substitution), and areas where overall demand is expanding (Q3 both positive). This bifurcation — or perhaps trifurcation — is the new shape of Japan’s hotel market.
Tokyo’s 56.2% foreign-guest ratio and +47.2% ADR-versus-2024 are not simply an extension of inbound growth — they should be read as the endpoint of a structural shift in which “Japanese travelers have become priced out of staying in the capital.” At the same time, regional prefectures like Oita and Iwate, where foreign substitution has held occupancy and rates steady despite domestic decline, can’t be ignored. Investment and operational decisions can no longer treat all 47 prefectures as a single “Japan hotel market.” We have entered an era requiring individual analysis of each prefecture’s quadrant position and the direction of its price-tier shift.
Related Reading
- Hotel Dining Worth Choosing for Special Occasions: Review Rankings of Luxury Hotels in Tokyo, Osaka, and Nagoya
- Summer 2026: Okinawa, Hokkaido, Kyoto Hotel Price Comparison — When Is the Best Time to Book?
- Summer 2026 Hotel Market: April OTA Data Across 5 Resort Areas
- Atami Ryokan Deep Dive (April 2026): Market Structure and ADR Trends Across 76 Properties / 2,508 Rooms