

Imagine building the same 200-room business hotel, from the same business plan, in Tokyo and in Yamanashi. Construction cost, assumed ADR, the GOP margin assumption — almost every field an investor fills in first is identical. Yet one variable separates the two in the first year of operation: how many of the people you need you can actually hire in that location. This article lays out that “volume and geography of labor supply” across all 47 prefectures — as a distribution of headcount rather than of wage rates — and sets out where it belongs in a business plan.
HotelBank has covered the labor cost of the accommodation industry from three angles so far. The minimum-wage series asked a pricing question — how far an increase in the wage rate can be absorbed through ADR. The employee-housing and workforce-infrastructure series was about recovering Capex. The labor-saving investment series was about replacing people with equipment. This article overlaps with none of them. Its subject is the geography of hireability: the single point that “the same plan is easier or harder to staff depending on the prefecture.” Wage rates are fixed as a common assumption across every prefecture; only the distribution of headcount is allowed to move, and we look at how that shows up in GOP and yield.
Metric Definitions Used in This Article
- Specified Skilled Worker residents in the accommodation sector: the number of residents holding the Specified Skilled Worker (i) status whose designated industry field is accommodation, per Table 5 (by prefecture and municipality, by designated industry field) of the Immigration Services Agency’s “Number of Foreign Residents with Specified Skilled Worker Status.” Counted at the location of the accepting organization. Prefecture-level confirmed figures are released twice a year, so the prefecture figures in this article are as of end-December 2025, the latest available. Sector-total preliminary figures are published through end-March 2026.
- Room stock: the total room count of the 21,156 properties / 1,324,155 rooms among the domestic lodging facilities tracked by MetroEngines Research for which online inventory could be observed as of July 2026. Ryokan, minshuku and simple lodging houses not listed online are not included.
- Residents per 1,000 rooms: the prefecture’s accommodation-sector resident count ÷ (its room stock ÷ 1,000). A normalized measure for comparing prefectures once differences in market size are removed. The absolute level of this density moves by a few percent depending on how room stock is defined (listing-based versus inventory-observation-based), so the denominator must be aligned when comparing with figures from other sources.
- Active job openings-to-applicants ratio: the ratio published in the Ministry of Health, Labour and Welfare’s “Employment Referrals for General Workers” (regular employment, including part-time). Prefecture figures come from long-term time-series Table 18 (by prefecture, place of work basis); occupational figures from Table 21 (national, place of application basis). No occupation-by-prefecture cross-tabulation is published, so the two are treated here as separate axes. A higher value means more openings per job seeker — that is, stronger competition among employers recruiting.
- ADR (average daily rate): an estimated transacted rate (tax-excluded equivalent) derived by applying a segment-specific adjustment factor to each property’s lowest publicly listed plan level online (double occupancy, per-room rate, tax included). Cross-checked against property-level results disclosed by listed hotel REITs (91 properties, most recent three months), the median error is about 7%. These are estimates and differ from each property’s actual transacted prices and accounting figures. Area-level ADR is the median of the properties covered (the level of a typical property in the area).
- OCC (occupancy): sold rooms as a share of total rooms in the area — an estimate based on online sales inventory, verified against REIT monthly disclosures to an accuracy of roughly a few percentage points. It reflects the depletion of inventory sold online and differs from a property’s overall actual occupancy.
- Data sources: Immigration Services Agency / Ministry of Health, Labour and Welfare / Ministry of Internal Affairs and Communications and Ministry of Economy, Trade and Industry / MetroEngines Research & Consulting
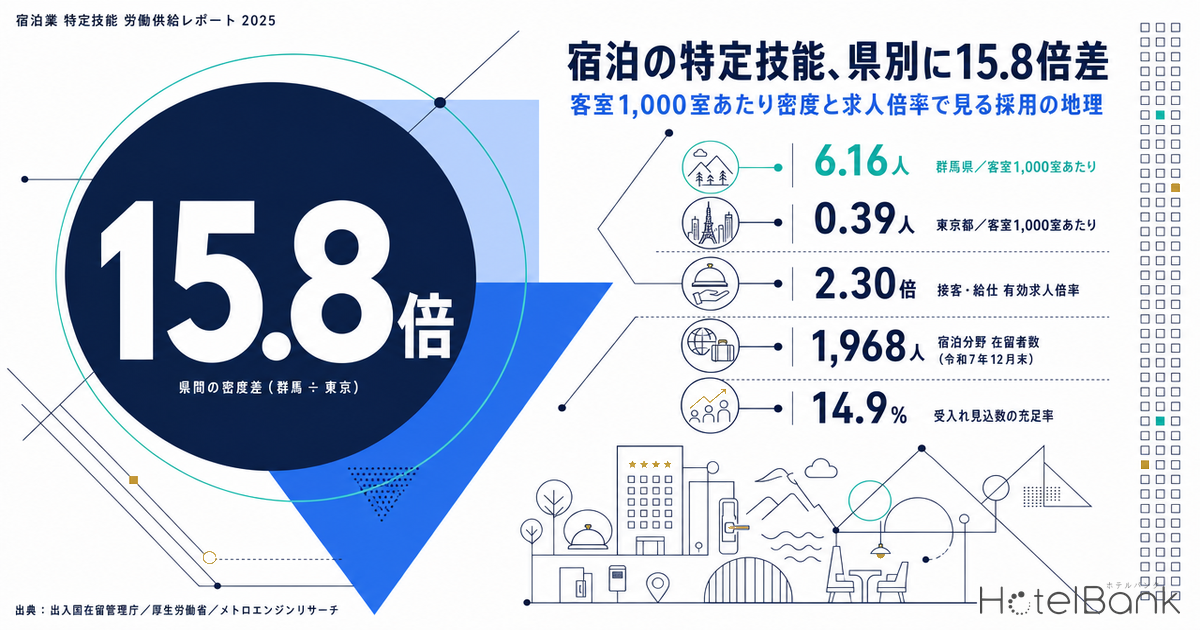
- — Specified Skilled Worker residents in the accommodation sector total 1,968 nationwide (end-December 2025). That is roughly 2.9x higher than a year earlier, yet it fills only 14.9% of the 14,800-person intake target.
- — Normalizing per 1,000 rooms reshuffles the raw-count ranking: Gunma 6.16 against Tokyo 0.39, a 15.8x spread in density between prefectures.
- — The openings-to-applicants ratio for service and waiting staff is 2.30x (July 2026; 1.05x across all occupations). The visa channel and the domestic labor market pull in opposite directions, correlating with room stock at −0.49 and −0.20 respectively.
- — Of the four quadrants, Quadrant C (thin visa channel x loose domestic market) holds 43.6% of all room stock. Judging hireability from either indicator alone leads to the wrong read.
- — A 10-point drop in the staffing fill rate erodes GOP by 6-7%; a 20-point drop, by 12-14%. The effect on GOP yield is about 0.7 points — roughly the same magnitude as a 10% move in construction cost.
The national picture: 2.9x in a year, still only 14.9% of the quota
Start with the overall volume. Table 5 of the Immigration Services Agency’s “Number of Foreign Residents with Specified Skilled Worker Status (end-December 2025)” puts Specified Skilled Worker (i) residents at 382,341 across all fields. Of these, 1,968 are in the accommodation sector. Six months earlier, at end-June 2025, the figure was 1,265; a year earlier, at end-December 2024, it was 671 — roughly a 2.9x increase over twelve months.
A more recent preliminary figure exists. The agency’s “Intake Targets and Resident Numbers for Specified Skilled Worker (i) (as of end-March 2026, preliminary)” puts accommodation-sector residents at 2,207, with an annual increase of 1,365. That release, however, covers sector totals only and carries no prefecture breakdown. Reading the geography prefecture by prefecture requires the semi-annual Table 5 — which is why every prefecture figure in this article is as of end-December 2025.
The denominator is what deserves attention. The same preliminary table sets the accommodation sector’s intake target at 14,800, against which the fill rate is only 14.9%. With the all-field fill rate at 50.2% (404,527 residents against a target of 805,700), accommodation is among the fields with the most headroom left against its own quota. Put the other way round: if the current growth continues, today’s geography is a snapshot of something still being repainted. How far that growth runs also depends on the design of the scheme itself — in particular on the treatment of the “(ii)” status, which removes the cap on length of stay.
Raw counts and per-room density rank differently: Gunma 6.16, Tokyo 0.39
Line the raw headcounts up by prefecture and the top of the list reads Hokkaido 185, Kanagawa 141, Gunma 113, Hyogo 104, Okinawa 100. But since room stock varies more than tenfold between prefectures, that ordering is little more than a ranking of market size. So divide each prefecture’s resident count by its room stock and restate it as persons per 1,000 rooms. Nationally that is 1,968 ÷ 1,324,155 rooms, or 1.49 — roughly one person per 670 rooms.
Switch to that yardstick and the ranking moves sharply. Gunma leads at 6.16, followed by Gifu at 4.80, Wakayama at 3.71 and Yamanashi at 3.26 — all prefectures whose room stock is anchored by onsen ryokan serving dinner and breakfast. Tokyo and Osaka, ninth and tenth on raw counts, fall to 0.39 and 0.55, less than half the national level. Hokkaido, first on raw counts, sits 18th at 2.01; Kanagawa, second on raw counts, sits 8th at 2.97. How far a prefecture moves differs entirely from one to the next. The gap between the highest and lowest density is about 15.8x between Gunma and Tokyo, and widens to 41x once Aomori (0.15) is included.
This reshuffle is not a statistical artifact. The accommodation-sector visa covers person-facing work — front desk, planning and PR, guest service, restaurant service — so business models with more person-facing work per room, such as ryokan and resorts serving dinner and breakfast, need more staff per room. That prefectures with onsen destinations cluster at the top of the density ranking reads as a direct reflection of business-model mix. Where the stock is dominated by urban business hotels, the headcount needed per room is smaller to begin with, so the same number of people produces a lower density.
| Rank | Prefecture | Room stock | Residents end-Dec 2025 |
Same end-Jun 2025 |
Per 1,000 rooms |
Openings ratio (x) |
Est. OCC | Est. ADR |
|---|---|---|---|---|---|---|---|---|
| 1 | Gunma | 18,348 | 113 | 62 | 6.16 | 1.36 | 81.8% | ¥10,860 |
| 2 | Gifu | 15,821 | 76 | 53 | 4.80 | 1.43 | 84.3% | ¥10,186 |
| 3 | Wakayama | 10,784 | 40 | 36 | 3.71 | 1.00 | 85.6% | ¥9,218 |
| 4 | Yamanashi | 14,720 | 48 | 28 | 3.26 | 1.68 | 85.3% | ¥10,720 |
| 5 | Hyogo | 32,678 | 104 | 53 | 3.18 | 1.02 | 88.7% | ¥12,027 |
| 6 | Oita | 16,372 | 51 | 43 | 3.12 | 1.22 | 82.5% | ¥12,606 |
| 7 | Yamagata | 11,336 | 35 | 29 | 3.09 | 1.48 | 87.3% | ¥8,936 |
| 8 | Kanagawa | 47,397 | 141 | 94 | 2.97 | 1.00 | 85.6% | ¥12,784 |
| 9 | Fukui | 8,916 | 26 | 8 | 2.92 | 1.64 | 88.5% | ¥10,090 |
| 10 | Kagawa | 11,834 | 34 | 12 | 2.87 | 1.50 | 84.6% | ¥7,518 |
| 11 | Nagano | 33,774 | 91 | 53 | 2.69 | 1.38 | 89.4% | ¥11,052 |
| 12 | Tochigi | 21,729 | 56 | 29 | 2.58 | 1.18 | 84.2% | ¥9,629 |
| 13 | Kagoshima | 19,750 | 46 | 28 | 2.33 | 1.05 | 82.0% | ¥6,522 |
| 14 | Ibaraki | 18,215 | 41 | 35 | 2.25 | 1.28 | 85.9% | ¥6,746 |
| 15 | Kumamoto | 19,623 | 44 | 36 | 2.24 | 1.26 | 84.2% | ¥9,205 |
| Rank | Prefecture | Room stock | Residents end-Dec 2025 |
Same end-Jun 2025 |
Per 1,000 rooms |
Openings ratio (x) |
Est. OCC | Est. ADR |
|---|---|---|---|---|---|---|---|---|
| 36 | Iwate | 16,166 | 13 | 1 | 0.80 | 1.24 | 86.8% | ¥6,936 |
| 37 | Kyoto | 52,693 | 42 | 30 | 0.80 | 1.15 | 83.8% | ¥12,161 |
| 38 | Okayama | 13,946 | 10 | 9 | 0.72 | 1.26 | 86.1% | ¥8,073 |
| 39 | Miyazaki | 12,270 | 8 | 1 | 0.65 | 1.19 | 84.2% | ¥6,498 |
| 40 | Aichi | 54,338 | 33 | 22 | 0.61 | 1.17 | 85.8% | ¥8,185 |
| 41 | Osaka | 110,295 | 61 | 51 | 0.55 | 0.92 | 86.5% | ¥8,761 |
| 42 | Fukushima | 22,488 | 12 | 7 | 0.53 | 1.38 | 86.1% | ¥7,296 |
| 43 | Fukuoka | 54,406 | 25 | 20 | 0.46 | 0.94 | 91.1% | ¥10,873 |
| 44 | Tokyo | 182,896 | 72 | 61 | 0.39 | 1.04 | 93.1% | ¥12,642 |
| 45 | Ehime | 14,307 | 3 | 2 | 0.21 | 1.39 | 84.6% | ¥6,702 |
| 46 | Akita | 10,436 | 2 | 1 | 0.19 | 1.29 | 90.4% | ¥8,593 |
| 47 | Aomori | 13,039 | 2 | 0 | 0.15 | 1.18 | 93.7% | ¥7,713 |
Overlaying the domestic labor market: 2.30x for service staff, 1.4pt off the peak
The visa scheme is a supplementary channel; most accommodation-industry staff are still hired from the domestic labor market. So overlay the occupational data from the Ministry of Health, Labour and Welfare’s “Employment Referrals for General Workers.” Nationally, in July 2026, the openings-to-applicants ratio stood at 2.30x for service and waiting staff and 2.18x for food preparation workers — more than double the 1.05x across all occupations. More openings per job seeker means, in plain terms, occupations where employers compete hard for candidates.
The direction of travel, however, is toward easing. The ratio for service and waiting staff peaked at 3.70x in December 2022 (the current occupational classification series starts in April 2022), then fell steadily to 2.30x by July 2026 — a decline of 1.40 points in about three years and seven months. Food preparation fell from the low threes to 2.18x over the same period. In the sense that applications now gather more readily per opening, the time and effort a search requires can be assumed to be looser than a few years ago. When writing “how many months to hire” into a business plan, there is no need to extrapolate the felt tightness of the post-pandemic years.
One caution is needed here. The ministry publishes occupational and prefectural series separately, but no occupation-by-prefecture cross-tabulation is published. A value such as “the openings ratio for service staff in Yamanashi” therefore does not exist. This article treats the occupational level (national, 2.30x for service staff) and the regional level (prefecture, all occupations) as separate axes, and reads regional differences on the all-occupations prefecture basis.
On that prefecture basis (place of work, July 2026), the highest readings are Yamanashi at 1.68x, Toyama at 1.67x, Fukui at 1.64x and Shimane at 1.59x. The lowest are Osaka at 0.92x, Fukuoka at 0.94x, Kanagawa at 1.00x, Wakayama at 1.00x and Hokkaido at 1.01x. In the major metropolitan labor markets, openings fall below — or roughly match — the number of job seekers, an environment in which applications gather readily. Rather than the simple picture of “the more rural, the harder to hire,” the statistics show that on the openings ratio it is the prefectures of Chubu, Hokuriku and San’in that are tight, while the big metropolitan areas are comparatively loose.
Sorting the two supply channels into quadrants: a labor supply map of all 47 prefectures
Take the two axes established so far — the thickness of the visa channel (residents per 1,000 rooms) and the looseness of the domestic labor market (the openings ratio) — and cut each at its median (1.36 and 1.26x) to form quadrants. Bubble size is room stock.
Quadrant A Thick visa channel x loose domestic market (11 prefectures, 380,897 rooms)
Hokkaido, Okinawa, Kanagawa, Shizuoka, Hyogo, Miyagi, Tochigi, Kagoshima and three others. Both channels are thick, so the required headcount can be assembled from either. This is the zone where the hiring buffer built into an opening schedule can be relatively thin.
Quadrant B Thick visa channel x tight domestic market (13 prefectures, 214,646 rooms)
Gunma, Gifu, Yamanashi, Fukui, Yamagata, Nagano, Kagawa, Kumamoto and five others. A high domestic openings ratio is offset by the thickness of the visa channel. The high-density onsen prefectures cluster here. Because operators with an intake track record are already nearby, dormitory and living-support infrastructure is also further along within the region.
Quadrant C Thin visa channel x loose domestic market (12 prefectures, 577,704 rooms)
Tokyo, Osaka, Fukuoka, Aichi, Kyoto, Chiba and six others. 43.6% of all room stock sits here. Operations in this zone have been built on the depth of the domestic labor market, leaving considerable room for the visa channel to widen. Apportioned by room stock, the headroom toward the sector’s 14,800-person intake target falls most heavily in this quadrant.
Quadrant D Thin visa channel x tight domestic market (11 prefectures, 150,908 rooms)
Niigata, Ishikawa, Toyama, Shimane, Tottori, Yamaguchi, Okayama and four others. Both channels are still ahead of them. Turned around, this is the quadrant where designed countermeasures matter most — staff housing and dormitories, labor-saving investment, the choice of operator — and where the gap between those who act and those who do not opens widest.
In correlation terms, the larger a prefecture’s room stock, the lower its openings ratio (−0.49) and, at the same time, the thinner its residents per 1,000 rooms (−0.20). The two supply channels broadly work in opposite directions, so in volume terms they tend to offset each other. That is precisely why judging “easy or hard to hire” from a single indicator misreads the situation — and why the quadrant view earns its place.
The “labor catchment” works below prefecture level: walk-in employment differs by more than 100x
The prefecture is a coarse unit for an investment decision. Recruiting actually happens around the property, and the size of the commutable area is the applicant pool. Taking establishment counts and employee numbers within a 1.5 km radius for four representative areas from the Economic Census for Business Activity (Ministry of Internal Affairs and Communications / Ministry of Economy, Trade and Industry), the orders of magnitude differ sharply even within one country.
| Area (center coordinates) | Small areas | Establishments | Employees | Office-type share | Coverage |
|---|---|---|---|---|---|
| Shinjuku (35.6938, 139.7036) | 33 | 19,348 | 483,032 | 35.8% | ok |
| Umeda (34.6873, 135.5259) | 95 | 11,720 | 200,036 | 36.4% | ok |
| Naha (26.2124, 127.6809) | 48 | 7,076 | 65,656 | 24.9% | ok |
| Kusatsu Onsen (36.6218, 138.5960) | 1 | 584 | 3,754 | 4.3% | sparse |
Within 1.5 km of Shinjuku, 483,032 people work, 35.8% of them in office-type jobs — meaning talent moves back and forth with other industries inside the same catchment. Within the same radius of Kusatsu Onsen, the figures are 3,754 and 4.3%: the local employment structure itself leans toward accommodation and food service. The difference should be treated not as “which is better” but as a difference in how wide a recruiting footprint the plan assumes. Where the walk-in labor market is thin, shuttle transport to widen the commutable area — or live-in dormitories and staff housing — enters the business plan as a mandatory component from the outset.
Translating the staffing fill rate into GOP and yield: a 200-room business hotel and a 120-room resort
From here we convert the thickness or thinness of labor supply into business-plan figures. The key is to hold the wage rate constant across every case and move only the fill rate of headcount. The rate discussion belongs to the minimum-wage work; this article isolates how volume alone bites.
Start by building up the required headcount. For housekeeping we use the operational rule of thumb of 25-35 minutes per room for checkout cleaning and roughly six productive hours (360 minutes) per cleaner per day. For the front desk we take a staffing example of three on day shift and two to three on night shift at 200-room scale, then multiply by a factor of 1.4 — the two-days-off-per-week equivalent — to cover all 365 days and convert to FTE. On that build-up, the 200-room business hotel comes to 34.0 FTE (0.17 per room), and the 120-room resort, with food and beverage added, to 55.0 FTE (0.46 per room).
| Department | Case A 200-room business hotel (planned OCC 85%, full-year assumption) |
Case B 120-room resort (planned OCC 72%, full-year assumption) |
Basis of calculation |
|---|---|---|---|
| Housekeeping | 20.0 | 14.0 | Occupied rooms x cleaning time ÷ 360 productive minutes/day |
| Front desk and bell | 7.7 | 8.4 | Staffing example of 3 day shift + 2-3 night shift, annualized |
| Food and beverage (kitchen and service) | — | 22.0 | Assumes dinner and breakfast service |
| Breakfast, administration, engineering, sales | 6.3 | 10.6 | General manager, accounting, engineering, bath house management, etc. |
| Total | 34.0 FTE 0.17 per room |
55.0 FTE 0.46 per room |
— |
Next, model what happens when the fill rate falls short of 100%. Responses on the ground broadly split in two: topping up with agency or spot workers, or restricting the number of rooms offered for sale. This article adopts an intermediate assumption — half the shortfall is covered by agency staff at a 1.5x rate, and the other half is absorbed by restricting rooms offered. Payroll falls only slightly, because the direct cost of the unfilled positions disappears while the agency premium is added on top, whereas revenue falls further as occupancy declines.
| Item | Fill rate 100% | Fill rate 90% | Fill rate 80% |
|---|---|---|---|
| Achieved OCC (full year, modeled) | 85.0% | 80.8% | 76.5% |
| Revenue | ¥834M | ¥792M | ¥751M |
| Payroll | ¥136M | ¥133M | ¥129M |
| Other operating expenses | ¥384M | ¥364M | ¥345M |
| GOP | ¥314M | ¥295M | ¥276M |
| GOP margin | 37.7% | 37.3% | 36.8% |
| Change in GOP (vs. 100%) | — | −¥19.1 million (−6.1%) | −¥38.2 million (−12.2%) |
| Total investment (2025 actual unit cost) | ¥5.04B | ¥5.04B | ¥5.04B |
| GOP yield | 6.23% | 5.85% | 5.47% |
| Total investment (after construction-period inflation) | ¥5.64B | ¥5.64B | ¥5.64B |
| Same, GOP yield | 5.57% | 5.23% | 4.89% |
| Item | Fill rate 100% | Fill rate 90% | Fill rate 80% |
|---|---|---|---|
| Achieved OCC (full year, modeled) | 72.0% | 68.4% | 64.8% |
| Revenue | ¥946M | ¥899M | ¥852M |
| Payroll | ¥220M | ¥215M | ¥209M |
| Other operating expenses | ¥445M | ¥422M | ¥400M |
| GOP | ¥281M | ¥262M | ¥242M |
| GOP margin | 29.7% | 29.1% | 28.5% |
| Change in GOP (vs. 100%) | — | −¥19.6 million (−7.0%) | −¥39.1 million (−13.9%) |
| Total investment (2025 actual unit cost) | ¥5.61B | ¥5.61B | ¥5.61B |
| GOP yield | 5.02% | 4.67% | 4.32% |
| Total investment (after construction-period inflation) | ¥6.42B | ¥6.42B | ¥6.42B |
| Same, GOP yield | 4.39% | 4.08% | 3.78% |
| ADR \ Fill rate | 100% | 90% | 80% |
|---|---|---|---|
| ¥11,000 | 4.90% | 4.60% | 4.29% |
| ¥11,500 | 5.23% | 4.91% | 4.59% |
| ¥12,000 (base) | 5.57% | 5.23% | 4.89% |
| ¥12,500 | 5.90% | 5.54% | 5.19% |
| ¥13,000 | 6.23% | 5.86% | 5.49% |
The result: a 10-point drop in the staffing fill rate erodes GOP by 6-7%, and a 20-point drop by 12-14%. In yield terms, the 200-room business hotel moves from 6.23% to 5.47% (−0.76pt) and the 120-room resort from 5.02% to 4.32% (−0.70pt). The more labor-intensive resort is the more sensitive in percentage terms (−13.9% versus −12.2%). A yield difference of roughly 0.7 points is about the same magnitude as a 10% move in construction cost, which makes this a variable that deserves the same weight in a business plan as the precision of the construction estimate.
Return to the quadrants. In a Quadrant D prefecture, where both supply channels are still ahead of the market, assuming a 100% fill rate in the first year of operation is somewhat bullish. In Quadrant A or B, where an intake track record and living-support infrastructure already exist nearby, the ramp-up under the same plan is easier to call. That the same business plan carries a different probability of working out depending on the prefecture is, in the end, a question of where these 0.7 points are placed.
How investors should build it in: four practical points
When the geography of labor supply is written into a business plan, there are broadly four variables to move. In practice all four are better treated not as “how to avoid a disadvantage” but as design questions about how to open up room for the plan to work in a thin area.
1. Slack in the opening schedule
At 2.30x nationally, the openings ratio for service and waiting staff is 1.4 points off its peak, so the recruiting environment itself is better than it was a few years ago. In Quadrant D and Quadrant B prefectures, however, a phased ramp starting six to nine months out carries a higher probability of hitting the fill rate than a single hiring push three months before opening. Carrying pre-opening payroll in the plan avoids having to revise the first-year OCC target down.
2. Whether staff housing belongs in the base plan
Where the walk-in working population numbers in the thousands, widening the commutable area is itself a recruiting measure. Dormitories and staff housing are heavy as Capex, but lifting the fill rate by 10 points restores 6-7% of GOP, as Tables 5 and 6 show. That is a GOP difference of ¥19.1 million a year in Case A and ¥19.6 million in Case B — a figure that can sit in the numerator of a payback calculation when deciding whether to build.
3. Put the labor catchment into operator selection criteria
An operator already running several properties in the same area has a track record in redeploying staff, sharing dormitories and providing living support. In Quadrant B and D prefectures, ranking a hiring track record in that specific labor catchment above brand strength does more for the first-year fill rate. The operator’s capacity on the visa channel — its relationship with registered support organizations, how it runs living orientation — can be checked from the same angle.
4. Vary the level of labor-saving Capex by quadrant
Labor-saving investment is better framed not as “replacing people with machines because we cannot hire” but as a decision to buy out staffing-fill-rate risk with Capex. In Table 5, the gap between an 80% and a 100% fill rate is ¥38.2 million of GOP a year. Within the present value of that figure, weighting labor-saving investment more heavily at a Quadrant D site is a rational call. In Quadrants A and C, by contrast, the same money tends to return more if allocated to service quality or guestroom specification.
One point on the visa channel deserves attention on an investment time horizon. Against the accommodation sector’s 14,800-person intake target, residents numbered 2,207 in the end-March 2026 preliminary release, a fill rate of 14.9%. Were that target reached, apportioning it across the 1,324,155 rooms of stock used here would put national density at 11.18 per 1,000 rooms — 7.5 times today’s 1.49. Even Gunma, the densest prefecture at 6.16, sits at barely half that level. Today’s geography is a way station, and for an investment decision spanning three to five years of operation, not treating current density as a fixed value matters.
Summary
Specified Skilled Worker residents in the accommodation sector numbered 1,968 at end-December 2025, roughly 2.9x higher than a year earlier. Ranked by raw count, however, the list only reveals the ordering of market size and is of no use for an investment decision. Restated per 1,000 rooms, the ranking reshuffles: from Gunma at 6.16 to Tokyo at 0.39 is 15.8x, and 41x once Aomori is included. The prefectures at the top are those with onsen ryokan serving dinner and breakfast — business-model mix showing through directly.
Overlay the domestic labor market indicator and the two supply channels turn out to work broadly in opposite directions. Prefectures with large room stock have low openings ratios (correlation −0.49) and, at the same time, thin visa-channel density. Judging hireability from either alone therefore misreads it. Of the four quadrants cut at the medians, the 11 prefectures (150,908 rooms) where both the visa channel and the domestic market are still ahead of them are where designed countermeasures do the most work.
And the value of those countermeasures can be put in figures. A 10-point drop in the staffing fill rate erodes GOP by 6-7%, a 20-point drop by 12-14%, and moves GOP yield by roughly 0.7 points. That is on par with a 10% move in construction cost, and deserves the same weight in a business plan as the precision of the construction estimate. Where labor supply is thick, operations are easier to assemble; where it is thin, staff housing, labor-saving investment and operator selection open up room for the plan to work. Geography is not a constraint — it is a variable to be built into the plan.
Note on the estimates: Tables 4-6 and the sensitivity chart are simplified model estimates built from published statistics and practitioner benchmarks. Required headcount varies widely with business model, service level and the scope of outsourcing, and an actual investment decision requires a detailed, property-specific feasibility study. The payroll rate is held at a single fixed value across all cases in order to isolate how volume bites, and does not reflect prevailing regional wages.
Related reading
- Japan Hotels: 1,968 Skilled Foreign Workers, 1.55 per 1,000 Rooms
- Japan Ends the ¥1.06M Wage Threshold Oct 2026: Hotel Shift Design
- Face Recognition Check-In: Survival Strategy for Mid-Size Business Hotels (80 vs 150 Room GOP Simulation)
References and Sources
■ Data sources
Prefecture-level accommodation-sector resident counts are read directly from the source files of Table 5 (by prefecture and municipality, by designated industry field) of the Immigration Services Agency’s “Number of Foreign Residents with Specified Skilled Worker Status” for end-December 2025, end-June 2025 and end-December 2024. The national intake target and fill rate come from the same agency’s “Intake Targets and Resident Numbers for Specified Skilled Worker (i) (as of end-March 2026, preliminary).” The openings-to-applicants ratio comes from the Ministry of Health, Labour and Welfare’s “Employment Referrals for General Workers,” July 2026, long-term time-series Table 21 (by occupation, national) and Table 18 (by prefecture, place-of-work basis). Room stock, estimated OCC and estimated transacted ADR are compiled by MetroEngines Research & Consulting from a population of 21,156 properties / 1,324,155 rooms (N=1,324,155 rooms) with observable online inventory as of July 2026. Employment structure comes from the “Economic Census for Business Activity (2021)” (Ministry of Internal Affairs and Communications / Ministry of Economy, Trade and Industry; boundaries = 2020 Population Census small areas).
■ Modeling assumptions
The business-case estimates in Tables 4-7 are model estimates, not the results of any existing property. Required headcount is converted to FTE by applying a 1.4 factor for two days off per week to practitioner benchmarks of 25-35 minutes per room for housekeeping, 360 productive minutes per day, and a front desk of three on day shift and two to three on night shift. Where the staffing fill rate falls below 100%, an intermediate assumption is used: half the shortfall is covered by agency staff at a 1.5x rate and half is absorbed by restricting the rooms offered for sale. The payroll rate is fixed at ¥4.0 million per FTE per year across all cases, with only the fill rate moving. Other operating expenses are 46.0% of revenue; non-room revenue is 12% of room revenue in Case A and 20% in Case B. Total investment applies a cumulative +15.6% of compounded construction-period inflation (+5.3% for 2026 and +5.0% for 2027 from Turner & Townsend’s published forecast; +4.5% for 2028 as an in-house assumption extending that trend) to unit costs per tsubo based on 2025 actuals in the Ministry of Land, Infrastructure, Transport and Tourism’s “Statistics on Building Construction Starts.”
■ Limitations and caveats
(1) Specified Skilled Worker residents are counted at the location of the accepting organization, which may differ from the actual place of work. Prefecture-level confirmed figures are released twice a year, so the prefecture figures here are as of end-December 2025, the latest available. (2) No occupation-by-prefecture cross-tabulation is published, so the occupational ratio (national) and the prefectural ratio (all occupations) are overlaid as separate axes and cannot be multiplied together for interpretation. (3) Room stock is limited to properties whose online inventory could be observed and excludes ryokan, minshuku and simple lodging houses not listed online; the absolute level of the per-room measure moves by a few percent depending on how the denominator is drawn. (4) Estimated OCC is based on online sales inventory and estimated transacted ADR applies a segment-specific adjustment to listed prices; both differ from a property’s actual occupancy and actual transacted rates. (5) Fill rates of 100% / 90% / 80% are assumed values, not actuals for any particular prefecture or business plan. GOP and yield move with the assumptions applied.
■ Market data
- MetroEngines Research & Consulting — room stock (21,156 properties / 1,324,155 rooms with observable online inventory as of July 2026), estimated OCC, estimated transacted ADR, new supply
■ Government statistics and public data
- Immigration Services Agency, “Publication of the Number of Foreign Residents with Specified Skilled Worker Status” — Table 5 for end-December 2025 (Specified Skilled Worker (i) residents by prefecture and municipality, by designated industry field), and the same table for end-June 2025 and end-December 2024
- Immigration Services Agency, “Intake Targets and Resident Numbers for Specified Skilled Worker (i) (as of end-March 2026, preliminary)”
- Ministry of Health, Labour and Welfare, “Employment Referrals for General Workers,” July 2026 — long-term time-series Table 21 (labor market indicators by occupation) and Table 18 (labor market indicators by prefecture, place-of-work basis)
- Ministry of Internal Affairs and Communications / Ministry of Economy, Trade and Industry, “Economic Census for Business Activity (2021)”; boundaries = 2020 Population Census small areas (e-Stat Statistical GIS)
- Ministry of Land, Infrastructure, Transport and Tourism, “Statistics on Building Construction Starts” — construction cost per unit by structure for hotel use
■ Industry reports and practitioner materials
- Turner & Townsend, “International Construction Market Survey” — construction cost escalation forecast (+5.3% for 2026, +5.0% for 2027; +4.5% for 2028 is an in-house assumption extending that forecast’s trend)
- What “manning” means: hotel staffing plans and shift design in practice (Business Brain) — practitioner benchmarks for housekeeping and productive hours
- Hotel housekeeping amid severe labor shortage: what can be done to improve efficiency and secure staff (Omotenashi HR)