

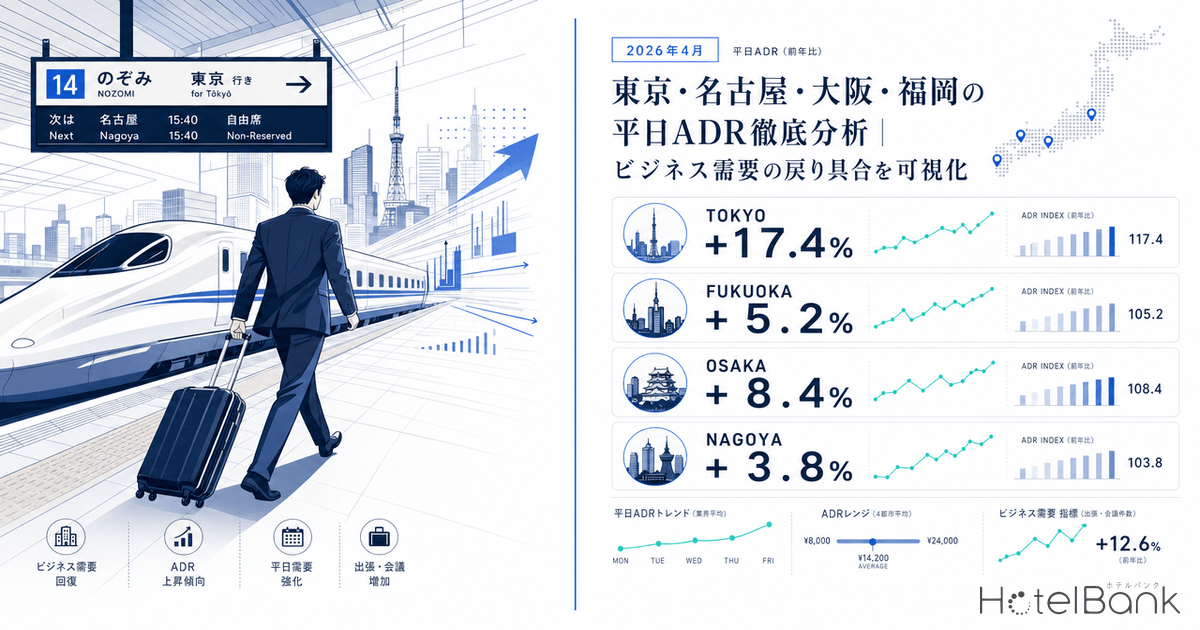

In April 2026, Japan’s domestic hotel market posted significant year-on-year (YoY) gains. Cross-referencing macro indicators from the Japan Tourism Agency’s “Accommodation Travel Statistics Survey” with OTA published-price data aggregated by MetroEngines Research (メトロエンジンリサーチ) reveals that the recovery pace is far from uniform across the four major business cities — Tokyo, Nagoya, Osaka, and Fukuoka. This article quantitatively examines how far business demand has recovered, looking at the weekday (Tue/Wed/Thu) versus weekend ADR gap, hotel-type price movements, and sold-out rate trends.
Metric Definitions Used in This Article
- ADR (Average Daily Rate): Average of published prices on OTAs and similar platforms. Differs from actual booked prices. Per-room rate for double occupancy (tax included), averaged across all plans (room-only through meal-inclusive).
- Sold-out rate: Share of plans on OTAs that had closed bookings as of the survey time. Differs from facility-wide room occupancy rates.
- Data source: MetroEngines Research (メトロエンジンリサーチ)
ADR Levels and YoY Across Four Cities — Tokyo Pulls Away as Regional Cities Trail
First, we compare the all-category average ADR for April 2026 across the four cities. Tokyo posted ¥42,600 (+17.4% YoY), an overwhelming lead, while Fukuoka came in at ¥29,700 (+5.2%), Osaka at ¥26,800 (+8.4%), and Aichi (Nagoya) at ¥28,400 (+3.8%). Tokyo’s growth markedly outpaces the other three cities. While the overall market is trending upward on a mix of inbound and domestic travel demand, the gap between Tokyo and the regional major cities is clearly widening.
Source: MetroEngines Research, compiled by HotelBank Editorial Team (N=Tokyo 1,634 / Nagoya 640 / Osaka 855 / Fukuoka 723)
Aichi’s relatively modest +3.8% growth reflects the structure of business travel demand built around its manufacturing base. The Nagoya region has historically depended more on corporate business demand than on tourism, with a market structure dominated by business hotels operating in a narrow rate band. As a result, the area is less able to capture the inbound-driven rate uplift, and this is reflected in the lower YoY growth.
Daily ADR Trends — Tokyo and Osaka Bottom Out in Late April; Fukuoka Stays Flat
Looking at daily ADR across the four cities over the three-week span from March 30 to April 19, 2026, sharp differences in market temperature emerge. In Tokyo, the Tue/Wed/Thu of the new fiscal year’s opening week (March 31 – April 2) peaked at ¥52,000–¥55,600, easing to ¥46,500–¥48,000 in the second week and ¥43,900–¥46,800 in the third. In contrast, Fukuoka stayed within a narrow weekday range of ¥29,500–¥33,800 throughout the three weeks, exhibiting strikingly low volatility.
Source: MetroEngines Research, compiled by HotelBank Editorial Team (4-city total N=4,090 hotels)
Particularly noteworthy is the timing of the trough. Both Tokyo and Osaka recorded their lowest readings of the period in the third week of April (April 13–19), with Tokyo’s Tue/Wed/Thu average at ¥45,400 and Osaka at ¥26,500 — 10–20% below the fiscal-year-start week. This aligns with the period when the temporary demand spike at the year-end transition fades and the market enters the trough before Golden Week. By contrast, Nagoya and Fukuoka show shallower troughs, indicating relatively stable baseline weekday demand.
Weekly ADR Trends and Trough Identification — Recovery Patterns Over 12 Weeks
Widening the lens to 12 weeks from early February through late April 2026, weekly Tue/Wed/Thu average ADR reveals city-specific recovery patterns. The table below summarizes the trough and peak weeks for weekday ADR over the period.
| City | Trough Week | Trough ADR | Peak Week | Peak ADR | Range |
|---|---|---|---|---|---|
| Tokyo | Wk of 2/10 | ¥35,600 | Wk of 3/31 | ¥54,000 | +51.7% |
| Aichi (Nagoya) | Wk of 2/3 | ¥24,700 | Wk of 3/24 | ¥30,300 | +22.6% |
| Osaka | Wk of 3/3 | ¥23,600 | Wk of 3/31 | ¥32,000 | +35.6% |
| Fukuoka | Wk of 2/3 | ¥28,100 | Wk of 4/21 | ¥33,000 | +17.4% |
Source: MetroEngines Research, compiled by HotelBank Editorial Team (Tue/Wed/Thu only)
Tokyo posted a substantial +51.7% range from trough to peak — a steep climb reflecting the move from the February low season to the fiscal-year-end demand surge in late March. Osaka also swung +35.6%, marking it as a city with intense intra-month dynamics. Fukuoka, by contrast, was contained at +17.4%, confirming a city profile in which demand stays comparatively flat year-round. Fukuoka does not depend on a single peak week; its weekday baseline demand is structurally maintained at a steady level.
Source: MetroEngines Research, compiled by HotelBank Editorial Team (Tue/Wed/Thu average, N=1,600–1,950 hotels per week)
Hotel-Type ADR and Weekday/Weekend Gap — Identifying Categories Supported by Business Demand
Turning to hotel-type analysis, we organize Tue/Wed/Thu average ADR for the most recent two weeks (April 6–19) into three categories — business hotels, city hotels, and resort hotels. The dominant segment varies markedly by city.
| City | Business Hotel | City Hotel | Resort Hotel | Sample Size |
|---|---|---|---|---|
| Tokyo | ¥36,800 | ¥62,000 | ¥54,900 | N=1,081 |
| Aichi (Nagoya) | ¥20,100 | ¥40,300 | ¥36,700 | N=357 |
| Osaka | ¥22,200 | ¥34,000 | ¥29,700 | N=599 |
| Fukuoka | ¥25,300 | ¥39,800 | ¥47,100 | N=385 |
Source: MetroEngines Research, compiled by HotelBank Editorial Team (Tue/Wed/Thu average for 4/6–4/19)
For business hotels, weekday ADR is highest in Tokyo at ¥36,800, followed by Fukuoka ¥25,300, Osaka ¥22,200, and Nagoya ¥20,100. Nagoya stands out: at ¥20,100 it is the lowest of the four cities, but this reflects a market built purely on business travel demand, with little room for the leisure premium.
→ Business Hotel Price Surge — National ADR Analysis and Top 10 Cost-Effective Prefectures
Source: MetroEngines Research, compiled by HotelBank Editorial Team
Next, we calculate the Saturday-to-weekday (Tue/Wed/Thu) ADR multiplier for each category. This multiplier is a simple gauge of the price gap between weekdays and weekends: a low multiplier means “weekdays sell about as well as weekends — strong business demand,” while a high multiplier means “weekdays are cheap and weekends spike — leisure-dependent.”
| City | Business (Multiplier) | City (Multiplier) | Resort (Multiplier) | Demand Profile |
|---|---|---|---|---|
| Tokyo | 1.30x | 1.21x | 1.27x | Business + Inbound |
| Aichi (Nagoya) | 1.24x | 1.24x | 1.29x | Business demand at the core |
| Osaka | 1.34x | 1.29x | 1.76x | Leisure-leaning |
| Fukuoka | 1.49x | 1.31x | 1.31x | Heavily leisure-dependent |
Source: MetroEngines Research, compiled by HotelBank Editorial Team (4/6–4/19, Tue/Wed/Thu average vs. Saturday)
Nagoya’s business hotels show the smallest weekday-weekend gap of the four cities at 1.24x. This means Tue/Wed/Thu business demand is relatively strong against Saturday leisure demand, leaving little need to discount weekday rates. Tokyo business hotels follow at 1.30x, Osaka at 1.34x, with Fukuoka business hotels highest at 1.49x. In Fukuoka, weekend demand concentrates in Hakata and Tenjin areas for tourism and homecoming visits, generating wide weekday-weekend spreads.
Source: MetroEngines Research, compiled by HotelBank Editorial Team
The most striking number is Osaka resort hotels at 1.76x. The leap from a weekday ¥29,700 to a Saturday ¥52,100 indicates near-total dependence on leisure demand. Conversely, Tokyo city hotels at 1.21x post the smallest gap among the 12 city-category combinations, evidencing a robust three-pillar demand structure — business, MICE, and inbound — that fills weekday rooms.
Sold-Out Rate Heatmap — Reading Business Demand Recovery from Weekday Sold-Out Rates
ADR levels alone cannot measure demand strength. Combined with the “sold-out rate” — the share of plans that have closed bookings — we can distinguish markets where demand fills rooms even at low prices from markets where inventory remains despite price cuts. The table below shows weekday (Tue/Wed/Thu) sold-out rates by city and hotel type.
| City | Business | City | Resort |
|---|---|---|---|
| Tokyo | 47.1% | 47.0% | 15.9% |
| Aichi (Nagoya) | 37.1% | 59.5% | 39.3% |
| Osaka | 40.8% | 44.7% | 35.3% |
| Fukuoka | 40.1% | 44.7% | 18.0% |
Source: MetroEngines Research, compiled by HotelBank Editorial Team (Tue/Wed/Thu average sold-out rate for 4/6–4/19)
Nagoya city hotels’ weekday sold-out rate of 59.5% stands out as exceptionally high. Although the absolute count is small at 30 properties, city hotels in Nagoya benefit from the concentration of Chubu-region MICE, exhibitions, and auto-industry business meetings on weekdays, in addition to ordinary business travel. While the small sample size warrants caution, this signals that Nagoya is a city where high weekday sold-out rates clearly indicate a confirmed return of business demand.
Tokyo’s business hotel sold-out rate of 47.1% and city hotel rate of 47.0% are nearly identical, with roughly half of all weekday plans sold out — suggesting that business and inbound demand are filling rooms in a complementary fashion. Meanwhile, the low readings for Tokyo resort hotels (15.9%) and Fukuoka resort hotels (18.0%) confirm that resort properties are leisure-dependent categories with thin weekday demand.
Source: MetroEngines Research, compiled by HotelBank Editorial Team
Consistency with Macro Statistics — What Japan Tourism Agency Data Says About Business Demand
According to the Japan Tourism Agency’s “Accommodation Travel Statistics Survey” (January 2026 first-preliminary report), total guest-nights in January 2026 reached 46.28 million, down 5.3% YoY, with December 2025 also down 4.2% — both falling below the prior-year baseline. Yet the same survey shows occupancy rates remaining at high levels, with growth in foreign-guest nights partially offsetting the decline in Japanese guests.
The upward trend in OTA published-price data confirmed in this article is directionally consistent with these macro statistics. In other words, the classic “supply < demand” condition — in which constrained inventory pushes ADR up — is unfolding particularly in major metropolitan areas led by Tokyo. That said, clear gradations exist by hotel type, day of week, and region, with the demand-structure spectrum stretching from business-led Nagoya city hotels to leisure-led Osaka resorts.
Implications for Revenue Management
The analysis above brings each city’s distinctive demand pattern into focus. The revenue-management implications can be organized as follows.
| City | Demand Structure | Pricing Strategy Direction |
|---|---|---|
| Tokyo | Business + Inbound + MICE | Headroom remains to push weekday rates further. Tue/Wed stay demand is stable. |
| Nagoya | Pure business demand-centric | As city hotels’ weekday sold-out rate shows, Tue/Wed/Thu rate optimization delivers high revenue contribution. |
| Osaka | Leisure-leaning mix | Significant weekend premium. Allow weekday softness while maximizing Saturday yield-up. |
| Fukuoka | Heavily leisure-dependent | Demand stability translates to a smaller variance band. Fixed day-of-week pricing patterns are effective. |
Source: Compiled by HotelBank Editorial Team based on this article’s analysis
From a revenue-management perspective, the key is to accurately understand the demand pattern of the city in which a property is located, and to build a day-of-week and category pricing strategy aligned with it. Even within “business hotels,” the appropriate strategy for the Nagoya type (weekdays also fill) differs significantly from the Fukuoka type (weekend-skewed). Reading macro statistics together with OTA published-price data provides a three-dimensional view of demand across area, category, and day of week.
Conclusion
As of April 2026, OTA published-price data shows that ADR in all four major business cities is up YoY, but the growth rates and demand structures differ markedly. Tokyo runs ahead at +17.4%, while Fukuoka, Osaka, and Nagoya trail in the +3.8% to +8.4% range. Weekly trends show Tokyo and Osaka bottoming out in late April, confirming the trough before Golden Week.
By hotel type, city hotels record the highest ADR and sold-out rates across all four cities, with Nagoya’s 59.5% weekday city-hotel sold-out rate standing out as a clear sign of recovering business demand. The weekday-weekend gap symbolically captures these differences: Nagoya business hotels at 1.24x reflect strong business demand, while Fukuoka business hotels at 1.49x reveal heavy leisure dependence.
Reading demand patterns three-dimensionally — by city, category, and day of week — is essential to optimizing revenue management for any given property. Continuous monitoring that combines OTA published-price data with Japan Tourism Agency macro statistics will be increasingly important to build pricing strategies that respond quickly to market shifts.
Related Articles & References
- Japan Tourism Agency “Accommodation Travel Statistics Survey”
- Accommodation Travel Statistics Survey (December 2025 Second Preliminary / January 2026 First Preliminary)
- JTB “2026 (January–December) Travel Trend Outlook”
Recommended Reading