

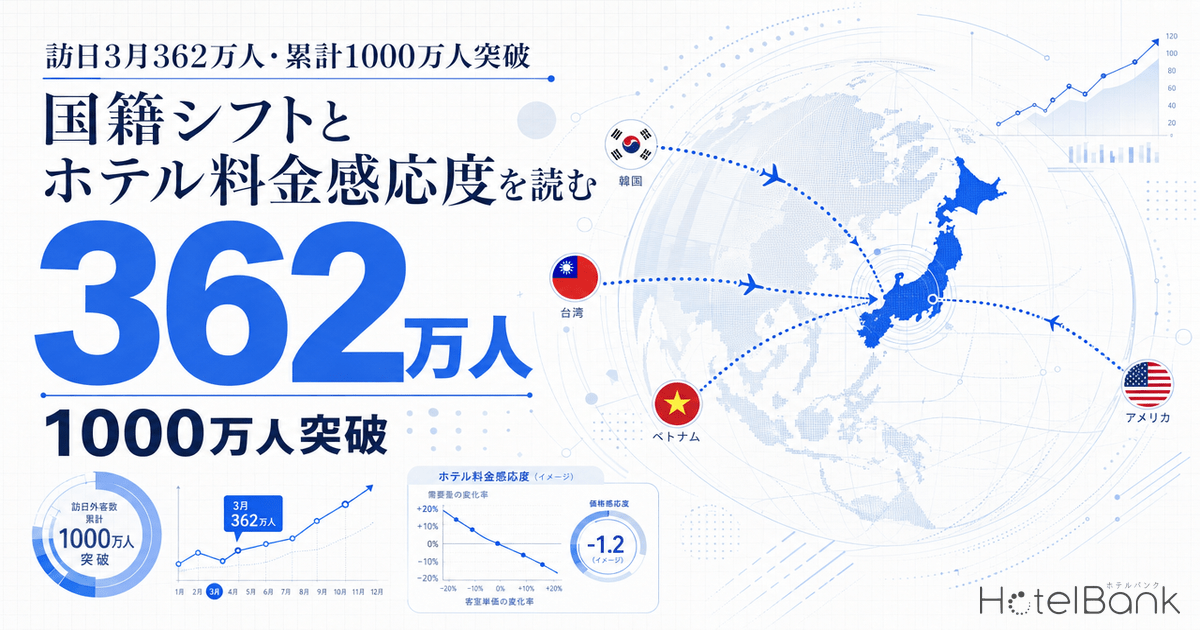
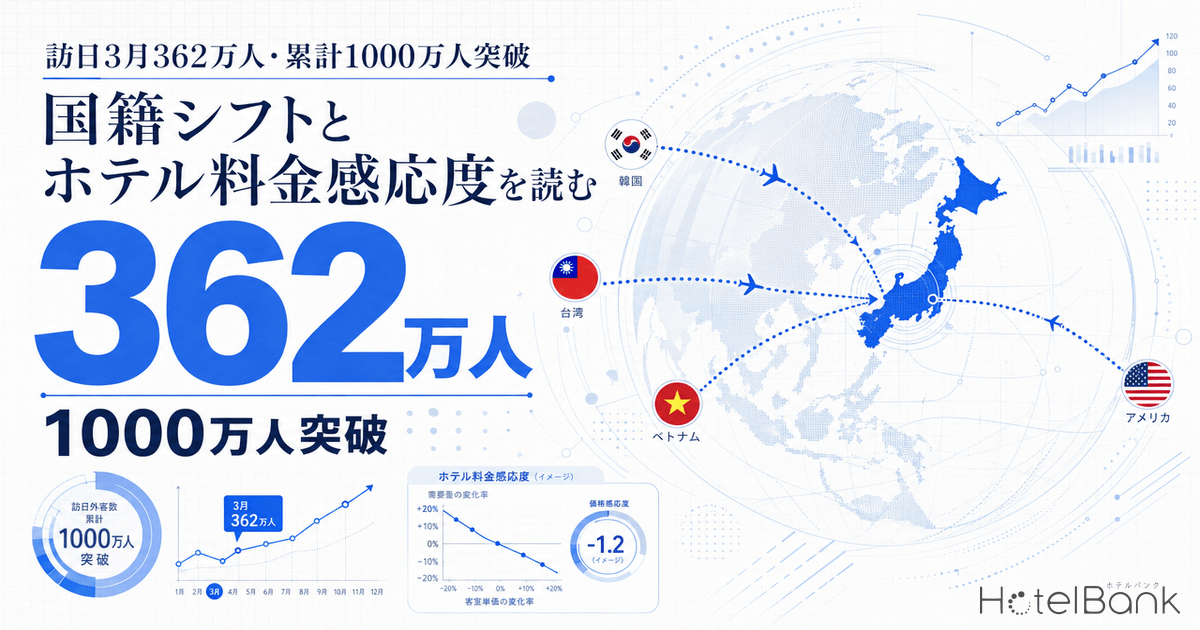
On April 15, 2026, the Japan National Tourism Organization (JNTO) announced that the number of inbound visitors to Japan in March reached 3,618,900 (+3.5% YoY), setting a new all-time high for the month of March. The cumulative total for January to March was 10,683,500 (+1.4% YoY), exceeding 10 million in the first three months for the second consecutive year. On the surface, the inbound market appears to be growing steadily, but breaking down the figures by nationality reveals a dramatic structural shift. Visitors from Mainland China dropped by 55.9% YoY—almost halving—while Korea (+15.0%), Taiwan (+24.9%), the United States (+9.7%), and most European and Southeast Asian countries posted double-digit growth. In this article, we examine how this nationality shift impacted ADR in areas with high Chinese visitor ratios such as Kyoto, Osaka, and Hokkaido, drawing on both publicly listed pricing data from MetroEngines Research and monthly REIT operating performance.
*The ADR figures in this article are averages of publicly listed prices on OTAs and other platforms, which differ from actual transaction prices. Prices are per room for double occupancy, tax included, expressed as YoY (year-on-year) change.
Metric Definitions Used in This Article
- ADR (Average Daily Rate): Average of publicly listed sales prices on OTAs and other platforms. Differs from actual transaction prices. Per-room rate for double occupancy, tax included, averaged across all plans (room-only to plans with meals).
- Data Source: MetroEngines Research
Total Up Slightly Despite China Halving — A Dramatic Reorganization of Nationality Shares
Looking at March’s nationality breakdown, the most striking figure is the 292,000 visitors from Mainland China. This represents a sharp 55.9% decline from 661,000 in the same month last year, causing China to fall to third place behind Korea (796,000, +15.0%) and even Taiwan (653,000, +24.9%). The reason inbound totals still managed to post a YoY gain lies in the strong growth of these two neighboring markets, combined with Western markets such as the United States (376,000, +9.7%), the United Kingdom (70,000, +20.7%), and Germany (59,000, +21.7%), as well as emerging Southeast Asian markets including Vietnam (+43.5%), Malaysia (+44.2%), and Indonesia (+36.6%)—all of which more than offset the Chinese decline.
JNTO cites the Chinese government’s travel advisory regarding Japan and reductions in flight services as factors behind the China slowdown. Meanwhile, Korea and Taiwan benefited from expanded LCC routes and the weak yen, while Western markets saw strong long-haul demand timed for the cherry blossom season. As a result, the March market has clearly shifted from “volume concentrated in China” to a “multi-polar distribution” model.
Source: JNTO “Visitor Arrivals to Japan (March 2026 Estimate)” — compiled by HotelBank Editorial Team
What is particularly noteworthy is the speed of share reorganization. As of March 2025, China was the largest market at approximately 18.9% of total inbound visitors, but by March 2026 this had fallen to just 8.1%. In its place, Korea expanded its share from 19.8% to 22.0%, Taiwan from 15.0% to 18.1%, and the U.S. from 9.8% to 10.4%, with the top three markets now accounting for 50.5% of the total. As China’s presence recedes significantly, Western and Southeast Asian markets have steadily regained share, and the “China dependence” model is rapidly becoming a thing of the past.
YoY Performance by Major Market — China Stands Alone in Decline
Plotting YoY changes by country reveals just how anomalous China’s -55.9% decline truly is. All other major markets posted double-digit gains, led by Vietnam at +43.5% and Malaysia at +44.2%. Growth in European markets was particularly record-setting: the UK +20.7%, Germany +21.7%, Canada +17.4%, and Australia +14.3%—all setting new monthly records.
Source: JNTO “Visitor Arrivals to Japan (March 2026 Estimate)” — compiled by HotelBank Editorial Team
In other words, the inbound market has entered a polarized phase in which “only China is in an exceptional slowdown trend, while all other markets are actually accelerating.” Total numbers may have only edged up slightly in March, but structurally a healthy multi-polar shift is underway, with most markets growing while China alone declines. The question is whether hotels can adapt their pricing strategies to this structural change quickly enough.
Kyoto, Osaka, Hokkaido — How Did ADR Move in High-China-Ratio Areas?
The three areas where the impact of declining Chinese visitors was most concerning were Kyoto, Osaka, and Hokkaido. These regions have traditionally hosted high ratios of group and individual travelers from Mainland China, and their room rates rose significantly from 2024 to 2025 alongside the Chinese visitor recovery. We examined how ADR in these areas moved following the March halving of Chinese visitors, using publicly listed pricing data from MetroEngines Research.
| Area | March 2025 ADR | March 2026 ADR | YoY | Sample |
|---|---|---|---|---|
| Kyoto | ¥39,200 | ¥46,500 | +18.6% | N=5,976 |
| Tokyo | ¥33,100 | ¥36,800 | +11.1% | 1,652 properties |
| Osaka | ¥22,700 | ¥24,900 | +9.5% | 872 properties |
| Okinawa | ¥24,800 | ¥26,900 | +8.5% | 1,710 properties |
| Hokkaido | ¥27,600 | ¥29,700 | +7.5% | 1,490 properties |
| Fukuoka | ¥28,500 | ¥29,300 | +2.7% | 716 properties |
Source: MetroEngines Research, compiled by HotelBank Editorial Team
The conclusion is clear: despite the decline in Chinese visitors, March ADR in Kyoto, Osaka, and Hokkaido all posted YoY gains. Kyoto’s +18.6% is especially striking—high-rate demand from Western, Taiwanese, and Korean visitors not only completely offset the China slowdown but actually pushed prices higher. Osaka grew +9.5%, closing in on Tokyo’s +11.1% growth, while Hokkaido’s +7.5% was the smallest gain among the six areas, but the fact that it remained positive is noteworthy.
However, while Kyoto’s strength contrasts with Hokkaido’s deceleration, the underlying structures differ. March in Hokkaido is traditionally a transition into the off-season as the winter ski demand peak passes, and pricing pressure has been observed in tourist destinations such as Asahikawa, Hakodate, and Noboribetsu—areas with higher-than-average Chinese visitor ratios. Kyoto, on the other hand, has many Chinese FIT (free independent travelers) year-round, but Western cherry blossom season demand more than compensates for the China slowdown.
12-Month ADR Trends — The Trajectories of Kyoto, Osaka, and Hokkaido
Single-month numbers alone make it difficult to see structural shifts. By aligning 12 months of YoY trends, the trajectory of each area becomes clearer. Kyoto has consistently maintained double-digit growth in the +13% to +19% range since September 2025, reflecting structural rate increases driven by the weak yen and the capture of Western FIT demand. Osaka dipped into negative territory in November–December 2025 due to the rebound from the Osaka-Kansai Expo, but has since recovered to the +4% to +9% range. Hokkaido surged to +15%–+21% during the November 2025–January 2026 ski season, but decelerated sharply to +7.5% in March.
Source: MetroEngines Research, compiled by HotelBank Editorial Team
Hokkaido’s March deceleration is a textbook example of how a high Chinese visitor ratio can have a negative impact. In other words, even as the absolute numbers of Western, Taiwanese, and Korean visitors increased, they may not have fully replaced the Chinese demand that supported Hokkaido in March. By contrast, Kyoto and Osaka have a thicker layer of demand from non-Chinese markets, suggesting greater resilience to multi-polar market shifts.
Note on data switching: This article uses both OTA publicly listed pricing data (sales-price basis) and REIT monthly operating data (transaction-price basis). Because there are structural level differences between the two, please focus on YoY change rates rather than direct comparisons of absolute values.
REIT Performance Confirms the Reality — The Nationality Shift Is Actually a Tailwind
In addition to macro pricing data, it is essential to verify market conditions on an actual lodging performance basis. The March monthly operating figures disclosed by Japan Hotel REIT Investment Corporation (8985) and Invincible Investment Corporation (8963) provide a real-world view from the ground.
| REIT | OCC | YoY | ADR | YoY | RevPAR | YoY |
|---|---|---|---|---|---|---|
| JHR (8985) | 85.1% | +3.1pt | ¥20,800 | +5.0% | ¥17,700 | +9.0% |
| Invincible (8963) | 87.6% | +2.8pt | ¥14,500 | +6.0% | ¥12,700 | +9.0% |
Source: REIT monthly operating data, compiled by HotelBank Editorial Team
Both REITs posted YoY gains across all three key indicators—occupancy, ADR, and RevPAR. RevPAR growth was particularly robust at +9.0% for both, with no evidence that the China decline has eroded REIT portfolio earnings overall. On the contrary, occupancy rose by 2.8 to 3.1 points, indicating an ideal mix in which empty rooms are being filled while rates are also being maintained or increased.
What the REITs’ March performance suggests is that Korean, Taiwanese, and Western visitors have likely replaced the lost Chinese demand both in volume and quality. Invincible holds many business hotels and suburban resorts among its 104 properties, while JHR is centered on city hotels—yet both secured positive growth, signaling structural soundness across the broader market. Note that among the seven major hotel REITs (Ichigo Hotel REIT (3463), Invincible Investment Corporation (8963), Japan Hotel & Residential Investment Corporation (3472), Japan Hotel REIT Investment Corporation (8985), Hoshino Resorts REIT (3287), Mori Trust Hotel REIT (8961), and Kasumigaseki Hotel REIT (401A)), only JHR and Invincible have disclosed March results so far; data from the other five will not be available until late April or later.
Price Sensitivity of Substitute Markets — Westerners Pay More, Koreans/Taiwanese Bring Volume
So, what is the price sensitivity profile of the major markets that are now generating substitute demand? Combining JTA/JNTO past surveys and industry data, the broad structure is roughly as follows. Western visitors (U.S., U.K., Germany, France) spend approximately 1.5 to 2 times more per night than the average Chinese visitor and tend to stay longer. Kyoto’s standout +18.6% growth is precisely driven by this Western segment pushing ADR upward.
Meanwhile, Korea, Taiwan, Hong Kong, and other neighboring East Asian markets show explosive volume growth, but stays are short—2 to 3 nights—and per-customer spending tends to cluster in the mid-range. The 796,000 Korean and 653,000 Taiwanese visitors in March were about 2.7 times the Chinese figure, but their spillover into lodging revenue is not necessarily equivalent. Particularly in mid-range areas like Osaka and Hokkaido, the inflow of Korean and Taiwanese visitors has a strong effect on raising occupancy, but a limited effect on substantially pushing ADR higher.
Given this structure, the optimal pricing strategy differs by area. High-rate areas like Kyoto and Tokyo should design high-value-added plans for Western FIT and grow ADR. Mid-range areas like Osaka, Hokkaido, and Fukuoka should pursue strategies that capture Korean and Taiwanese visitors to lift occupancy, while indirectly boosting ADR through multi-night discounts and ancillary services that encourage stays of three nights or more.
Forward Data Signals the Outlook for April and Beyond
MetroEngines Research’s publicly listed pricing data also captures ADR trends for booking periods after March. April YoY ADR for the six major areas is positive across the board: Kyoto +18.6%, Osaka +8.4%, Tokyo +17.4%, Hokkaido +11.2%, Okinawa +7.0%, and Fukuoka +5.2%. Looking further out, May shows Kyoto +20.4%, Osaka +12.5%, and Hokkaido +13.1%, while June shows Kyoto +16.4%, Osaka +18.4%, and Hokkaido +11.9%—suggesting price growth continues even after the cherry blossom season.
Source: MetroEngines Research, compiled by HotelBank Editorial Team
Of particular note is that Hokkaido reaccelerates to the +11% range from April onward. This suggests that bookings for Western and Southeast Asian visitors are accumulating ahead of the early-summer hiking and nature tourism season. Hokkaido temporarily decelerated in March due to the China slowdown, but its demand structure appears to be reshuffling and returning to a recovery trajectory in April–June. Osaka, meanwhile, accelerates sharply to +12.5% in May and +18.4% in June, fully exiting the rebound phase from the Kansai Expo.
Summary — The End of the “China Concentration” Model and Adaptation to Multi-Polarity
JNTO’s March 2026 announcement, on the surface, is dominated by upbeat headlines such as “10 million cumulative visitors” and “all-time high.” But the underlying composition has shifted dramatically. Chinese visitors halved, while Korean, Taiwanese, American, European, and Southeast Asian markets filled the gap, ushering in a multi-polar distributed market. Crucially, despite this structural shift, ADR in high-China-ratio areas like Kyoto, Osaka, and Hokkaido all posted YoY gains, and REIT monthly performance also registered positive growth across occupancy, ADR, and RevPAR.
This is a highly positive sign for the hotel industry. The conventional belief that “you can’t make the numbers without Chinese visitors” is, by the data, now a thing of the past. That said, the speed at which the dependence structure is being rewritten varies by area. Kyoto and Tokyo, with their thick layer of high-rate Western FIT demand, have adapted quickly. Osaka and Fukuoka have substituted mid-range demand with Korean and Taiwanese visitors. Hokkaido was hit hardest by the China slowdown in March, but booking data suggests it is on a recovery trajectory from April onward.
What hotel operators must now do is regularly monitor the nationality mix of their room inventory and optimize pricing plans for each segment—Western, East Asian, and Southeast Asian. Rather than waiting for the Chinese market to return, strengthening the capture of currently growing markets will be the key to RevPAR growth in the second half of 2026.
Note on future-date ADR: The ADR figures in this article are averages of publicly listed sales prices on OTAs at the time of survey, and will fluctuate as check-in dates approach. Note that prices currently set high may decline due to last-minute reductions.