

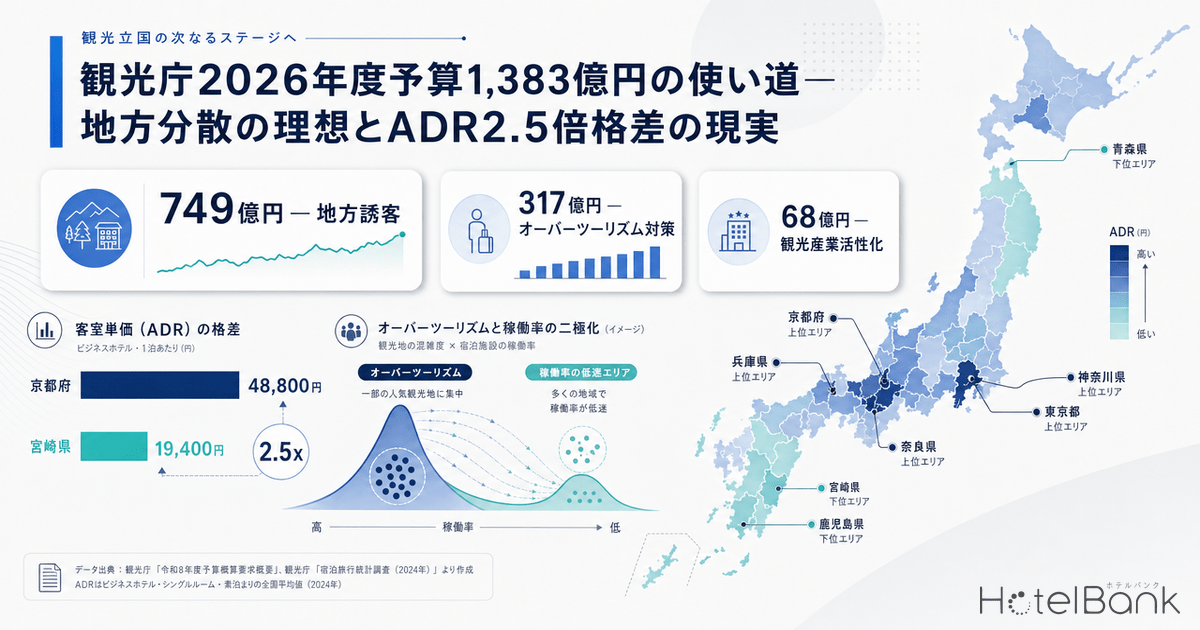
The Japan Tourism Agency’s (JTA) FY2026 budget has ballooned to ¥138.345 billion — 2.4 times the previous year. The funding source is the International Tourist Tax (departure tax), which will be raised from ¥1,000 to ¥3,000 starting July 2026, generating an estimated ¥150 billion in annual tax revenue. The headline keywords are “overtourism countermeasures” and “demand dispersion through regional tourism promotion.” In this article, we use accommodation pricing data from MetroEngines Research to visualize the ADR gap across Japan’s 47 prefectures and examine the on-the-ground reality of regional dispersion — which is far from as easy as it sounds.
Metric Definitions Used in This Article
- ADR (Average Daily Rate): Average of publicly listed prices on OTAs and other channels. Differs from actual transaction prices. Per-room rate (tax included) for 2 guests/1 room, averaged across all plan types (room-only through plans with meals).
- Data Source: MetroEngines Research
Dissecting the Three Pillars of the ¥138.3 Billion Budget
The JTA’s FY2026 budget, approved by Cabinet on December 26, 2025, totals ¥138.345 billion — approximately 2.4 times the previous year’s ¥57.929 billion. Backed by the tripling of the departure tax, this is the largest budget since the JTA’s founding. The budget is allocated across three pillars.
The first pillar, “Inbound Reception and Quality of Resident Life,” receives ¥31.707 billion (2.57x YoY). This includes ¥10 billion (8.34x YoY) for overtourism countermeasures. The second pillar, “Demand Dispersion through Regional Tourism Promotion,” receives ¥74.909 billion (2.33x YoY) — including ¥22.388 billion for cultural resource utilization, ¥17.811 billion for national park environmental development, and ¥14.883 billion for strengthening regional transportation networks. The third pillar, “Tourism Industry Revitalization,” is relatively small at ¥6.856 billion (2.21x YoY). A newly added outbound tourism initiative (¥17.490 billion) is also notable.
Source: JTA “FY2026 Budget Decision Outline,” compiled by HotelBank Editorial Team
Looking at the budget allocation, it is clear that the JTA positions “regional tourism promotion” as its top priority. The ¥74.9 billion for regional promotion is more than twice the size of the first pillar. However, the question that must be asked is whether this enormous budget will produce effective demand dispersion, or whether it will end up — as so often before — as mere infrastructure spending. To answer this, we must first confront the current state of regional disparity.
47-Prefecture ADR Gap — A 2.5x Spread Between Kyoto and Miyazaki
Aggregating MetroEngines Research data for March 2026 across all 47 prefectures, the top ADR was Kyoto (京都府) at ¥48,800, while the bottom was Miyazaki (宮崎県) at ¥19,400 — a gap of 2.52 times. These figures starkly illustrate the geographical concentration of “value” and “demand” as a tourist destination.
Source: MetroEngines Research, compiled by HotelBank Editorial Team (March 2026, N=47 prefectures)
The top 5 are Kyoto ¥48,800, Kanagawa (神奈川県) ¥47,200, Nara (奈良県) ¥45,400, Tokyo (東京都) ¥39,200, and Hyogo (兵庫県) ¥38,900. Notably, Nara recorded a +31.8% YoY increase and Kanagawa +29.4% — substantial gains. The reason: these prefectures are rapidly attracting attention as alternatives to avoid the crowds of Kyoto and Tokyo. We can see a structure where inbound visitors are spilling out from Kyoto proper to Kamakura, Hakone, and Nara, pushing prices upward.
On the other hand, the bottom 10 are dominated by Kyushu, Shikoku, and Tohoku prefectures. Miyazaki (+1.0% YoY), Kagoshima (鹿児島県, +0.4%), Aomori (青森県, +2.7%) — these regions not only have low ADR levels but also extremely sluggish growth rates. In other words, the “wave of inbound demand” has not yet sufficiently reached these areas. The “demand dispersion” that the JTA aims to achieve with ¥74.9 billion is precisely about changing this structure.
Temperature Gap Across the 8 Regional Blocks
Because prefecture-level data contains too much noise, we aggregated into 8 regional blocks for the big picture. Kinki (¥37,000) and Kanto (¥34,500) form a clear top tier, while Hokkaido/Tohoku (¥26,300) and Kyushu (¥26,800) sit at the bottom. YoY growth shows a similarly clear divide: Kinki +12.1% and Kanto +13.1% versus Kyushu +3.8% and Shikoku +7.2%.
Source: MetroEngines Research, compiled by HotelBank Editorial Team (March 2026, simple averages of prefectures within each block)
Kyushu’s +3.8% is the lowest growth rate of any region nationwide. Fukuoka +4.0%, Oita +3.6%, Kagoshima +0.4%, Miyazaki +1.0% — prices have barely budged. Can the JTA, by spending ¥74.9 billion, attract demand here? The budget items — ¥14.8 billion for regional transportation networks, ¥17.8 billion for national park development — are listed, but the extent to which they actually translate into higher accommodation rates remains unknown. That said, signs are emerging that regional ADR is gradually being lifted by shifts in the inbound visitor mix, as we analyzed in detail in May 2026 Inbound Booking Trends: Western and Southeast Asian Visitors Drive Regional ADR Recovery.
¥150 Billion Departure Tax vs. ¥10 Billion for Overtourism — A Mismatch
Here we must point out a distortion in the budget structure. The departure tax hike will swell tax revenue to roughly ¥150 billion annually, yet only ¥10 billion is directly allocated to overtourism countermeasures. For sites where actual harm is occurring — Kyoto, Kamakura, Fuji-Kawaguchiko — only about 7% of the budget is being directed to them.
Kyoto’s situation tells the story. In 2024, Kyoto City recorded an all-time high of 56.06 million tourists and 8.21 million foreign overnight guests. In November 2025, foreign overnight stays at major hotels remained robust at +8.5% YoY, while Japanese overnight stays plummeted by –15.3%. This phenomenon — known as “Japanese flight from Kyoto” — is the side effect of soaring prices and overcrowding. Kyoto’s ADR for March 2026 was ¥48,800, +15.7% YoY, the highest in the nation.
| Budget Item | FY2026 | YoY | Main Programs |
|---|---|---|---|
| Overtourism Countermeasures | ¥10.0B | 8.34x | Crowd mitigation, reservation systems, park & ride |
| Cultural Resource Utilization | ¥22.39B | — | Core of regional tourism promotion |
| National Park Environmental Development | ¥17.81B | — | Adventure travel / ecotourism |
| Regional Transportation Network | ¥14.88B | — | Secondary transportation infrastructure |
| Outbound Promotion (New) | ¥17.49B | New | Safety for Japanese travelers abroad |
| Local Railway Tourism Resources (New) | ¥4.60B | New | Revitalization along regional rail lines |
| Sustainable Tourism Destination Building | ¥1.88B | 2.21x | Eco / sustainable tourism promotion |
| Total | ¥138.3B | 2.4x | Departure tax revenue ¥150B |
Source: JTA “FY2026 Budget Decision Outline” and various press materials, compiled by HotelBank Editorial Team
The structure, then, is this: roughly ¥150 billion in revenue extracted via the departure tax hike is being directed not to combating crowding in Kyoto, Kamakura, and Fuji-Kawaguchiko, but predominantly toward regional tourism promotion (¥74.9 billion). The funders and beneficiaries are misaligned. While this is a strategic choice, it cannot escape the risk of creating a gap with the perceived burden on the front lines.
Kyoto’s Price Acceleration Continues Unabated
Looking at Kyoto’s ADR trend, the severity of the situation comes into sharper focus. The YoY growth rate, which stood at around +3.3% in May 2025, accelerated sharply from autumn onward — November 2025 +14.1%, December +19.1%, January 2026 +19.0% — with double-digit gains becoming the norm. Despite the urgent need for crowd mitigation, the price climb shows no sign of stopping.
Source: MetroEngines Research, compiled by HotelBank Editorial Team (Kyoto monthly ADR YoY)
From FY2027, Kyoto City is considering a dual-pricing scheme for city bus fares: ¥200 for residents and ¥350–400 for non-residents. This is demand suppression via the price mechanism — a frontline response on a different axis from the JTA’s budget. While the JTA’s ¥10 billion is geared toward institutional design and information dissemination, local governments are forced to construct their own collection and distribution schemes. We examined the price reaction one month after Kyoto’s newly implemented accommodation tax in One Month After Kyoto’s New Accommodation Tax: Kyoto ADR +18.6% YoY, Price Tier Shifts Upmarket.
Do REIT Results Reflect the Potential of “Dispersion Destinations”?
Another indicator of whether regional dispersion is functioning is the operating performance of REITs. Hoshino Resorts REIT (星野リゾート・リート, ticker 3287), which operates many regional ryokans, posted February 2026 results of 76.5% occupancy (+1.9 pt YoY), ADR ¥20,800 (+8.6% YoY), and RevPAR ¥15,900 (+10.5% YoY). These are portfolio-wide figures.
Japan Hotel REIT (ジャパン・ホテル・リート, ticker 8985), which centers on urban hotels, posted March 2026 results of 85.1% occupancy (+3.1 pt YoY), ADR ¥20,800 (+5.0% YoY), and RevPAR ¥17,700 (+9.0% YoY). Comparing the two, the more regionally resort-oriented Hoshino Resorts REIT (+10.5% RevPAR growth) is outpacing the urban-focused Japan Hotel REIT (+9.0%). This can be read as a positive signal that regional demand still has room to grow.
Source: Hoshino Resorts REIT and Japan Hotel REIT monthly operating results, compiled by HotelBank Editorial Team
However, one caveat: REIT operators hold only carefully selected locations and do not represent a sample of regional hotels nationwide. Many of Hoshino Resorts REIT’s properties are facilities that already enjoy well-developed marketing for affluent domestic and international guests. What the JTA targets as “dispersion destinations” is a far broader universe of regional small- and medium-scale facilities. The real focus is how much of the ¥138.3 billion will translate into earnings power for ¥20,000-tier facilities in Kyushu and Tohoku. We also analyzed how a specific mega-event affects REIT operations in Impact of Osaka Expo on Hotel ADR — Verified with REIT and OTA Data.
Four Recommendations to Truly Realize the Value of ¥138.3 Billion
The data in this article surfaces structural challenges in the JTA’s FY2026 budget. First, the gap between the top three (Kyoto, Kanagawa, Nara) and the bottom group (Miyazaki, Kagoshima) remains at 2.5x. Second, the Kyushu block’s overall YoY growth stalls at +3.8%, leaving little hope for natural demand dispersion. Third, of the ¥150 billion departure tax revenue, only ¥10 billion goes directly to mitigating actual harm in affected areas.
Based on these findings, our editorial team offers the following four recommendations:
- Tie regional tourism promotion budget KPIs directly to ADR and accommodation rates: Introduce evaluation by regional hotel ADR growth, not by facility counts or visitor numbers.
- Reconsider additional allocation for the ¥10 billion overtourism budget: Provide legal support for the three frontline sites — Kyoto, Kamakura, Fuji-Kawaguchiko — to introduce their own dual-pricing or entry-fee schemes.
- Concentrated investment in Kyushu and Tohoku: Apply weighted budget allocation to Kyushu (+3.8% YoY) and Hokkaido/Tohoku (+9.9%). Wide-area DMO-style consolidated support is effective.
- Mandatory results reporting to departure tax payers: For inbound visitors and Japanese outbound travelers paying the ¥3,000 tax, publish a dashboard visualizing how the tax revenue is used and what results it produces.
Conclusion: The True Value of ¥138.3 Billion Will Be Tested in 2027
The JTA’s FY2026 ¥138.3 billion budget is an “experiment” in tourism administration backed by abundant departure tax revenue. Whether the ¥74.9 billion regional tourism promotion truly works will be plainly visible in the prefecture-level ADR data for March 2027. Will the 2.5x gap between Kyoto and Miyazaki narrow, or will Kyoto’s runaway acceleration continue? It is no exaggeration to say that the achievability of the Tourism Nation Promotion Basic Plan’s 2030 targets — 60 million inbound visitors and ¥15 trillion in consumption — hinges on the success or failure of this demand dispersion experiment.
HotelBank will continue to track the JTA’s budget execution and accommodation pricing trends across all 47 prefectures. We aim to verify the progress of regional dispersion each quarter of FY2026 and contribute to the visibility of policy effects.
Related Reading
- May 2026 Inbound Booking Trends: Western and Southeast Asian Visitors Drive Regional ADR Recovery
- Hyatt Centric Sapporo Opens — Foreign Brands Expand into Hokkaido and Their ADR Implications
- Rainy-Season-Free Hokkaido in June: How Will Hotel Prices Move? 6-City ADR Comparison 2026
- JTA January 2026 Flash Report Deep Dive: Tokyo’s 50%+ Foreign Guest Ratio Becomes Entrenched as Domestic Demand Thins
- Examining the Impact of Kyoto’s Accommodation Tax Reform — Daily Tracking of Sub-¥10,000 Hotel ADR
- One Month After Kyoto’s New Accommodation Tax: Kyoto ADR +18.6% YoY, Price Tier Shifts Upmarket
- Impact of Osaka Expo on Hotel ADR — Verified with REIT and OTA Data
- Government Travel Allowance Regulations vs. Actual ADR — Visualizing the 47-Prefecture Gap (2026 Latest)