

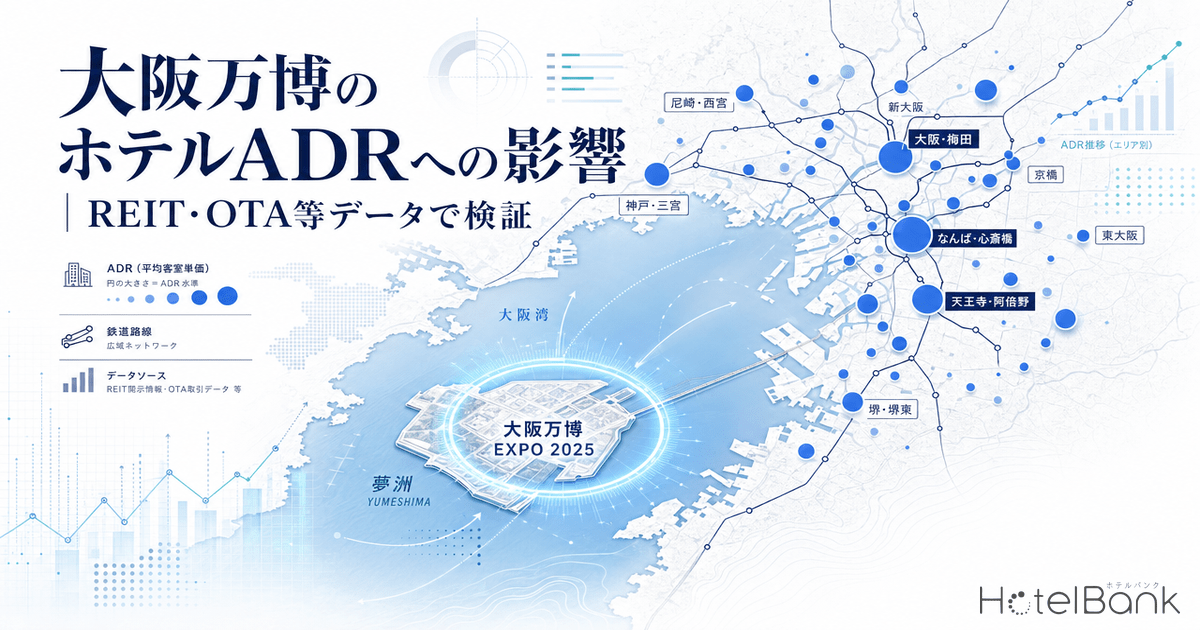

The Osaka-Kansai Expo (EXPO 2025), held from April 13 to October 13, 2025, recorded approximately 28.2 million visitors. As a result, the Kansai region’s hotel market experienced a sharp surge in lodging demand. However, six months after the closing ceremony, as of April 2026, ADR (Average Daily Rate) in Kansai is now showing notable year-on-year declines.
So, does this decline mean a “deteriorating market”? Or is it merely a “normalization from abnormally high levels” caused by the special factor of the Expo? In this article, we answer this question using monthly operational data from seven listed hotel REITs and OTA-published price data from approximately 2,600 hotels in the Kansai region. We also discuss how hotel operators and investors should interpret YoY (year-on-year) figures heading into the second half of 2026.
Data Used in the Analysis
This analysis combines two types of data with different characteristics to enable a multifaceted examination.
| Data Source | Content | Coverage | Characteristics |
|---|---|---|---|
| Hotel REIT Monthly Operational Data |
Monthly per-property ADR, occupancy rate, and RevPAR published by 7 REITs: Ichigo Hotel REIT, Invincible, Japan Hotel & Residential, Japan Hotel REIT, Hoshino Resorts REIT, Mori Trust REIT, and Kasumigaseki Hotel REIT | Kansai: 19 properties Tokyo: 15-18 properties |
Based on actual lodging results. Accurately reflects market reality |
| OTA Published Price Data |
Listed prices and inventory status (per room for 2 people, average across all plans including room-only and meal-included; surveyed by MetroEngines Inc.) | Kansai: N=2,473-2,684 Tokyo: N=1,232-1,312 |
Wide-ranging data including non-REIT properties. Captures overall market trends |
1. Kansai ADR: Only 2025 Recorded an Outlier Spike
First, let’s look at a graph overlaying the monthly ADR of Kansai REIT properties by year. It is immediately clear that April-October 2025 (the Expo year) deviates significantly from 2024 and 2026.
Source: Compiled by MetroEngines from each REIT’s monthly operational data (N=Kansai 19 properties, Tokyo 15-18 properties)
Specifically, during the Expo period, 2025 exceeded 2024 by +20-43% in nearly every month. May was particularly strong at +42.6% and September at +37.7%. Meanwhile, ADR in January-February 2026 has returned to roughly the same level as 2024, clearly demonstrating that the Expo’s boost was temporary.
This extreme ADR rise can be attributed to Expo visitors spreading lodging demand throughout the Kansai region, combined with the high level of attention during the event period stimulating business and MICE demand.
2. Tokyo ADR: Year-on-Year Differences Are Limited
Next, we examine Tokyo as a control group. As shown in the graph below, year-on-year ADR differences in Tokyo are far smaller than those in Kansai.
Source: Compiled by MetroEngines from each REIT’s monthly operational data
While Tokyo did show modest growth from 2024 to 2025, each year follows a stable seasonal pattern. Notably, the sharp spike observed in Kansai during April-October 2025 is not seen in Tokyo. From this, we can conclude that the abnormal rise in Kansai in 2025 was not a nationwide trend but rather an effect specific to the Expo.
3. Quantifying Expo “Excess Growth”: Kansai Outpaces Tokyo by +22 Points
So, just how large was the Expo’s boost effect? Here, we use Tokyo’s ADR growth rate as a “baseline assuming no Expo” and calculate the difference from Kansai’s growth rate as the “Expo excess effect.”
Source: Compiled by MetroEngines from each REIT’s monthly operational data
The result: during the 7-month Expo period, Kansai recorded ADR growth that exceeded Tokyo by an average of +21.7 points. By month, May (+31 points) and September (+30 points) were particularly large. The former is likely due to overlap with Golden Week, while the latter benefited from synergy with the autumn travel season.
Note that Tokyo’s ADR growth rate was +8.9%, attributable to nationwide macro factors such as inbound recovery and increased domestic travel demand. Even after subtracting this, the fact that Kansai still exceeds Tokyo by more than 20 points vividly illustrates how powerful the Expo’s lodging demand creation was.
4. Impact on Occupancy: An Unusual Environment Where Rooms Fill Even at Higher Prices
The Expo’s effect was not limited to ADR. Comparing year-on-year occupancy trends reveals further interesting findings.
Source: Compiled by MetroEngines from each REIT’s monthly operational data
Kansai in 2025 recorded an average occupancy rate of 87.9% during the Expo period. This is 7.1 points above the 80.8% recorded in the same period of 2024. Generally, when hotels raise ADR, occupancy tends to decline. However, during the Expo period, an ideal supply-demand environment was established for hotel operators, where “rooms fill up even when prices are raised.” This serves as evidence that the Expo brought genuine demand growth, not merely price increases.
5. RevPAR: Synergy of ADR and Occupancy Reaches Up to +62%
Looking at RevPAR (ADR x Occupancy), which most accurately represents hotel earning power, the Expo effect stands out even more.
Source: Compiled by MetroEngines from each REIT’s monthly operational data
As a result of rising ADR combined with improved occupancy, May 2025 RevPAR grew by +56% year-on-year, while September reached an astonishing +62%. In other words, the Expo lifted hotel operators’ revenue by 1.5-1.6x. Understanding the magnitude of this impact is essential for properly evaluating the “rebound” in 2026 discussed below.
6. Post-Expo: Effect Disappears in Just Two Months
The Expo closed on October 13, 2025. How did the Kansai hotel market evolve after that? The graph and table below show the trajectory of YoY ADR before and after the closing.
Source: Compiled by MetroEngines from each REIT’s monthly operational data
| Period | Kansai ADR YoY | Status |
|---|---|---|
| October 2025 (final Expo month) | +28.5% | Special demand persists |
| November 2025 | +6.0% | Rapid deceleration |
| December 2025 | -0.2% | Effect nearly disappears |
| January 2026 | -3.6% | Turns negative |
| February 2026 | -10.3% | Decline accelerates |
Source: Compiled by MetroEngines from each REIT’s monthly operational data
Thus, in just two months after the closing, the Expo’s ADR boost effect had completely disappeared. December’s YoY became nearly flat, and entering 2026, it turned negative. However, what is important is that, as shown in the year-by-year comparison above, ADR remains in positive territory compared to the same month in 2024. Interpreting this as “worse than before the Expo” does not match what the data actually shows.
7. OTA Price Data Confirms the April-July 2026 Picture
Note on Data Switch: The analysis from here onward is based on listed prices (displayed prices) published on OTAs and other sources. The REIT monthly data discussed in earlier sections is ADR based on actual lodging results (transaction prices), and there is a structural level difference between the two. Since OTA listed prices generally tend to be higher than REIT transaction ADR, please focus on YoY (year-on-year) change rates rather than direct comparisons of absolute values.
The analysis up to this point has been based on REIT monthly data (through February 2026). What about the latest situation from April 2026 onward? Here, we examine OTA listed price data from approximately 2,600 hotels in the Kansai region.
Source: Compiled by MetroEngines from OTA published data (N=Kansai 2,473-2,684, Tokyo 1,232-1,312 hotels)
| Month | Kansai ’25 | Kansai ’26 | Kansai YoY | Tokyo YoY | Difference |
|---|---|---|---|---|---|
| April | ¥46,509 | ¥38,361 | -17.5% | +4.1% | -21.7pt |
| May | ¥41,405 | ¥44,591 | +7.7% | +13.7% | -6.0pt |
| June | ¥39,461 | ¥34,579 | -12.4% | +0.0% | -12.4pt |
| July | ¥41,754 | ¥36,527 | -12.5% | +2.9% | -15.4pt |
Source: Compiled by MetroEngines from OTA published data (N=Kansai 2,473-2,684, Tokyo 1,232-1,312 hotels)
The picture is clear in the OTA data as well. April 2026 in Kansai shows -17.5% YoY, while Tokyo maintains a steady +4.1%. The difference between the two is -21.7 points, which almost perfectly matches the Expo excess effect (+21.7pt) calculated from the REIT analysis. In other words, the structure where the boost added by the Expo in 2025 directly appears as a YoY decline in 2026 is corroborated by both REIT and OTA data.
8. Demand Recovery as Seen from OTA Inventory Sell-Through Rates
Beyond pricing, let’s also confirm the actual state of demand from inventory absorption. The chart below compares OTA inventory sell-through rates (sold-out plan ratio) between Kansai and Tokyo.
Source: Compiled by MetroEngines from OTA published data (N=Kansai 2,473-2,684, Tokyo 1,232-1,312 hotels)
As of April 2026, Tokyo’s inventory sell-through rate stands at a high 86.3%. In contrast, Kansai is at 66.8%, with a gap of about 17 points. This trend continues from May onward, with Kansai expected to remain 7-17 points below Tokyo.
However, this number should not be hastily interpreted as “Kansai demand is weak.” This is because during the Expo period, Kansai had abnormally high occupancy exceeding 90%. The current 60-70% range should be viewed as a process of returning to normal levels.
9. Implications for the Second Half of 2026: How to Read the “Expo Loss”
Based on the above analysis, it is almost certain that Kansai hotels will show difficult year-on-year numbers from April 2026 onward. This is because the comparison base, April-October 2025, was abnormally inflated by Expo special demand.
However, as this article has consistently shown, the main cause of this decline is the rebound from Expo special demand, not a deterioration in hotel fundamentals or structural market deterioration. For Kansai hotel operators and investors to properly evaluate 2026 performance, the following three perspectives are important.
Three Perspectives for Performance Evaluation
| Perspective | Approach | Criterion |
|---|---|---|
| 2-Year Comparison (vs. same month 2024) |
Captures “fundamentals-based” growth rate that completely excludes Expo influence | If +5-10% vs. 2024, this represents a healthy growth path supported by inbound recovery |
| Relative Comparison with Tokyo |
Excludes nationwide macro trends (FX, inbound, domestic travel demand) to measure Kansai-specific recovery | If Kansai’s YoY decline lags Tokyo by more than 20pt, the difference can reasonably be interpreted as Expo rebound |
| Underlying Strength of Occupancy | While ADR mechanically declines due to Expo rebound, occupancy trends are the indicator that reflects true demand | If occupancy can be maintained in the high 80% range, RevPAR-based earning power remains healthy |
Monthly “Expo Handicap” Quick Reference
Finally, we have organized as a quick reference table the magnitude of the “apparent downward bias” in YoY for each month of 2026. Hotel operators and investors are encouraged to use this when evaluating monthly results.
| Month | 2025 Expo Excess Effect | Estimated Impact on 2026 YoY |
|---|---|---|
| April | +15pt | YoY appears ~-15pt overstated |
| May | +31pt | YoY appears ~-31pt overstated |
| June | +27pt | YoY appears ~-27pt overstated |
| July | +24pt | YoY appears ~-24pt overstated |
| August | +20pt | YoY appears ~-20pt overstated |
| September | +30pt | YoY appears ~-30pt overstated |
| October | +10pt | YoY appears ~-10pt overstated |
Source: Compiled by MetroEngines from each REIT’s monthly operational data
The Osaka-Kansai Expo brought a temporary but extremely large benefit to the Kansai hotel market. Because that impact was so large, the post-closing “rebound” is also large. 2026 will be a year in which how to face this “Expo loss” determines whether the Kansai hotel market is properly evaluated. Rather than being pessimistic by looking only at the surface of the numbers, reading the actual situation from the multiple perspectives presented in this article is important for both business decisions and investment decisions.
Furthermore, the Overnight Travel Statistics Survey published by the Japan Tourism Agency also reports that the number of foreign overnight stays in the Kansai region reached an all-time high in 2025, corroborating the inbound demand boost during the Expo period from official statistics.
Data Sources
– Hotel REIT monthly operational data: 7 REITs – Ichigo Hotel REIT (3463), Invincible Investment (8963), Japan Hotel & Residential (3472), Japan Hotel REIT (8985), Hoshino Resorts REIT (3287), Mori Trust REIT (8961), and Kasumigaseki Hotel REIT (401A). Aggregated per-property data covering 19 Kansai properties and 15-18 Tokyo properties
– OTA published price data: Kansai N=2,473-2,684 hotels, Tokyo N=1,232-1,312 hotels (surveyed by MetroEngines Inc.)
Analysis: MetroEngines Inc., Data Analytics Department