

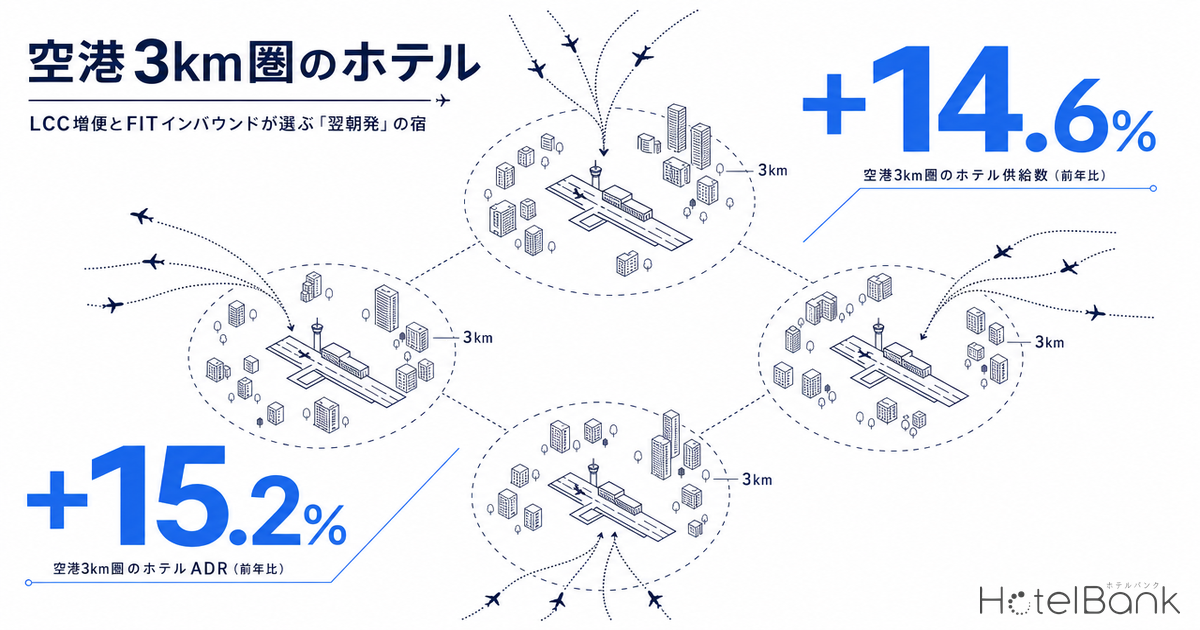
The 2026 summer schedule brought a wave of new LCC international routes and increased frequencies at four airports — Fukuoka, Kansai, Naha, and Chubu Centrair. Taiwan recorded 643,500 visitors to Japan in April 2026 alone (an all-time monthly high), Korea logged 878,600 (also a monthly record), and each of the ASEAN countries updated their own single-month highs. FIT (individual) travelers on short flights who prioritize airport access are the clearest signal for hotels near these airports. This article extracts 148 hotels totaling 14,827 rooms within a 3km radius of each airport (10km for KIX and NGO, which are island-type airports) and reads the picture along four axes: (1) monthly ADR trends 2024–26, (2) mid-July sell-through progress, (3) “airport access” review-mention rankings, and (4) the uneven distribution of multilingual hospitality and non-Japanese review share.
Metric Definitions Used in This Article
- ADR (Average Daily Rate): The average of published selling prices on OTAs. This differs from actual transaction prices (published ADR tends to run 25–30% higher than transacted ADR). Room rate for double occupancy (tax included), averaged across all plans (from room-only through meal-inclusive).
- Review mention rate: Number of mentions of each tag ÷ number of reviews analyzed. Tags such as “location_airport” and “staff_english” are proprietary metrics derived from NLP semantic analysis of guest reviews across 79 tags.
- Non-Japanese review share: Share of posts identified as non-Japanese by review language detection. Used as a proxy indicator for inbound demand.
- 3km radius (KIX and NGO only, 10km radius): Since Kansai and Chubu are island-type airports with no hotels within 3km, the extraction extends across the strait to include Izumisano and Tokoname.
- Data source: Compiled from MetroEngines Research and HotelBank Editorial Team
- — 148 hotels with 14,827 rooms cluster in the 3km/10km radius of 4 airports. This visualizes the supply directly exposed to FIT demand driven by expanded LCC international routes.
- — Fukuoka Airport’s 3km-radius ADR has risen the most from 2024 to 2026. Kansai has stayed essentially flat over two years, exposing the limits of the island-airport model.
- — Inventory sell-through for the mid-July “Marine Day” long weekend stands out in Fukuoka. Early sell-out is a proxy for FIT demand intensity.
- — Non-Japanese review share peaks at 53.6% at KIX. Even under the same “airport hotel” label, guest profiles differ sharply among Kansai, Fukuoka, Naha, and Chubu.
- — Taiwan 643,500 and Korea 878,600 visitors (April 2026 single-month record) are reshaping demand structures at airport-adjacent hotels.
Overview of 4 Airports and 148 Hotels — Location Structure Reveals Bifurcation
The analysis covers 148 hotels and 14,827 rooms. Fukuoka Airport’s 3km radius yields 59 hotels (6,773 rooms), Kansai’s 10km radius 38 hotels (2,868 rooms), Naha’s 3km radius 36 hotels (2,790 rooms), and Chubu Centrair’s 10km radius 15 hotels (2,396 rooms). Fukuoka Airport is a rare “downtown-integrated airport,” with its 3km radius already encompassing most of the major hotels around Hakata Station. Kansai and Chubu are offshore airports, so hotels only appear once the extraction widens across the strait to Izumisano and Tokoname — a structurally different situation.
This locational difference shows up as a decisive gap in review mentions of “airport access.” The weighted-average “airport” mention rate for Fukuoka Airport’s 3km radius is only 1.7%, while Kansai posts 45.6%, Chubu Centrair 37.9%, and Naha 11.7%. Fukuoka guests talk about “X minutes from Hakata Station” or “X minutes from Tenjin”; the airport is secondary. In contrast, Kansai and Centrair guests evaluate their stay primarily on “X minutes to the airport shuttle” or “convenient for a morning flight.” Under the same “3km from airport” label, the two carry entirely different demand structures. Adding New Chitose, our analysis of new 2026 routes and regional airport-adjacent hotel ADR organizes the investment opportunities across Kansai, Fukuoka, Naha, New Chitose, and Chubu.
Source: Compiled from MetroEngines Research and HotelBank Editorial Team (N=148 hotels, total reviews 476,889)
Monthly ADR Trends 2024–2026 — Fukuoka Stands Out, Kansai Flat for Two Years
We aggregated monthly ADR for each airport area for 33 months from January 2024 through September 2026. Overlaying years, Fukuoka Airport’s 3km radius rose from an average of ¥22,700 in 2024 to ¥26,200 in 2025 and ¥29,400 for January–June 2026 — roughly 29% over two years. As of May 2026, YoY stood at +18.4%. Kansai’s 10km radius, meanwhile, moved from ¥18,200 in 2024 to ¥18,900 in 2025 and back to ¥18,200 in 2026 — essentially flat, with May single-month YoY at −0.3%. Naha rose 17% over two years, and Chubu 14%.
Behind Fukuoka’s outperformance is the intrinsic strength of downtown demand around Hakata Station and Tenjin. Fukuoka’s unique geography — “downtown is the airport” rather than “airport to downtown” — creates a structure where prices rise even without invoking airport access. Conversely, Kansai’s and Chubu’s “across-the-strait hotel clusters” cater mainly to LCC morning and pre-flight demand, where competition is limited but prices have not risen. LCC guests are highly price-elastic, and hotels appear to have priced accordingly.
Source: Compiled from MetroEngines Research and HotelBank Editorial Team (Y-axis: ¥/room, double occupancy, all-plan average)
Mid-July Sell-Through Progress — Fukuoka Hotels Stand Out on the Marine Day Weekend
We observed check-in inventory for July 18, 2026 (Saturday of the Marine Day long weekend) at the observation point (18-day lead time). Restricting the sample to properties with public inventory of 30% or more of total rooms, the median remaining-room rate at leading Fukuoka Airport 3km-radius properties dropped to 9.7%, with 2 of 4 properties reaching an “early sell-out LT” of 30 days or more. Early sell-out LT means the lead time at which remaining rooms first hit zero. Kansai’s median stood at 43.7%, Naha 43.1%, and Chubu 43.2% — leaving Fukuoka as the only conspicuous outlier for sell-through progress.
Inventory data for August 13 (Obon peak) and August 29 (end of August) are observations at lead times of 30 or more days, and hotels have likely not yet fully released inventory to OTAs, so we cannot at this point conclude these dates are “selling out early.” Even so, extrapolating Fukuoka’s trend, the days around Obon are unlikely to escape similar pressure. FIT travelers on LCC morning-in and evening-out schedules generate pre- and post-peak demand, testing hotels’ inventory strategies.
Source: Compiled from MetroEngines Research and HotelBank Editorial Team (N=4–7 hotels/airport, properties with 30%+ OTA public inventory only, as observed for 2026-07-18 at LT=18)
Top “Airport Access” Mentions — Kansai Airport Washington Dominates
We extracted mentions related to “airport” and “access” from reviews, and filtered to properties with 20+ tag mentions and 200+ analyzed reviews. Top of the list is Hotel Aston Plaza Kansai Airport (125 rooms), across the strait from Kansai International Airport, at 66.8% (223 mentions of 334 reviews). Comfort Hotel Central Japan International Airport (347 rooms, 61.0%, 755/1,238) follows, then Kansai Airport Washington Hotel (504 rooms, 58.7%, 1,815/3,094), and Kanku Izumisano First Hotel (113 rooms, 54.3%).
Notably, of the top 10 properties, 7 are in the Kansai area and 2 in the Chubu area; only Hotel Grandview Okinawa (126 rooms, 41.8%) from Naha makes the ranking. Fukuoka Airport’s 3km radius does not enter the top 50 at all. This shows that the demand segment of “choosing a hotel specifically for its airport proximity” is concentrated in Kansai and Chubu. Even as LCC expansion increases user volume, the supply of hotels “optimized for next-morning departures” that can absorb this demand is limited, and room for price appreciation is structurally still there.
| Rank | Airport | Property | Rooms | Airport distance | Review score | Airport mention rate | Non-JP review share |
|---|---|---|---|---|---|---|---|
| 1 | Kansai | Hotel Aston Plaza Kansai Airport | 125 | 7.4km | 4.21 | 66.8% | 34.1% |
| 2 | Chubu | Comfort Hotel Central Japan International Airport | 347 | 1.3km | 3.51 | 61.0% | 34.0% |
| 3 | Kansai | Kansai Airport Washington Hotel | 504 | 5.9km | 4.22 | 58.7% | 62.0% |
| 4 | Kansai | Kanku Izumisano First Hotel | 113 | 7.4km | 4.20 | 54.3% | 53.4% |
| 5 | Kansai | Bellevue Garden Hotel Kansai Airport | 186 | 7.6km | 4.35 | 45.3% | 35.3% |
| 6 | Chubu | Toyoko Inn Central Japan International Airport No. 1 | 1,001 | 1.3km | 3.98 | 44.3% | 21.0% |
| 7 | Naha | Hotel Grandview Okinawa | 126 | 2.0km | 4.21 | 41.8% | 1.0% |
| 8 | Kansai | Izumisano Center Hotel | 187 | 7.3km | 4.23 | 40.7% | 59.4% |
| 9 | Kansai | Star Gate Hotel Kansai Airport | 358 | 5.8km | 4.18 | 38.3% | 50.5% |
| 10 | Kansai | Hatago Inn Kansai Airport | 100 | 6.0km | 4.43 | 21.1% | 56.0% |
Source: Compiled from MetroEngines Research and HotelBank Editorial Team (aggregated from guest reviews over the past 24 months, 20+ mentions and 200+ analyzed reviews)
Uneven Distribution of Non-Japanese Reviews — Different Guests Behind the Same “Airport Hotel” Label
Looking at non-Japanese review share among the top 10 properties by “airport access” mention rate, Hotel Grandview Okinawa sits at just 1.0% (almost entirely Japanese guests) and Toyoko Inn Central Japan International Airport No. 1 at 21.0% (modest), while Kanku Izumisano First Hotel reaches 53.4%, Hatago Inn Kansai Airport 56.0%, and Kansai Airport Washington Hotel 62.0% — the Kansai across-the-strait cluster has a conspicuously high inbound share. Even under the same “airport proximate” positioning, who actually stays there differs dramatically.
On an airport-weighted average basis, Kansai’s non-Japanese share of 53.6% leads, followed by Fukuoka 49.8%, Naha 26.2%, and Chubu 24.4%. Kansai’s composition is 31.8% English, 11.4% Chinese (Traditional), and 1.1% Korean — functioning strongly as a hub for Western and Taiwanese guests. Fukuoka is Asia-centric with 21.4% English, 14.7% Chinese (Traditional + Simplified), and 8.7% Korean. Naha shows 5.5% Chinese and 13.4% English, reflecting the limited international connectivity of Naha Airport. The LCC-expansion impact must be read on the premise that “which nationality is growing” differs area to area, or pricing strategy will misfire. As analyzed in our follow-up on non-China regional ADR and our JNTO April 2026 3.69 million-visitor analysis, the growth structure of non-China inbound is fanning across regional markets.
Source: Compiled from MetroEngines Research and HotelBank Editorial Team (weighted average of review language detection, N=476,889)
Reading FIT Demand from the Structure — A Proposal
Integrating the four-axis analysis, three coexisting types emerge in the “3km-from-airport” hotel market. Type 1 is Fukuoka’s “downtown-integrated” model, where ADR rises on downtown demand itself without needing to invoke airport access. Type 2 is Kansai’s and Chubu’s “across-the-strait island-airport” model, with high airport-mention rates — especially in Kansai, where Western and Taiwanese guest share stands out — but ADR has yet to move. Type 3 is Naha’s “tourism-origin” model, where Naha Airport’s international routes are limited but downtown tourism demand shapes the evaluative axis for hotels.
Kansai’s across-the-strait cluster has structural potential for price growth. Despite over 50% inbound share and over 40% airport-mention rate — both markers of strong airport FIT demand — ADR has stayed flat from 2024. While demand trends after the Kansai Expo are a concern, FIT growth in Taiwan (+14.6%), Korea (+15.2%), and ASEAN (all-time high) is structural, and there is significant room for measures such as enhanced airport shuttle service, stronger multilingual hospitality, and a two-tier pricing design combining early-bird and last-minute discounts. Fukuoka, with prices already rising, is entering a phase that calls for more granular pricing on visibly peaked days such as the Marine Day long weekend.
Conclusion
Across the 3km radius of Fukuoka, Kansai, Naha, and Chubu Centrair airports (10km for KIX and NGO) — 148 hotels and 14,827 rooms — analyzed on monthly ADR, summer peak inventory progress, and four review axes, we found that entirely different demand structures coexist under the same “3km from airport” label. Fukuoka is downtown-integrated, Kansai and Chubu are across-the-strait island-airport, and Naha is tourism-origin. FIT inflows driven by LCC expansion should manifest as opportunities of different shapes at each airport area. Kansai’s across-the-strait cluster, in particular, receives strong inbound demand while ADR has yet to move — leaving room to reconsider pricing strategy for the second half of the summer schedule.
Note on future-dated ADR and inventory data: The inventory data in this article are observations of OTA public inventory as of June 30, 2026, and will move as check-in dates approach. Determinations for August 13 (lead time 44 days) and beyond are especially sensitive to hotels’ subsequent inventory releases, so please treat current “early sell-out” reads as in-progress booking status rather than definitive.
Related Reading
- Direct Effects of 2026 New Routes on Regional Airport-Adjacent Hotel ADR — Kobe, Sendai, Naha, Chubu
- Did Non-China Inbound Fill the −58% China Gap? — April 2026 Lodging Statistics and Regional ADR Re-examined
- JNTO April 2026: 3.69 Million Visitors, −5.5% — Regional ADR Rises Despite China −56.8%; Nine Markets at All-Time Highs Signal Structural Change in Inbound Demand
References and Sources
■ Data Sources
Primary sources are MetroEngines Research (OTA public price data, N=148 properties / 14,827 rooms, monthly ADR trends 2024–2026, booking curves) and NLP analysis by the HotelBank Editorial Team of 476,889 guest reviews (79-tag semantic analysis and language detection). Demand-side data are supplemented by JNTO monthly visitor estimates and each airport operator’s 2026 summer schedule route information.
■ Assumptions
Hotels are extracted within a 3km radius (FUK, OKA) or 10km radius (KIX, NGO — island-airports, so opposite-shore areas are included). ADR is for double occupancy, tax included, averaged across all plans (from room-only to meal-inclusive). Review mention rate is “tag mentions ÷ analyzed reviews.” Non-Japanese review share is the composition ratio of language-detection results. Mid-July “Marine Day weekend” sell-through progress is used as a proxy for FIT demand intensity.
■ Limitations and Caveats
OTA public ADR is an average of selling prices, and actual transaction ADR tends to run 25–30% lower. Review language detection is based on the OTA display language and does not fully correspond to country of residence. The 10km-radius extraction for KIX and NGO is a correction for their island-airport structure, so direct comparison with the 3km radius requires care. LCC-expansion effects are subject to inbound visa policy, exchange rates, and geopolitical risk.
■ Market Data
- MetroEngines Research — OTA public price data (N=148 properties, 14,827 rooms), monthly ADR trends, booking curve analysis
- HotelBank Editorial Team — NLP analysis of 476,889 guest reviews (79-tag semantic analysis, language detection)
■ Government Statistics and Public Data
- JNTO “Visitor Arrivals to Japan (April 2026 Estimate)”
- JNTO “Visitor Arrivals to Japan (May 2026 Estimate)”
- JNTO “Visitor Arrivals Statistics”
■ Industry Reports and Route Information
- sky-budget “List of New Routes and Increased Frequencies of Japan-Origin International Flights for the 2026 Summer Schedule”
- Aichi Prefecture “2026 Summer Schedule Notice” (Chubu Centrair)
- Fukuoka International Airport Corporation “Medium-Term Business Plan (FY2024–FY2028)”
- Aun Consulting “Annual Trends of Inbound Visitors to Japan in 2025 and 2026 Forecast”