

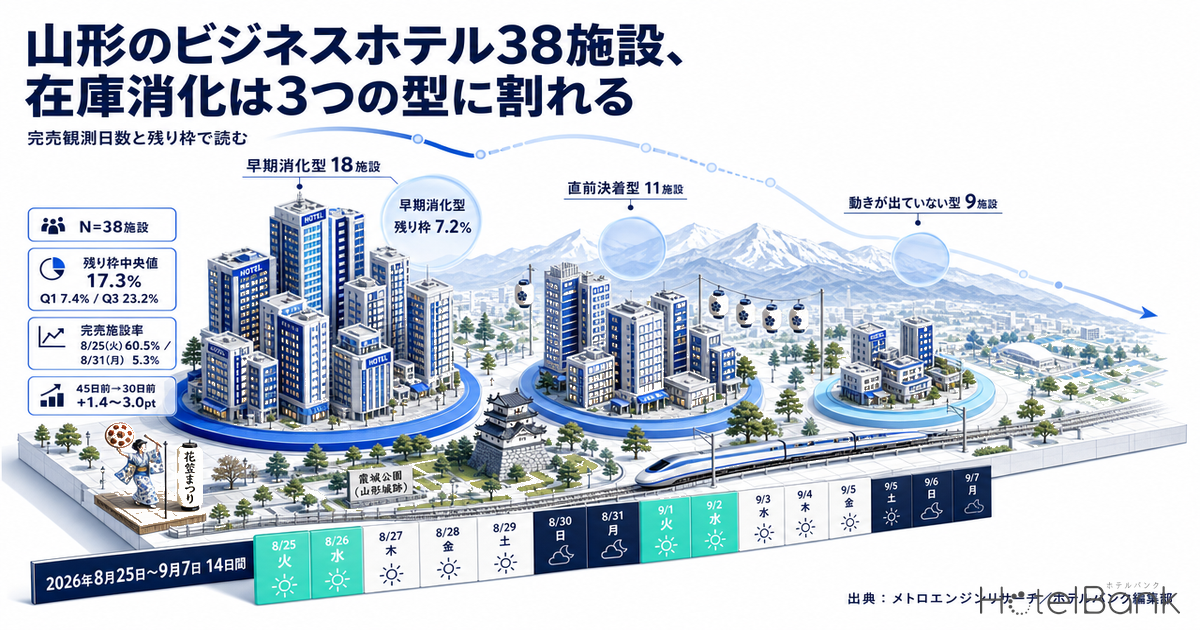
Aggregating inventory absorption at Yamagata Prefecture’s business hotels on a property-by-property basis, across the 14 stay dates from August 25 to September 7, 2026, the 38 properties in scope split cleanly into three types. Eighteen properties are of the “early-absorption type,” where a sell-out was observed on five or more of the 14 days; 11 are of the “late-settling type,” with sell-outs on only one to four days; and nine are of the “no-movement type,” with zero sell-outs observed across all 14 days. The median remaining availability share right now is 17.3%, but by quartile Q1 sits at 7.4% and Q3 at 23.2% — a spread of more than threefold, which shows that a prefecture-average statement like “occupancy is high across the prefecture” barely helps an individual property decide what to do next. Within the same market and the same 14 days, properties that should be pulling their rate-increase decisions forward, properties that should be redrawing the floor on last-minute discounting, and properties whose premise that inventory moves at all has broken down are all sitting side by side.
About the data in this article|Coverage: Yamagata Prefecture business hotels, N=38 properties (properties meeting the observation conditions for listed inventory). The price metric in this article is estimated settled ADR (a settled price level inferred from sales data such as OTAs, approximately tax-exclusive), and occupancy is an estimate based on OTA-listed inventory. Definitions for both appear at the end of this article. Data as of August 25, 2026.
- — The 38 properties split into three types: on a 14-day window, 18 early-absorption properties with sell-outs on five or more days, 11 late-settling properties with one to four days, and nine no-movement properties with zero.
- — The 17.3% median remaining availability share is an average-value trap: Q1 is 7.4% and Q3 is 23.2%, a spread of more than threefold, so comparing yourself with the median does not settle your next move.
- — Sell-out timing is spread almost evenly across four bands: T-31 to T-45 at 30.9%, T-15 to T-30 at 22.8%, T-8 to T-14 at 22.8%, and T-7 or later at 23.5% (n=136 pairs).
- — Pickup from T-45 to T-30 is only 1.4 to 3.0pt: inventory in this market actually starts moving inside T-30. Do not misread a low level at T-30 as weak demand.
- — The troughs are Sunday and Monday: the sold-out property share is 5.3% on Monday, August 31, against 60.5% on Tuesday, August 25. Running a flat policy across the days of the week generates missed upside and fire-sale pricing at the same time.
Narrowing the population — from 157 properties to 38
First, the premises. There are 157 properties classified as business hotels in Yamagata Prefecture. Of those, 59 could be observed continuously for inventory movement across the 14 stay dates in scope. We then excluded properties whose maximum listed inventory during the observation period came to less than 30% of their total room count: including properties that put only a fraction of their rooms on OTAs and similar channels would produce a false picture of a market that “sells out immediately.” The 38 properties that cleared this condition are the subject of the analysis. Together they hold 3,565 rooms, with a median of 92.5 rooms per property.
Looking at these 38 properties as 14 days × 38 properties = 532 “property × stay-date” pairs, a sell-out was observed at least once during the period in 167 pairs (31.4%). Of those, 136 were observed at T-45 or later relative to the stay date, and the analysis from here on covers those 136 pairs.
Three types of inventory absorption — split by sell-out days, remaining availability diverges
Dividing the properties into three groups by how many of the 14 days carried an observed sell-out, the current remaining availability share separates cleanly. The 18 “early-absorption type” properties with sell-outs on five or more days have a median remaining availability share of 7.2%; the 11 “late-settling type” properties with one to four days are at 19.9%; and the nine “no-movement type” properties with zero observed sell-outs are at 19.7%.
What deserves attention is the difference between the latter two groups. Their median remaining availability shares are nearly identical (19.9% versus 19.7%), yet the former reaches the point of selling out on at least a few of the 14 days while the latter never gets there once. The same “20% still open” means something completely different depending on whether the property is capturing the peak demand dates. And while the median room count is 100 rooms for the early-absorption type and 97 for the late-settling type, the no-movement type sits at 42 rooms — skewed toward small properties.
| Type | Properties | Days with observed sell-out (of 14; median) |
Current remaining availability share (median) |
Lead time to first sell-out (median; within T-45) |
Rooms (median) |
|---|---|---|---|---|---|
| Early-absorption type (sell-outs on 5+ days) | 18 | 8 days | 7.2% | T-18 | 100 rooms |
| Late-settling type (sell-outs on 1–4 days) | 11 | 3 days | 19.9% | T-9 | 97 rooms |
| No-movement type (0 sell-out days) | 9 | 0 days | 19.7% | — | 42 rooms |
| Total | 38 | 4 days | 17.3% | T-16.5 | 92.5 rooms |
Coverage: 38 Yamagata Prefecture business hotels; stay dates August 25 – September 7, 2026 / Source: MetroEngines Research; compiled by the HotelBank Editorial Team
Across the whole set, the remaining availability share is scattered from a minimum of 3.6% to a maximum of 61.3%. Thirteen properties have 10% or less remaining, and 12 of those belong to the early-absorption type. At the other end, five properties have 30% or more remaining. Setting your own sales design by looking only at the prefecture-average picture means misjudging which of these two poles you are at. Note also that within the same Yamagata Prefecture, prices move differently by property type, a point organised on a confirmed-value basis in Yamagata ADR Splits by Segment.
Coverage: Yamagata Prefecture business hotels, N=38 properties / Source: MetroEngines Research; compiled by the HotelBank Editorial Team
When do sell-outs happen — 30% land inside the last week before the stay date
For the 136 pairs where a sell-out was observed within T-45, we look at how many days before the stay date the first sell-out was observed. The median was T-16.5, with an interquartile range from T-8.0 to T-33.3. Taking each property’s own median and then the median of those medians gives T-12.5. Note that of the 38 properties, 28 recorded at least one sell-out within T-45; the remaining 10 never reached the sell-out point in observations within T-45 (nine of them had no sell-out observed at any point across the 14 days).
| Timing of the first observed sell-out | Observations (property × stay date) | Share |
|---|---|---|
| T-31 to T-45 | 42 | 30.9% |
| T-15 to T-30 | 31 | 22.8% |
| T-8 to T-14 | 31 | 22.8% |
| T-7 or later | 32 | 23.5% |
| Total | 136 | 100.0% |
Based on observations from T-45 relative to the stay date through the most recent reading / Source: MetroEngines Research; compiled by the HotelBank Editorial Team
That the four bands are almost evenly filled is the defining feature of Yamagata’s business hotel market. It is neither a “fills early” market nor a “last-minute” market — both live inside it. A little over 30% reach their first sell-out point more than a month before the stay date, while nearly a quarter only get there once they are inside the final week. Running the whole market on a single lead-time assumption means leaving money on the table with the former and cutting prices too anxiously with the latter.
The prefecture-wide booking curve — T-45 to T-30 is nearly flat
Against that distribution of individual properties, we look at how the prefecture-wide estimated OCC (based on OTA-listed inventory) has built up from T-45 through the most recent reading, for four stay dates. The observed set covers 48 to 57 properties.
| Stay date | T-45 | T-30 | Most recent | T-45 → most recent |
|---|---|---|---|---|
| Aug 26 (Wed) | 73.4% | 76.4% | 97.0% | +23.6pt |
| Sep 2 (Wed) | 76.6% | 78.2% | 88.6% | +12.0pt |
| Sep 5 (Sat) | 87.2% | 89.6% | 92.6% | +5.4pt |
| Sep 7 (Mon) | 75.2% | 76.6% | 83.1% | +7.9pt |
Estimated OCC (OTA-listed-inventory basis); Yamagata Prefecture business hotels; 48–57 observed properties. Based on observations from T-45 relative to the stay date through the most recent reading / Source: MetroEngines Research; compiled by the HotelBank Editorial Team
What the four dates share is that the build-up over the 15 days from T-45 to T-30 amounts to no more than 1.4 to 3.0pt. August 26 (Wed) went from 73.4% to 76.4%, a gain of 3.0pt; September 5 (Sat) from 87.2% to 89.6%, a gain of 2.4pt. Market-wide inventory only really starts moving once inside T-30 — and from there August 26 added another 20.6pt to reach 97.0% at the most recent reading.
The size of that build-up, however, differs sharply by stay date. Saturday, September 5 was already at 87.2% at T-45, and the pickup from there was only 5.4pt. Wednesday, August 26, by contrast, started low at 73.4% at T-45 and moved 23.6pt. The pattern that “the lower the level at T-45, the larger the late pickup” is the starting point for reading this market’s curve. Where that pickup sits nationally is organised in Booking Curves Across 47 Prefectures, together with a median +4.1pt baseline — a useful yardstick when checking where your own prefecture stands.
Estimated OCC (OTA-listed-inventory basis); Yamagata Prefecture business hotels. Based on observations from T-45 relative to the stay date through the most recent reading / Source: MetroEngines Research; compiled by the HotelBank Editorial Team
By day of week, sell-outs concentrate on Tuesday, Wednesday and Thursday
Lining up, for each of the 14 stay dates, the share of the 38 properties at which a sell-out was observed, the day-of-week shape emerges clearly. In week one it concentrates in the front half — Tuesday (August 25) at 60.5%, Wednesday (the 26th) at 55.3%, Thursday (the 27th) at 44.7% — then falls away sharply in the back half: Friday (the 28th) 18.4%, Sunday (the 30th) 15.8%, Monday (the 31st) 5.3%. Week two follows the same logic, with Saturday (September 5) at 47.4% and Wednesday (the 2nd) at 36.8% running high and Sunday (the 6th) at 10.5% the lowest.
This is consistent with the actuals from the months just passed. Looking at prefecture-wide estimated OCC for business hotels as day-of-week averages, July 2026 (median observed property count of 54) ran high on Thursday at 94.3%, Saturday at 95.4% and Wednesday at 93.8%, and low on Sunday at 85.9% and Monday at 89.0%. June 2026 (56 properties on the same basis) had the same shape, running high on Thursday at 95.1% and Saturday at 97.1% and low on Sunday at 85.5% and Monday at 88.4%. There are two peaks — midweek business demand and Saturday leisure demand — with the troughs falling on Sunday and Monday.
Coverage: Yamagata Prefecture business hotels, N=38 properties; stay dates August 25 – September 7, 2026. The sold-out property share is the share of properties for which no listed inventory can be confirmed on OTAs and similar channels (estimated) / Source: MetroEngines Research; compiled by the HotelBank Editorial Team
The depth of the trough is what matters. On Monday, August 31, only two of the 38 properties (5.3%) had an observed sell-out. Set against 60.5% on the Tuesday of the same week, the inventory situation inside the same property in the same week is completely different. A flat price and inventory rule applied evenly across the days of the week can generate missed upside on Tuesday and fire-sale pricing on Monday at the same time. This shape — thickness from Tuesday to Thursday with troughs on Sunday and Monday — is common across business hotel markets, and the same within-week pattern can be seen in Hokkaido Business Hotels Aren’t Weekend-Led.
For revenue managers running business hotels in Yamagata — implications and an action plan
(1) Start by determining which type your property is. If you reached a sell-out on five or more days across these 14 stay dates you are the early-absorption type; on one to four days, the late-settling type; on none, the no-movement type. The market’s median remaining availability share is 17.3%, with quartiles at Q1 7.4% and Q3 23.2%. Whether your own remaining availability sits on the Q1 side or the Q3 side makes the right move for the next two weeks close to opposite. Looking only at the 17.3% median and concluding “we are in line with the market” is the most dangerous read of all.
(2) If you are the early-absorption type, there may be room to pull rate-increase decisions forward. This group’s median remaining availability share is 7.2% and its median lead time to first sell-out is T-18. That some dates already hit the sell-out point at T-18 suggests the setting for those dates may have been low relative to demand. It is worth reviewing, week by week, whether sell-outs are arriving too early on upcoming stay dates with the same day of week and the same positioning.
(3) The late-settling type has room to redraw the floor on discounting. This group’s median lead time to first sell-out is T-9, with a median remaining availability share of 19.9%. Market-wide, 23.5% of first sell-outs occur at T-7 or later. Having 20% still open a week out is not an unusual state in this market. Cutting in a hurry at T-10 or T-7 means taking the demand that would have arrived afterwards at a discount.
(4) For the no-movement type, question exposure and minimum-stay settings before price. This group is skewed small, with a median of 42 rooms, and shows no sell-out across all 14 days. Yet its median remaining availability share of 19.7% is almost the same as the late-settling type’s, so it is not that inventory is failing to sell at all. The state is one of not reaching the point of selling out on peak demand dates, and lowering price may not get you there. In a market where the day-of-week sold-out property share swings from 5.3% (Monday, August 31) to 60.5% (Tuesday, August 25), checking whether a minimum-stay restriction is in place midweek comes first.
(5) Cut the calendar by day of week. The market’s sold-out property share peaks on Tuesday, Wednesday, Thursday and Saturday and troughs on Sunday and Monday in both weeks, matching the day-of-week shape of estimated OCC in the months just passed (July: peaks at Thursday 94.3% and Saturday 95.4%; troughs at Sunday 85.9% and Monday 89.0%). If you currently run the week on a single rate, simply slicing by day of week narrows down where the missed upside is.
| Time horizon | Lever | Decision trigger | Objective |
|---|---|---|---|
| Today – this week | Count how many of the last 14 stay dates your property reached a sell-out on, and fix which of the three types you are | Sell-outs reached on 5+ days / 1–4 days / zero | Branch every subsequent lever to match the type |
| Today – this week | Re-confirm the floor on last-minute discounting for Sunday and Monday stay dates | Bands where the market’s sold-out property share troughs at 5.3% on Monday and 10.5–15.8% on Sunday | Since the market as a whole is not moving on trough days, judge the return on the discount before widening it |
| Within two weeks | For Tuesday, Wednesday and Thursday stay dates, decide whether to revise price once remaining availability falls below the market’s Q1 level | Your remaining availability is below the market Q1 of 7.4% while the stay date is still more than two weeks away | Prevent missed upside from reaching a sell-out too early |
| Within two weeks | For dates still around 20% open inside T-7, try relaxing the minimum stay before discounting | Given that 23.5% of the market’s first sell-outs occur at T-7 or later, dates sitting near the Q3 of 23.2% at T-7 | Leave room to take late demand without giving up rate |
| Looking to next month | Build a three-checkpoint frame — T-45, T-30 and last-minute — into the sales calendar | On the market curve, pickup from T-45 to T-30 stops at 1.4–3.0pt | Avoid misreading a low level at T-30 as “weak” and treat it as headroom instead |
| Looking to next month | For Saturdays, manage the level reached at T-45 as a leading indicator | September 5 (Sat) was at 87.2% at T-45, and the pickup from there stopped at 5.4pt | On dates with little headroom, lock the rate design in early |
Source: MetroEngines Research; compiled by the HotelBank Editorial Team
None of these guarantees an outcome, and their fit varies with your own booking structure and contract position. In particular, at properties with a high share of corporate contracts, the movement implied by the market’s sold-out property share can diverge from your own inventory absorption — a point worth keeping in mind.
How far can the final level move — three scenarios read through the remaining-inventory absorption rate
Up to here we have looked at a snapshot at the moment of observation. So how far will the build-up go between now and the stay date itself? Rather than imposing a forecast, we apply the swings that actually occurred over stay dates already past. For the 61 stay dates from June 1 to July 31, 2026, we measured the remaining-inventory absorption rate — (estimated OCC one day before the stay date − estimated OCC at the starting point, defined by days remaining) ÷ (100 − estimated OCC at the starting point) — and assigned its quartiles to pessimistic (p25), mid (p50) and optimistic (p75). The days remaining at the starting point are aligned to each target stay date’s most recent observation.
| Stay date | Most recent level (starting point) | Absorption rate, pessimistic (p25) | Absorption rate, mid (p50) | Absorption rate, optimistic (p75) | Landing, pessimistic | Landing, mid | Landing, optimistic |
|---|---|---|---|---|---|---|---|
| Aug 26 (Wed) | 97.0% (T-2) | 12.4% (n=61) | 17.7% | 23.3% | 97.4% | 97.5% | 97.7% |
| Sep 2 (Wed) | 88.6% (T-9) | 33.2% (n=60) | 46.4% | 57.4% | 92.4% | 93.9% | 95.1% |
| Sep 5 (Sat) | 92.6% (T-12) | 41.3% (n=61) | 50.5% | 61.5% | 95.7% | 96.3% | 97.2% |
| Sep 7 (Mon) | 83.1% (T-14) | 38.5% (n=61) | 54.5% | 65.4% | 89.6% | 92.3% | 94.2% |
Source: MetroEngines Research; compiled by the HotelBank Editorial Team
The read is simple: the earlier the starting point, the wider the scenario range. September 7 (Mon) was low at 83.1% at T-14, giving a 4.6pt span from 89.6% pessimistic to 94.2% optimistic. August 26 (Wed), by contrast, had already reached 97.0% two days before the stay, so every scenario falls within 0.7pt. Wide-range dates are the dates where your levers can still move the result; narrow-range dates are the dates where the outcome is already settled. If you are judging the return on last-minute discounting, looking at this span first is the quickest route.
| Most recent level \ absorption rate | Absorption 15% | Absorption 25% | Absorption 35% | Absorption 45% | Absorption 55% |
|---|---|---|---|---|---|
| Most recent 75% | 78.8% | 81.2% | 83.8% | 86.2% | 88.8% |
| Most recent 80% | 83.0% | 85.0% | 87.0% | 89.0% | 91.0% |
| Most recent 85% | 87.2% | 88.8% | 90.2% | 91.8% | 93.2% |
| Most recent 90% | 91.5% | 92.5% | 93.5% | 94.5% | 95.5% |
| Most recent 95% | 95.8% | 96.2% | 96.8% | 97.2% | 97.8% |
Source: MetroEngines Research; compiled by the HotelBank Editorial Team
Seen on two axes, the lower the starting level, the more directly a difference in absorption rate becomes a difference in the landing. On the 75% starting row, absorption of 15% versus 55% splits the landing between 78.8% and 88.8% — a gap of 10.0pt. On the 95% row, the same difference in absorption produces only 95.8% versus 97.8%, a gap of 2.0pt. The more your remaining availability on a given date sits on the Q3 side (around 23.2%), the more you can treat yourself as positioned toward the upper left of this table.
Limits of this estimate|The measured absorption rates are taken from stay dates in June and July, which fall in a demand peak. Early September sits in a demand trough, so it is safer to read the landing scenarios against the pessimistic column. And this is not a forecast — it is only a mapping of what would happen if the swings that have already occurred repeated exactly.
In summary — three yardsticks
Yardstick 1: hold remaining availability as quartiles, not as a median. The median remaining availability share across Yamagata Prefecture’s 38 business hotels is 17.3%, but with Q1 at 7.4% and Q3 at 23.2% the spread is more than threefold. Comparing against the median only tells you whether you are “in line with the market.” Which side of Q1 and Q3 you are on is what branches the lever.
Yardstick 2: determine your type by the number of days you reach a sell-out. The three types — five or more days in a 14-day window (18 properties), one to four days (11), and zero (9) — separate on median remaining availability share at 7.2%, 19.9% and 19.7% respectively. Even with the same remaining availability, a different type changes whether you should be raising rate, halting discounts or revisiting exposure.
Yardstick 3: look at three checkpoints — T-45, T-30 and last-minute. On the market curve, pickup from T-45 to T-30 stops at 1.4–3.0pt, and movement comes inside T-30. A low level at T-30 is not, in itself, abnormal. What you should be judging is not the absolute level at T-30 but whether the pickup from there is tracking the usual shape.
About the data
| Definition of estimated OCC | Occupancy on an OTA-listed-inventory basis = 100 − 100 × rooms still listed on OTAs ÷ total rooms. It is an estimate based on how inventory sold on OTAs is being absorbed, and is defined differently from actual room occupancy (it reads higher). |
| Booking curve | Based on observations from T-45 relative to the stay date through the most recent reading. The checkpoints are three: T-45, T-30 and the most recent observation. |
| Definition of estimated settled ADR | A settled price level (approximately tax-exclusive) inferred from sales data such as OTAs (cheapest-plan level × a property-type coefficient, ensembled across multiple channels). Past months are confirmed values; the current and future months are estimates based on the present sales position. Median error of 6.6% when reconciled against published operating results. Note that because this article deals with the structure of inventory absorption, it does not go into price-level figures. |
| Sold-out property share | The share of properties for which no listed inventory can be confirmed on OTAs and similar channels for the stay date in question (estimated). |
| Breakdown of coverage N= | Distribution of inventory absorption: of Yamagata Prefecture’s 157 business hotels, the 59 whose inventory movement could be observed across the 14 stay dates in scope (August 25 – September 7, 2026), and then the 38 whose maximum listed inventory during the observation period was 30% or more of total rooms (3,565 rooms in total; median room count 92.5). Prefecture-wide booking curve and day-of-week estimated OCC: 48–57 observed properties (median 54 properties in July 2026, 56 in June). |
| Data as of | Data as of August 25, 2026. Sales positions and inventory change daily, so the figures in this article are a snapshot at the time of retrieval. |
Source: MetroEngines Research; compiled by the HotelBank Editorial Team
■ Data sources
Covering Yamagata Prefecture’s business hotels, aggregated from the time series of OTA-listed inventory and prices that we collect. Property-level inventory absorption uses the 14 stay dates from August 25 to September 7, 2026 (532 property × stay-date pairs); the prefecture-wide booking curve runs from T-45 for each stay date through the most recent observation; day-of-week estimated OCC uses daily actuals for June and July 2026. Data as of August 25, 2026.
■ Estimate assumptions
The landing scenarios measure, across the 61 stay dates from June 1 to July 31, 2026 that have already passed, a “remaining-inventory absorption rate = (estimated OCC one day before the stay date − estimated OCC at the starting point defined by days remaining) ÷ (100 − estimated OCC at the starting point),” and assign its quartiles (p25 / p50 / p75) to pessimistic, mid and optimistic. The days remaining at the starting point are aligned to each target stay date’s most recent observation (T-2 n=61 / T-9 n=60 / T-12 n=61 / T-14 n=61). Stay dates with a starting point of 99.5% or above, and observations with an absorption rate below −5%, are excluded as outliers. Landing = most recent level + absorption rate × (100 − most recent level), which by definition cannot exceed 100%.
■ Limitations and caveats
Because the measured absorption rates are taken from stay dates in June and July, which fall in a demand peak, it is safer to read against the pessimistic column when applying them to early September, which falls in a demand trough. And this is not a forecast — it is only a mapping of what would happen if the swings that have already occurred repeated exactly. Estimated OCC is an estimate on an OTA-listed-inventory basis and is defined differently from actual room occupancy (it reads higher). The sold-out property share is the share of properties for which no listed inventory can be confirmed on OTAs and similar channels, and does not include the sales position of direct channels or corporate contracts. The 38 properties analysed are limited to those meeting the observation conditions for listed inventory, and are not representative of all 157 business hotels in Yamagata Prefecture. Because this article deals with the structure of inventory absorption, it does not go into price-level figures.
Related reading
- Yamagata ADR Splits by Segment: Business −4.8% in April, City +12.5%
- Yamagata Hanagasa 2026: Demand Settled 45 Days Out, +9.6pt vs Normal
- Booking Curves Across 47 Prefectures: +4.1pt Median Pickup from T-45
- Okayama Booking Curves: 3 Checkpoints, Aug 8 Late-Surges +11.8pt
- Tokyo Aug 14: 434 Hotels, Front-Loaded 10.8% vs Late-Surge 9.4%
- Hokkaido Business Hotels Aren’t Weekend-Led: Thu 95.4% Ties Sat 95.4%
- Saitama Business Hotels: Sat 77.2% vs Sun 70.1%, Gap Widens to 11pt