

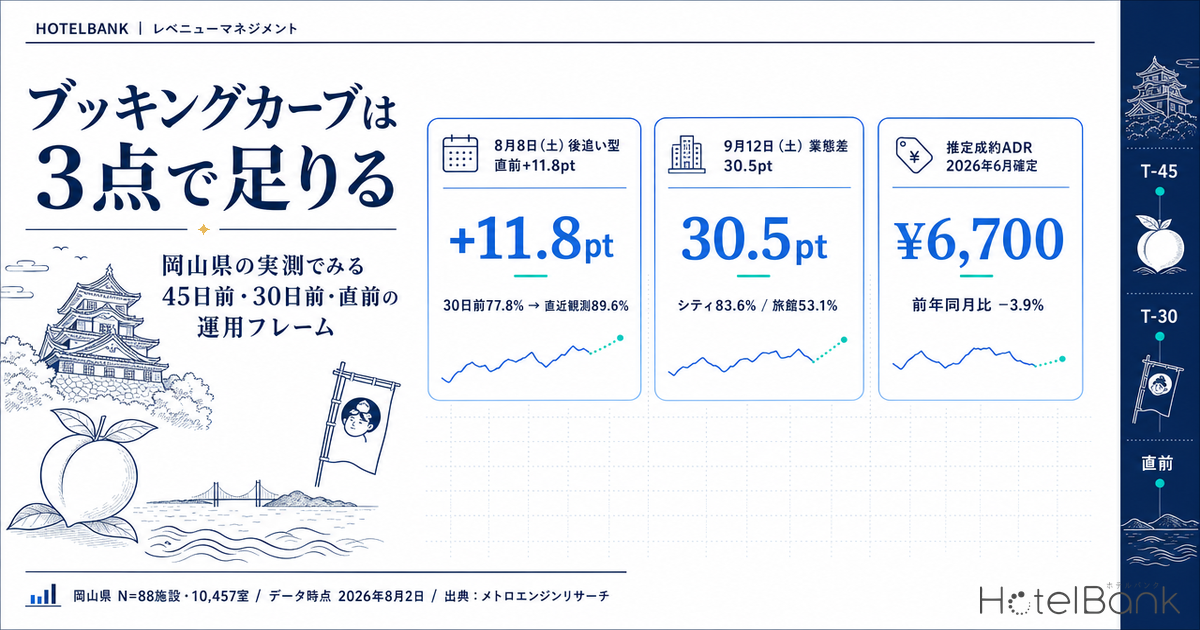
A booking curve is not something to stare at every day. It is something you cut at a fixed number of days remaining and compare. Measured across Okayama business hotels (N=88 properties, 10,457 rooms), estimated OCC for Saturday 8 August 2026 moved from 76.2% at 45 days out to 77.8% at 30 days out — a gain of only +1.6pt — and then stacked up +11.8pt in one push to reach 89.6% at the latest observation (8 days remaining). In the same segment, Saturday 22 August 2026 was already at 85.3% at 45 days out and 91.3% at 30 days out, running high from early on, with only +2.1pt added by the latest observation (22 days remaining). Same hotel type, same day of the week — and completely different curve shapes. This article uses Okayama’s measured figures as a teaching set to lay out how to run a booking curve on just three fixed points: the level at 45 days out, the slope from 45 to 30 days out, and the room left to gain in the final stretch.
Scope: Okayama business hotels N=88 properties (10,457 rooms), city hotels N=16 properties (1,924 rooms), ryokan N=45-46 properties (882-903 rooms). The price metric in this article is estimated settled ADR (a settled price level estimated from OTA and other sales data, tax-exclusive equivalent); occupancy is an estimate based on OTA-listed inventory. Full definitions appear at the end of the article. Data retrieved 2 August 2026 (the latest observation cross-section for booking curves is 31 July 2026).
- — For Okayama business hotels, Saturday 8 August 2026 moved only +1.6pt, from 76.2% at 45 days out to 77.8% at 30 days out, then concentrated +11.8pt into the final two weeks to reach 89.6% at the latest observation — a “late-surge” pattern.
- — Within the same segment, Saturday 22 August 2026 ran 85.3% at 45 days out to 91.3% at 30 days out, stacking up early — a “front-loaded” pattern. The slope across those 15 days from 45 to 30 days out is the first signal that separates the two.
- — At 45 days out for Saturday 12 September 2026, city hotels stood at 83.6%, business hotels at 73.4% and ryokan at 53.1% — a 30.5pt spread. A “healthy level” at 45 days out can only be defined by hotel type.
- — Build thresholds from your own property’s landing level, not from the market average. As a market-side reference line, the July 2026 daily average was 88.5% for business hotels, 85.5% for city hotels and 71.6% for ryokan (Okayama).
- — Keep your price yardstick monthly. Estimated settled ADR for Okayama business hotels was ¥6,700 confirmed for June 2026 (-3.9% YoY), with August and September 2026 currently estimated at ¥10,400 and ¥10,100.
Same Saturday, different shape — three fixed points for Okayama business hotels
First, let us confirm with measured data what it means to compress a booking curve into three points. The chart below overlays estimated OCC (based on OTA-listed inventory) for Okayama business hotels across three Saturdays — 8, 22 and 29 August 2026 — with days remaining until the stay date on the horizontal axis. Observations are limited to the window from 45 days out to the most recent reading.
Source: Compiled by the HotelBank Editorial Team from MetroEngines Research
All three lines rise to the right; on that count they are the same. What matters operationally is where the slope concentrates. For 8 August, the 15 days from 45 days out to 30 days out produced only +1.6pt, and everything after that added +11.8pt. Almost the entire gain is packed into the final two weeks — a “late-surge” pattern. By contrast, 22 August was already high at 85.3% at 45 days out, added +6.0pt from 45 to 30 days out, and then only +2.1pt: it finished stacking early — a “front-loaded” pattern. 29 August ran from 77.7% at 45 days out to 82.0% at 30 days out (+4.3pt), with the latest observation (29 days remaining) at 82.2%, leaving it mid-course with the evidence not yet complete.
| Stay date | 45 days out | 30 days out | Latest observation | 45 to 30 days out | 30 days out to latest |
|---|---|---|---|---|---|
| August 8 (Sat) | 76.2% | 77.8% | 89.6% (8 days left) | +1.6pt | +11.8pt |
| August 14 (Fri) | 71.2% | 73.8% | 81.5% (14 days left) | +2.6pt | +7.7pt |
| August 15 (Sat) | 68.1% | 71.0% | 78.0% (15 days left) | +2.9pt | +7.0pt |
| August 19 (Wed) | 79.6% | 82.1% | 86.7% (19 days left) | +2.5pt | +4.6pt |
| August 22 (Sat) | 85.3% | 91.3% | 93.4% (22 days left) | +6.0pt | +2.1pt |
| August 26 (Wed) | 65.1% | 68.6% | 70.5% (26 days left) | +3.5pt | +1.9pt |
| August 29 (Sat) | 77.7% | 82.0% | 82.2% (29 days left) | +4.3pt | +0.2pt |
| September 5 (Sat) | 69.4% | — | 71.2% (36 days left) | — | — |
| September 12 (Sat) | 73.4% | — | 74.2% (43 days left) | — | — |
Okayama, business hotels, estimated OCC (based on OTA-listed inventory). The base is 87-88 properties in total. Observed properties number 81-85 at the 45-days-out cross-section, 82-87 at the 30-days-out cross-section and 52-83 at the latest observation. For 5 and 12 September the stay date is more than 30 days away, so the 30-days-out cross-section has not yet been reached.
Source: Compiled by the HotelBank Editorial Team from MetroEngines Research
The operational implication of this table is clear. Looking at the level at 45 days out alone does not determine where a date will finally land. 8 August came from an unremarkable 76.2% at 45 days out all the way to 89.6%, while Wednesday 26 August went from 65.1% at 45 days out to 70.5% at the latest observation — only +1.9pt of gain with 26 days still remaining. Two dates that both sat “in the 70s or below at 45 days out” went on to diverge. That is exactly why, on top of the level at 45 days out, you need to watch the slope from 45 to 30 days out. Against +6.0pt for 22 August and +4.3pt for 29 August, 8 August managed +1.6pt and 19 August +2.5pt. That 15-day slope is the first signal separating a date that “settles early” from one that “keeps moving until the last minute.” The shape in which 15 August shows the lowest 45-days-out level among August Saturdays is not unique to Okayama, either: the same three-point cut confirms it in Hokkaido city hotels, where only 15 August trails among August Saturdays.
One caveat on 22 August: at the latest observation (22 days remaining), the share of properties for which no listed inventory can be confirmed is estimated at 50.6% (52 properties observed), and 49.4% at the 30-days-out cross-section (82 properties observed). Because the number of observed properties swings between 52 and 87 depending on the cross-section, this share has to be read together with the thickness of that cross-section. Never resting a conclusion on a figure from a thin cross-section alone is a precondition of running the three-point frame.
The 45-days-out level spans 30pt by hotel type — the same date reads differently
When you share the three-point frame with other properties or other areas, the question that causes the most misunderstanding is “what percentage at 45 days out counts as healthy?” Okayama’s measured figures show that for the same stay date, the level at 45 days out differs completely by hotel type. At 45 days out for Saturday 12 September 2026, estimated OCC was 83.6% for city hotels (16 properties observed / base of 16) against 53.1% for ryokan (45 observed / base of 45) — a gap of 30.5pt. Business hotels sat between them at 73.4% (84 observed / base of 88).
Source: Compiled by the HotelBank Editorial Team from MetroEngines Research
The chart above overlays the curves of the three hotel types using Saturday 15 August 2026 as the example. City hotels went from 76.2% at 45 days out to 78.8% at the latest observation (15 days remaining), a gain of +2.6pt — their shape was essentially set by 45 days out. Business hotels ran from 68.1% to 78.0% (+9.9pt) and ryokan from 55.0% to 66.6% (+11.6pt), stacking up toward the back half. Here sits an obvious fact that is nonetheless easy to miss in day-to-day operations: the meaning of “the level at 45 days out” differs by hotel type. For city hotels, 76.2% at 45 days out means “close to the expected landing,” whereas for ryokan, 55.0% at 45 days out is nothing more than a waypoint on the assumption that more will be stacked from here. The underlying question — whether hotel types that run high at 45 days out have less room left in the final stretch — is tested type by type in Tochigi booking curves by hotel type for August-September 2026.
| Stay date (estimated OCC at 45 days out) | Business hotels | City hotels | Ryokan | Widest gap |
|---|---|---|---|---|
| August 8 (Sat) | 76.2% | 79.3% | 70.8% | 8.5pt |
| August 15 (Sat) | 68.1% | 76.2% | 55.0% | 21.2pt |
| August 22 (Sat) | 85.3% | 85.3% | 60.9% | 24.4pt |
| August 29 (Sat) | 77.7% | 83.4% | 59.8% | 23.6pt |
| September 5 (Sat) | 69.4% | 79.5% | 61.7% | 17.8pt |
| September 12 (Sat) | 73.4% | 83.6% | 53.1% | 30.5pt |
Okayama, estimated OCC at the 45-days-out cross-section (based on OTA-listed inventory). Observed properties: business hotels 81-85 (base of 87-88), city hotels 14-16 (base of 16), ryokan 38-45 (base of 45-46).
Source: Compiled by the HotelBank Editorial Team from MetroEngines Research
Build thresholds from your own track record — landing level, day-of-week shape and monthly ADR
So how do you set the threshold for “at what percentage 45 days out do I act?” Applying the market average directly to your own property does not work. The procedure has three stages: (1) establish the landing level for your property and hotel type from completed-month results; (2) break out the shape by day of the week; and (3) cross-check that level against the monthly estimated settled ADR. Okayama’s completed-month results let us walk through it.
| Hotel type | June 2026 daily average |
July 2026 daily average |
Peak day, July | Trough day, July |
|---|---|---|---|---|
| Business hotels N=83-88 properties | 90.8% | 88.5% | Thursday 92.3% | Sunday 81.2% |
| City hotels N=15-16 properties | 88.9% | 85.5% | Saturday 91.4% | Monday 82.7% |
| Ryokan N=34-46 properties | 78.0% | 71.6% | Saturday 84.2% | Monday 65.7% |
Okayama: within-month daily averages and day-of-week averages of estimated OCC (based on OTA-listed inventory), derived from daily results for completed months. Each month is a separate measured figure.
Source: Compiled by the HotelBank Editorial Team from MetroEngines Research
Use this table as the “yardstick” for the three-point frame. The July 2026 daily average for business hotels was 88.5%, with Thursday highest at 92.3% and Sunday lowest at 81.2%. Once you know the landing level and the day-of-week shape, you can translate the level at 45 days out into “how many more points are needed to land.” Saturday 8 August, cited at the top, was at 76.2% at 45 days out but reached 89.6% at the latest observation (8 days remaining), putting it in a position consistent with the landing-level benchmark. Wednesday 26 August, by contrast, stood at 70.5% at the latest observation (26 days remaining) — still some distance from the Wednesday landing benchmark. Two dates that are both “low at 45 days out” call for different moves once their distance to the landing level differs. As for reading day-of-week shape itself, the Sunday trough and the Thursday peak are the two anchors to fix first.
Here is the practical way to build the threshold. From your property’s past 12 months of results, derive landing occupancy by hotel type, day of the week and month. Next, record where your property stood at 45 days out and 30 days out relative to that landing, and build the distribution of the gap (the points remaining). The median of that gap is “the normal room left to gain for that day of the week in that season,” and the moment your measured 45-days-out figure departs from it is the moment to intervene. The market’s 45-days-out level is best used not as an absolute target for your own property, but as a reference line for checking whether external conditions are running as usual.
Let us run this procedure once against Okayama’s measured business-hotel data. Taking the same day-of-week average from the most recent completed month (July 2026) as a proxy for the landing level, the table below lines up how far each stay date’s 45-days-out figure sat from it, and how far that distance had closed by the latest observation. Translated from an absolute 45-days-out value into “distance to landing,” two dates in the same 70s range call for different moves — as the table makes visible.
| Stay date | 45 days out | Landing benchmark (same day-of-week average, July 2026) |
Distance at 45 days out | Latest observation | Distance remaining | Reading |
|---|---|---|---|---|---|---|
| August 8 (Sat) | 76.2% | 92.2% | +16.0pt | 89.6% (8 days left) | 2.6pt | Late-surge; closing on the landing benchmark |
| August 14 (Fri) | 71.2% | 86.3% | +15.1pt | 81.5% (14 days left) | 4.8pt | Late-surge; on track |
| August 15 (Sat) | 68.1% | 92.2% | +24.1pt | 78.0% (15 days left) | 14.2pt | Largest remaining distance |
| August 19 (Wed) | 79.6% | 91.0% | +11.4pt | 86.7% (19 days left) | 4.3pt | Normal range |
| August 22 (Sat) | 85.3% | 92.2% | +6.9pt | 93.4% (22 days left) | -1.2pt | Front-loaded; already there |
| August 26 (Wed) | 65.1% | 91.0% | +25.9pt | 70.5% (26 days left) | 20.5pt | Candidate for intervention |
| August 29 (Sat) | 77.7% | 92.2% | +14.5pt | 82.2% (29 days left) | 10.0pt | Hold judgement until 30 days out |
Okayama, business hotels, estimated OCC (based on OTA-listed inventory). The landing benchmark is a proxy built from July 2026 day-of-week averages (Sat 92.2%, Fri 86.3%, Wed 91.0%, N=83-88 properties) and does not incorporate seasonality specific to August. Distance = landing benchmark minus estimated OCC at the given cross-section. A negative value indicates the benchmark has already been exceeded. When running this at your own property, replace this column with your own landing results for the same month and the same day of the week over the past 12 months.
Source: Compiled by the HotelBank Editorial Team from MetroEngines Research
The third stage is price. An occupancy yardstick alone cannot tell you whether to fill the remaining room or defend rate. For Okayama business hotels, taking the most recent month where confirmed figures can be compared like for like, estimated settled ADR was ¥6,700 in June 2026 (N=94 properties) against ¥6,900 in June 2025 (N=97 properties), or -3.9% year on year. May 2026 was ¥7,600 (N=97 properties), +2.3% year on year. By hotel type, confirmed June 2026 figures were ¥9,700 for city hotels (N=17 properties, -16.6% YoY) and ¥10,700 for ryokan (N=58 properties, +7.1% YoY).
Source: Compiled by the HotelBank Editorial Team from MetroEngines Research
Solid lines in the chart are confirmed figures; dotted lines are estimates based on current sales conditions. For business hotels, August 2026 is currently estimated at ¥10,400 (N=93 properties) and September at ¥10,100 (N=90 properties). Because these rest on a different basis from confirmed figures, a straight comparison with confirmed values has to wait for month-end finalisation. Even so, the outline — August sitting high within the year as a seasonal shape, easing somewhat into September — is a useful reference when drawing up a rate-revision calendar. For city hotels the current estimates are ¥16,100 for August 2026 (N=17 properties) and ¥16,200 for September (N=17 properties); for ryokan, ¥14,200 for August (N=54 properties) and ¥14,500 for September (N=55 properties). All of these can move, and should be assessed once the month closes.
For revenue managers running hotels and ryokan in Okayama — implications and an action plan
(1) Use the 45-days-out level to classify, not to pass or fail. Among Okayama business hotels, Saturday 8 August came from 76.2% at 45 days out to 89.6% at the latest observation, while Wednesday 26 August moved only from 65.1% to 70.5%. Rather than judging good or bad on the 45-days-out value alone, use it as the entry point for sorting each date into late-surge or front-loaded.
(2) The slope from 45 to 30 days out tells you how much time is left to move price. On dates where the slope steepens early — such as +6.0pt for Saturday 22 August — remaining allotment is limited once 30 days out has passed, and the window for going after rate closes first. Conversely, on dates that barely move, such as +1.6pt for 8 August, there is a track record of +11.8pt arriving between 30 days out and the latest observation; before cutting price early on the grounds of a low level at 30 days out, there is room to check the slope record first.
(3) Build hotel type into the threshold. At 45 days out for Saturday 12 September, city hotels stood at 83.6% against ryokan at 53.1%, a 30.5pt spread. Within the same area, using a reference line that does not correspond to your own hotel type means constantly misreading yourself as either “behind” or “comfortable.” For ryokan, a low reading at 45 days out is normal; look at distance from your own past results for the same day of the week and the same season, not at the absolute value.
(4) Keep the price yardstick monthly. The confirmed estimated settled ADR for Okayama business hotels in June 2026 was ¥6,700 (N=94 properties, -3.9% YoY), with current estimates of ¥10,400 for August and ¥10,100 for September (N=93 and 90 properties). Rather than chasing fine daily price differences in market data, the realistic approach is to compare the monthly level against your own rate band and combine it with the three occupancy checkpoints.
| Time horizon | Move | Decision trigger | Purpose |
|---|---|---|---|
| T-45 | Sort target dates into front-loaded or late-surge and set the initial allocation of inventory and rate | Where the market’s 45-days-out level sits within your own type’s reference range (business hotels 68.1-85.3%, city hotels 76.2-85.3%, ryokan 53.1-70.8%) | Avoid both signalling value too early and leaving demand on the table |
| T-45 | From your own past 12 months, build day-of-week landing levels and the median points remaining from 45 days out to landing | When your property has no day-of-week reference line yet (on the market side, July 2026 business hotels ran Thursday 92.3% against Sunday 81.2%, an 11.1pt spread) | Hold a threshold specific to your property rather than a borrowed market average |
| T-30 | Record the slope from 45 to 30 days out and fix which dates are for going after rate and which are for filling remaining room | Whether the slope resembles the 22 August pattern (+6.0pt) or the 8 August pattern (+1.6pt) | Align estimates of how much time is left to move price |
| T-30 | Check your own rate band for the month against the monthly estimated settled ADR | When your August and September settings remain far from the market’s current estimates (business hotels ¥10,400 / ¥10,100; city hotels ¥16,100 / ¥16,200; ryokan ¥14,200 / ¥14,500) | Reconcile remaining occupancy room and rate on a monthly cadence |
| Final two weeks | Only on dates sorted as late-surge, hold back inventory and sales conditions to catch late demand | Whether the date matches a pattern showing gains on the scale of +11.8pt (8 August) to +7.0pt (15 August) between 30 days out and the latest observation | Preserve the ability to capture the late build-up in full |
| Looking to next month | Fix the three checkpoints (45-days-out level / 45-to-30-days-out slope / late build-up) on a single sheet and update it in the same form every week | When operations amount to no more than looking at the curve daily | Raise the reproducibility of decisions and let the team argue in the same vocabulary |
Source: Compiled by the HotelBank Editorial Team from MetroEngines Research
Summary — three yardsticks to take away
Yardstick 1: read the 45-days-out level against a type-specific reference line. For Saturday 12 September 2026 in Okayama, city hotels stood at 83.6%, business hotels at 73.4% and ryokan at 53.1% — a 30.5pt spread. A comparison that does not use your own type’s reference line does not hold up in the first place.
Yardstick 2: the 15-day slope from 45 to 30 days out determines the pattern. The +6.0pt on Saturday 22 August is front-loaded; the +1.6pt on Saturday 8 August is late-surge. The slope is a proxy for “how much time is left to move price,” and it connects to action more directly than the level at 45 days out.
Yardstick 3: measure the room left in the final stretch as distance from the landing level. 8 August went from 77.8% at 30 days out to 89.6% at the latest observation (+11.8pt); 22 August went from 91.3% to 93.4% (+2.1pt). Even within business hotels, the size of the remaining room differs by an order of magnitude from date to date. Hold the distance to your own landing level in advance (on the market side, Okayama business hotels averaged 88.5% daily in July 2026) and you will not be whipsawed by late movements.
The value of a booking curve lies not in the elegance of the line but in being able to cut it at a fixed number of days remaining and compare it with last time. Compress it into three points — 45 days out, 30 days out and the final stretch — and you can hold the same discussion every week, in the same format and the same vocabulary. Start by re-laying your own past 12 months along those three points.
About the data
| Definition of estimated OCC | Occupancy based on OTA-listed inventory = 100 – 100 x rooms still listed on OTAs / total rooms. It is an estimate based on how listed inventory is being taken up on OTAs, and differs in definition from actual room occupancy (it reads higher). This article labels it “estimated OCC (based on OTA-listed inventory).” Scope: Okayama; target months June and July 2026 (completed-month results) and stay dates in August and September 2026 (progress cross-sections). |
| Booking curve | Based on observations from 45 days before the stay date up to the most recent reading. The latest observation cross-section is as of 31 July 2026. |
| Definition of estimated settled ADR | A settled price level (tax-exclusive equivalent) estimated from OTA and other sales data (lowest-plan level x hotel-type coefficient, ensembled across multiple channels). Past months are confirmed figures; the current and future months are estimates based on current sales conditions. Median error of 6.6% when reconciled against published operating results. Values for current and future months can move with sales conditions. |
| Breakdown of N= | Booking curves: Okayama business hotels, base of 87-88 properties (10,358-10,457 rooms); city hotels, base of 16 properties (1,924 rooms); ryokan, base of 45-46 properties (882-903 rooms). Observed properties by cross-section: business hotels 81-85 at 45 days out, 82-87 at 30 days out, 52-83 at the latest observation; city hotels 14-16 at 45 days out, 14-16 at 30 days out, 12-15 at the latest observation; ryokan 38-45 at 45 days out, 38-41 at 30 days out, 27-41 at the latest observation. Daily results for completed months: business hotels N=83-88 properties, city hotels N=15-16 properties, ryokan N=34-46 properties. Estimated settled ADR: business hotels N=79-98 properties, city hotels N=15-18 properties, ryokan N=54-60 properties. |
| Definition of sold-out property share | The estimated share of properties for which no listed inventory can be confirmed on OTAs and other channels. |
| Data as of | Data as of 2 August 2026. Sales conditions and inventory change daily, so the figures in this article are a snapshot at the time of retrieval. |
Source: Compiled by the HotelBank Editorial Team from MetroEngines Research
Related reading
- Tochigi Booking Curves by Type: Resort 81.1% at T-45, Only +2.6pt Left
- Hokkaido City Hotels: Only Aug 15 Trails at 78.7% OCC, 45 Days Out
- Osaka Obon 2026 Booking Curve: Aug 14 at 74.9%, Aug 16 Stuck at 64.1%
- Tokyo Aug 14: 434 Hotels, Front-Loaded 10.8% vs Late-Surge 9.4%
- RM Tools & Price Dispersion: Tokyo/Osaka ADR Volatility by Hotel Type