

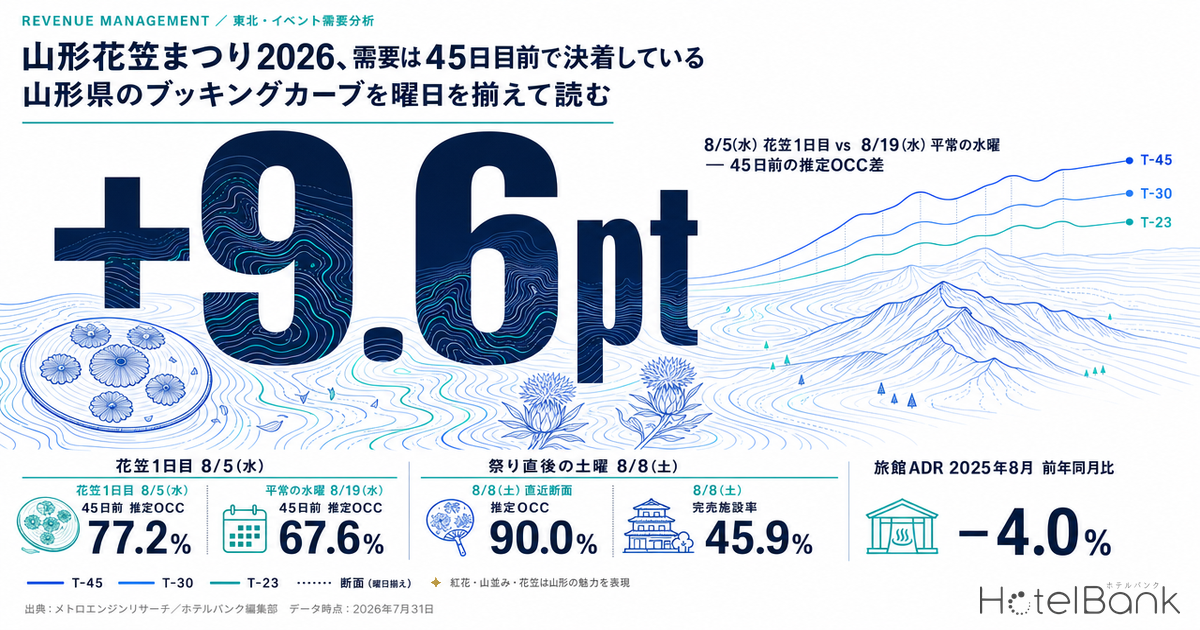
The Yamagata Hanagasa Festival runs for three days in 2026 — Wednesday August 5, Thursday August 6 and Friday August 7 — with the Hanagasa Summer Festival, which serves as the eve event, held on Tuesday August 4 (as announced by the Yamagata Hanagasa Council and the Yamagata Chamber of Commerce and Industry). We examined when demand for this run of three consecutive weekdays actually accumulates on Yamagata Prefecture’s booking curve, comparing each festival date against the same day of the week in a normal week. The conclusion first: the demand premium of the Hanagasa period is already complete 45 days before the stay date. Estimated OCC across all property types (OTA-listed-inventory basis) stood at 77.2% for Wednesday August 5 at T-45, against 67.6% for the control date of Wednesday August 19 — a gap of +9.6pt. At T-23 the gap is +9.4pt, essentially unchanged. Meanwhile, the build-up from T-45 to T-23 was +4.8 to +5.7pt for the three Hanagasa days and +4.2 to +5.0pt for the matching weekdays in the normal week — effectively the same pace. In other words, it is not that “the festival makes demand surge late”; the gap was already there before T-45. And measured by sold-out property rate, the tightest date in the prefecture is not one of the three festival days but the Saturday immediately after, August 8 (45.9%).
Scope: Yamagata Prefecture, all property types N=295 properties (12,120 rooms); of which ryokan N=168 properties (4,008 rooms). Price figures in this article are estimated settled ADR (the transaction price level estimated from OTA and related sales data, tax-exclusive equivalent); occupancy is an estimate on an OTA-listed-inventory basis. Full definitions appear at the end of the article. Data as of July 31, 2026.
- — +9.6pt — Estimated OCC for the first Hanagasa day, Wednesday August 5, was 77.2% at 45 days before the stay date, against 67.6% for the day-of-week-matched control of Wednesday August 19. The gap barely moves, still +9.4pt at T-23.
- — The difference is in the intercept, not the slope — The build-up from T-45 to T-23 was +4.8 to +5.7pt for the three Hanagasa days and +4.2 to +5.0pt for the same weekdays in a normal week — the same order of magnitude. The premium is priced in before T-45.
- — A weekday beats a weekend — The 77.2% recorded for Wednesday August 5 at T-45 exceeds the 76.2% of Saturday August 22 in a normal week. Narrowing to ryokan only, the comparison is 73.0% against 61.3%, a gap of +11.7pt.
- — The highest sold-out property rate falls on Saturday August 8 — In the latest snapshot (observed July 30, 2026), estimated OCC reached 90.0% and the sold-out property rate 45.9%. The Saturday right after the festival, not the three festival days themselves, is the tightest of the ten dates examined.
- — Ryokan ADR is below last year — Estimated settled ADR for ryokan in Yamagata Prefecture in August 2025 was down 4.0% year on year on confirmed figures (¥14,000 → ¥13,400). It is the only category in the red while the others rose 3.5% to 5.8%.
Overlay the festival week and a normal week by weekday, and the gap is complete at 45 days out
When measuring event demand, looking at estimated OCC during the festival period alone tells you nothing. If the mix of weekdays differs, the level naturally differs too. So for each day of the Hanagasa Festival period we set the same day of the week two weeks later as the control date: Wednesday August 19 against Wednesday August 5, Thursday August 20 against Thursday August 6, Friday August 21 against Friday August 7, and Saturday August 22 against Saturday August 8, the day right after the festival. In every case the figures are drawn from the Yamagata Prefecture all-property-types booking curve, using only observations from 45 days before the stay date onward.
The chart below overlays four representative dates out of the ten, from 45 down to 23 days remaining. The series are cut off at T-23 because observations for the control dates (August 19–22) had only progressed that far as of this article’s data pull; trimming to a common window is what makes the comparison valid.
Source: Compiled by the HotelBank Editorial Team from MetroEngines Research data
The four lines run almost parallel. The first Hanagasa day, Wednesday August 5, moves from 77.2% at T-45 to 82.0% at T-23, a gain of +4.8pt; the control, Wednesday August 19, moves from 67.6% to 72.6%, a gain of +5.0pt. The slope of the build-up is almost identical to that of a normal Wednesday, and the source of the difference is the height of the starting point. The same picture holds on Thursday (August 6 +5.2pt / August 20 +4.2pt) and on Friday (August 7 +5.7pt / August 21 +4.6pt). Measured against the day-of-week-matched control, the gap is stable at every fixed point — T-45, T-30 and T-23 — at +9.6/+9.0/+9.4pt on Wednesday, +6.8/+7.0/+7.8pt on Thursday, and +5.3/+4.9/+6.4pt on Friday.
What matters operationally is precisely this fact that the gap does not move. The Hanagasa premium was already reflected in market prices and inventory by the time the T-45 observation window opened. What can be done after T-45 is closer to the work of filling the remainder at the same pace as a normal week. A comparable case, matching a single event day against a normal weekend on cross-sections from 45 days out, is covered in 94.5% Sold 45 Days Out: Omagari Fireworks vs a Normal Akita Weekend.
| Stay date | Classification | T-45 | T-30 | T-23 | Latest snapshot | Latest sold-out property rate |
|---|---|---|---|---|---|---|
| Aug 1 (Sat) | Weekend before the festival | 71.6% | 74.7% | 77.8% | 86.3% (2 days out) | 35.3% |
| Aug 4 (Tue) | Eve festival | 72.3% | 77.0% | 79.2% | 87.7% (5 days out) | 34.1% |
| Aug 5 (Wed) | Hanagasa day 1 | 77.2% | 80.3% | 82.0% | 90.3% (6 days out) | 36.4% |
| Aug 6 (Thu) | Hanagasa day 2 | 76.2% | 79.7% | 81.4% | 86.7% (7 days out) | 32.7% |
| Aug 7 (Fri) | Hanagasa final day | 78.8% | 82.7% | 84.5% | 87.4% (8 days out) | 25.3% |
| Aug 8 (Sat) | Saturday right after the festival | 78.0% | 82.3% | 85.6% | 90.0% (9 days out) | 45.9% |
| Aug 19 (Wed) | Control: normal Wednesday | 67.6% | 71.3% | 72.6% | 74.5% (20 days out) | 23.9% |
| Aug 20 (Thu) | Control: normal Thursday | 69.4% | 72.7% | 73.6% | 74.1% (21 days out) | 19.5% |
| Aug 21 (Fri) | Control: normal Friday | 73.5% | 77.8% | 78.1% | 78.4% (22 days out) | 16.9% |
| Aug 22 (Sat) | Control: normal Saturday | 76.2% | 80.6% | 82.6% | 82.6% (23 days out) | 25.3% |
The number of observed properties ranges from 218 to 293 depending on the cross-section. For August 1, the T-30 cell uses the T-31 value because observations at that cross-section were thin. The “latest snapshot” column uses the same observation date (July 30, 2026) for every stay date, with days remaining until the stay date shown in parentheses. The sold-out property rate is an estimate of the share of properties for which no listed inventory can be confirmed on OTAs and related channels.
Source: Compiled by the HotelBank Editorial Team from MetroEngines Research data
The highest sold-out property rate is not one of the three festival days but Saturday August 8, right after
The next chart overlays the curves for the three Hanagasa days (August 5–7) and the Saturday right after, August 8, extended through to the latest snapshot. Here the range runs from 45 down to 6 days remaining.
Source: Compiled by the HotelBank Editorial Team from MetroEngines Research data
Among the three festival days, the highest level at T-45 belongs to the final day, Friday August 7, at 78.8%, followed by the opening day, Wednesday August 5, at 77.2%, and the second day, Thursday August 6, at 76.2%. What deserves attention here is that the 77.2% of Wednesday August 5 exceeds the 76.2% recorded at T-45 by Saturday August 22, a normal-week weekend. A midweek Wednesday is absorbing market-wide inventory at a level above that of an ordinary weekend. Narrowing to ryokan widens the gap further: Wednesday August 5 stands at 73.0% at T-45, against 61.3% for Saturday August 22 — a spread of +11.7pt.
On the other hand, the largest build-up from T-45 to T-23 belonged to Saturday August 8 at +7.6pt across all property types, and +8.7pt for ryokan. By the latest snapshot it had advanced to 90.0% across all property types, with a sold-out property rate of 45.9% — the highest of the ten dates covered in this article. The festival ends on the evening of Friday the 7th, but the following day, Saturday the 8th, layers “one more night after seeing the festival” on top of ordinary weekend demand, and prefecture-wide the sold-out property rate exceeds that of the three festival days. This is a date to treat as a peak rather than as a shoulder.
Ryokan behave slightly differently from the market as a whole. At T-45 the three Hanagasa days read 73.0% for August 5, 68.9% for August 6 and 68.9% for August 7 — a heavy concentration on the opening day. At the latest snapshot they read 83.1% for August 5, 78.0% for August 6 and 79.7% for August 7 (6, 7 and 8 days out respectively). The day-of-week-matched controls in the normal week read 68.2% for August 19, 65.6% for August 20 and 67.6% for August 21 at the latest snapshot, so within the ryokan segment the Hanagasa week clearly leads on every day from Wednesday through Friday. Differences in curve shape between property types are set out in Tochigi Booking Curves by Type: Resort 81.1% at T-45, Only +2.6pt Left, which organizes the relationship between the T-45 level and the room left to run in the final stretch.
What monthly estimated settled ADR says about Yamagata’s position in August
For pricing we look not at daily or day-of-week figures but at monthly estimated settled ADR (tax-exclusive equivalent). The next chart overlays the monthly series for Yamagata Prefecture’s ryokan segment by year.
Source: Compiled by the HotelBank Editorial Team from MetroEngines Research data
On a year-on-year comparison of confirmed figures against confirmed figures, estimated settled ADR in Yamagata Prefecture for August 2025 moved in different directions by property type. Business hotels rose from ¥7,100 in August 2024 to ¥7,300 in August 2025 (N=77→80 properties, +4.2%), city hotels from ¥9,100 to ¥9,600 (N=11→12 properties, +5.8%) and resort hotels from ¥13,600 to ¥14,100 (N=20→19 properties, +3.5%). Ryokan alone fell, from ¥14,000 to ¥13,400, a decline of 4.0% (N=196→182 properties). In other words, in the ryokan segment that forms the core of the prefecture’s accommodation supply, the August rate came in below the previous year.
Looking at the distribution across the months of the year, the confirmed 2025 ryokan series puts August (¥13,414) third-highest after December (¥16,437) and November (¥13,778), with the lowest month being September (¥11,266). August sits near the top of the year, and the year’s lowest month follows immediately after. A seasonal peak with a short summit and a steep drop is an important premise when building a rate-revision calendar.
For August 2026, the levels emerging as estimates based on current sales conditions are ¥14,999 for ryokan (N=186 properties), ¥10,997 for business hotels (N=65 properties), ¥13,250 for city hotels (N=11 properties) and ¥18,350 for resort hotels (N=18 properties). These are calculated on a different basis from the confirmed figures for past months, however, so a straight comparison with confirmed values has to wait for month-end confirmation. They are best used only as “the level estimated from what is currently on the market,” to check where your own rate range sits. Note also that rate levels differ considerably between the prefecture’s individual onsen areas, so a prefecture-level figure should be read as an average across markets with distinct price structures.
For revenue managers running hotels and ryokan in Yamagata Prefecture — implications and action plan
(1) The decisive stretch for Hanagasa lies before T-45. The gap against the day-of-week-matched control is +9.6pt on Wednesday, +6.8pt on Thursday and +5.3pt on Friday at T-45, and +9.4pt, +7.8pt and +6.4pt at T-23 — barely moving. The build-up from T-45 to T-23 is also similar, +4.8 to +5.7pt for the three Hanagasa days against +4.2 to +5.0pt for the same weekdays in a normal week. When checking where your own event-date booking pace diverges from this market shape, it is safer not to assume that ground can be made up in the final stretch. Looking to next year, it is worth designing the opening of sales and the initial rate decision to fall earlier than T-45.
(2) There is a case for not treating a “weekday event” with weekday pricing. The 77.2% recorded by Wednesday August 5 at T-45 exceeds the 76.2% of Saturday August 22 in a normal week. For ryokan the spread is wider still, 73.0% against 61.3%. If your rate-revision calendar is built on a weekday/weekend split, there is room to check whether the three Hanagasa days are running through on weekday rates.
(3) Do not treat the Saturday after the festival as a day that is already over. At the latest snapshot Saturday August 8 stands at 90.0% across all property types with a sold-out property rate of 45.9% — the highest of the ten dates covered here. Its build-up from T-45 to T-23 was also the largest at +7.6pt (+8.7pt for ryokan). If you have loaded rates only across the festival period and left the following day set as an ordinary weekend, a gap may have opened between actual demand and your settings.
(4) Argue rates monthly and occupancy daily. Estimated settled ADR for Yamagata’s ryokan in August 2025 was down 4.0% year on year on confirmed figures — the only category to fall while the others rose. If occupancy in August is being lifted by the event while the monthly rate is not growing, one reading is that the room left to work with lies on the price side rather than on occupancy.
| Time horizon | Action | Decision trigger | Objective |
|---|---|---|---|
| Today to this week (remaining inventory for Aug 5–8) | Revisit how you handle the remaining allocation for Saturday August 8, on the same footing as the three festival days | When the market’s August 8 has progressed to 90.0% at the latest snapshot with a 45.9% sold-out property rate — at or above the three festival days (86.7–90.3%) — yet your own remaining allocation for the 8th alone is still heavy | Clear the remaining allocation without dropping rate at the very end |
| Today to this week | Decide on any additional discounting for the remaining Hanagasa allocation only after checking the market level | When the market’s August 5–7 sits at 86.7–90.3% at the latest snapshot, far above the same weekdays in a normal week (74.1–78.4%), and you are about to cut rate ahead of that market | Avoid a late-stage rate decline |
| Within two weeks (normal dates in late August) | Treat normal-week dates such as August 19–22 on a different logic from event dates | When the market’s normal week sits at 74.1–82.6% with a sold-out property rate of 16.9–25.3% at the latest snapshot — looser than the Hanagasa week — while you are still carrying the same aggressive settings | Make settings follow the swing between peak and trough |
| Within two weeks | Benchmark your own August rate range against the monthly market level | When your August settings continue to run well below the current market estimates (ryokan ¥14,999 / business ¥10,997 / city ¥13,250 / resort ¥18,350) | Check the room to lift rate over the remaining period |
| Toward next month (designing September) | Do not build the September rate calendar as an extension of August | When the settings fail to account for the steep drop in the confirmed 2025 ryokan series, where September (¥11,266) is the year’s lowest month and August (¥13,414) ranks third-highest | Price in the drop-off right after the peak |
| Toward next month (preparing for Hanagasa 2027) | Consider a design that pulls the opening of sales and the initial rate decision for next year’s Hanagasa period forward, ahead of T-45 | When, given that the gap against the day-of-week-matched control barely changes from T-45 (+9.6/+6.8/+5.3pt) to T-23 (+9.4/+7.8/+6.4pt), you judge that measures taken after T-45 alone cannot create the difference | Improve the accuracy of next year’s initial settings |
Source: Compiled by the HotelBank Editorial Team from MetroEngines Research data
Summary — three yardsticks for reading event demand
Yardstick 1: The difference shows up in the intercept, not the slope. The gap in estimated OCC between the Hanagasa week and a normal week held roughly the same width at every fixed point — T-45, T-30 and T-23. The strength of an event date is already priced into the market before the observation window opens. Follow only the slope of the curve and this difference stays invisible.
Yardstick 2: Compare like weekday with like. The figure of 77.2% for Wednesday August 5 is, on its own, neither “high” nor “low.” Set it beside the 67.6% of a normal Wednesday and it becomes the information “+9.6pt”; set it beside the 76.2% of a normal Saturday and it acquires the meaning “a weekday is beating a weekend.” Measuring event effects should always start from placing a same-weekday control.
Yardstick 3: Look at the rim of the festival. Prefecture-wide, the highest sold-out property rate belonged not to the three festival days but to Saturday August 8, right after (90.0% and 45.9% at the latest snapshot). A design that loads only the inside of the lines drawn on the event calendar will miss the peaks that form on the rim. The day before and the day after a festival are always worth inspecting at the same resolution as the event itself.
Metric Definitions Used in This Article
· Definition of estimated OCC: OTA-listed-inventory-basis occupancy = 100 − 100 × rooms still listed on OTAs ÷ total rooms. It is an estimate based on how far inventory sold through OTAs has been absorbed, and its definition differs from actual room occupancy (it runs higher). This article labels it “estimated OCC (OTA-listed-inventory basis).” Scope: Yamagata Prefecture, all property types and ryokan; target month August 2026.
· Booking curve: based on observations from 45 days before the stay date through to the most recent data pull.
· Definition of estimated settled ADR: the transaction price level (tax-exclusive equivalent) estimated from OTA and related sales data (lowest-plan level × property-type coefficient, ensembled across multiple channels). Past months are confirmed values; the current and future months are estimates based on present sales conditions. Median error against published operating results is 6.6%.
· Breakdown of N: for booking curves, Yamagata Prefecture all property types N=295 properties (12,120 rooms) and ryokan N=168 properties (4,008 rooms). The number of properties actually observable at each cross-section ranges from 218 to 293 for all property types and 118 to 167 for ryokan. For estimated settled ADR, Yamagata Prefecture ryokan N=182–196 properties, business hotels N=65–80 properties, city hotels N=11–12 properties and resort hotels N=18–20 properties (varying by month).
· The sold-out property rate is an estimate of the share of properties for which no listed inventory can be confirmed on OTAs and related channels.
· Data as of July 31, 2026. The latest snapshot uses observations from July 30, 2026. Because sales conditions and inventory change daily, the figures in this article are a snapshot at the time of the data pull.
References and Sources
· Yamagata Hanagasa Festival official site (Yamagata Hanagasa Council): https://www.hanagasa.jp/
· Yamagata Hanagasa Festival | Travel to Yamagata (Yamagata Prefecture Tourism and Products Association): https://yamagatakanko.com/festivals/detail_2955.html
· Hanagasa Summer Festival (Yamagata Chamber of Commerce and Industry): https://www.yamagata-cci.or.jp/user/eve/ev_hana_sum.html