

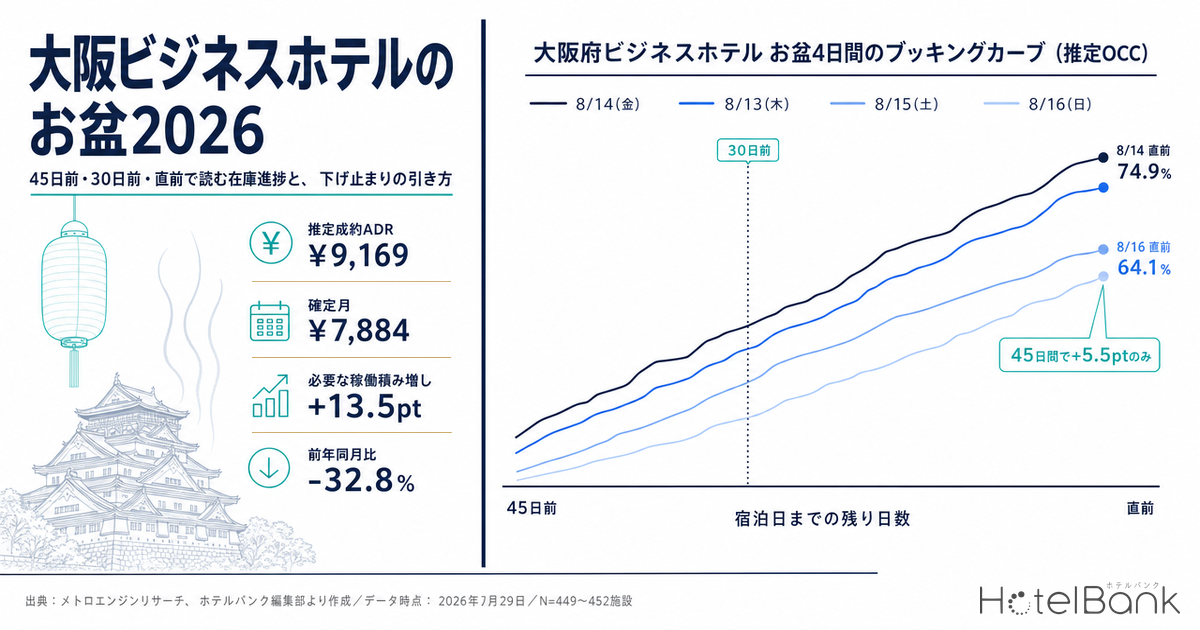
Tracking the Obon period (August 13–16, 2026) for business hotels in Osaka (N=450–452 properties, roughly 73,000 rooms) at three fixed checkpoints — 45 days out, 30 days out, and the most recent observation — reveals that the four days are anything but uniform. The furthest along, Friday August 14, built its estimated occupancy (estimated OCC, based on OTA-listed inventory) from 66.4% at 45 days out to 70.2% at 30 days out and 74.9% at the final checkpoint. Sunday August 16, by contrast, moved only from 58.6% to 61.7% to 64.1% — a gain of just 5.5 points over 45 days. Most important of all, Saturday August 15, which in a normal week would be the tightest night, is running below the Saturdays of both the preceding and the following week. Obon is a period in which the usual “weekends are strong” rule of thumb inverts, and applying a pricing calendar built on that assumption means leaving money on the table on the tight nights while sitting on unsold rooms on the soft ones. This article uses those three measured checkpoints to build the final pricing decisions for the remaining two weeks, and to identify the level below which discounting can no longer be recovered.
Scope: business hotels in Osaka, N=450–452 properties (city hotels, N=91 properties, used for comparison). Price figures in this article are estimated settled ADR (the transaction price level estimated from OTA and other sales data, on a pre-tax equivalent basis); occupancy is an estimate based on OTA-listed inventory. Both definitions appear at the end of the article. Data as of July 29, 2026.
- — The day-by-day ranking is set 45 days out. Across the four Obon nights at Osaka business hotels, the order at 45 days out was Aug 14 at 66.4% > Aug 13 at 64.0% > Aug 15 at 63.2% > Aug 16 at 58.6%, and it never once changed through the final checkpoint (as of July 28, 2026).
- — The day-of-week convention inverts. At the 30-days-out checkpoint, Thursday and Friday run above the surrounding weeks during Obon (Thursday 67.8% vs 63.2% / 63.0%), but Obon Saturday at 66.5% falls below the preceding week’s 70.4% and the following week’s 70.3%.
- — The late-stage slope varies by more than 2.5x across the four days. The gain from 30 days out to the final checkpoint was +6.1pt on Aug 13 but only +2.4pt on Aug 16. Soft days do not accelerate even as the stay date approaches.
- — The gap to city hotels widens on the softer days. At the final checkpoint the gap on Aug 16 is 17.3pt. Business-hotel inventory on the softer nights depends more heavily on price-elastic demand.
- — Cutting to the level of the last confirmed month consumes the entire remaining pickup. Taking estimated settled ADR from the August 2026 market estimate of ¥9,169 down to ¥7,884 — the confirmed figure for June 2026 — requires an occupancy gain of +13.5pt just to hold estimated RevPAR equivalent flat, which is virtually the whole of the measured pickup in a normal week (+9.8 to +14.4pt).
Inventory pickup across the four Obon nights — three checkpoints at 45 days, 30 days, and final
We start with how estimated OCC at Osaka business hotels accumulated from 45 days before the stay date through the most recent observation (as of July 28, 2026). The four nights differ in both their starting point and their slope.
Source: MetroEngines Research; compiled by the HotelBank Editorial Team
Friday August 14 was already out in front at 66.4% at the 45-day mark, while Sunday August 16 was the softest at 58.6%. That ranking did not shift once over the following 45 days. In other words, Obon demand in Osaka did not swing at the last minute — the relative strength of each night was already determined 45 days out.
| Stay date | Properties | 45 days out | 30 days out | Final (Jul 28) | 45 days out → final | Sell-out rate (final, as of Jul 28) |
|---|---|---|---|---|---|---|
| Aug 13 (Thu) | 450 | 64.0% | 67.8% | 73.9% | +9.9pt | 5.1% |
| Aug 14 (Fri) | 451 | 66.4% | 70.2% | 74.9% | +8.5pt | 7.1% |
| Aug 15 (Sat) | 449 | 63.2% | 66.5% | 70.0% | +6.8pt | 3.8% |
| Aug 16 (Sun) | 452 | 58.6% | 61.7% | 64.1% | +5.5pt | 1.3% |
Source: MetroEngines Research; compiled by the HotelBank Editorial Team
What stands out is that while the gain from 45 to 30 days out was roughly uniform across the four nights (+3.1 to +3.8pt), the gain from 30 days out to the final checkpoint spread by more than 2.5x: +6.1pt on August 13, +4.7pt on August 14, +3.5pt on August 15, and +2.4pt on August 16. Strong nights accelerate as the date approaches; soft nights do not. That difference in late-stage slope is precisely the information that should drive different actions over the remaining two weeks.
As a second yardstick, the measured curve for the most recent normal week that has already passed (July 9–12, 2026) shows the same Osaka business hotels picking up +9.8 to +14.4 points between 16 days out and 2 days out (Thursday July 9: 67.9%→82.3%; Friday July 10: 68.7%→80.4%; Saturday July 11: 76.5%→89.4%; Sunday July 12: 67.4%→77.2%). June 2026, the most recently completed confirmed month, finished with a monthly average estimated OCC of 86.3% for Osaka business hotels (30 days, roughly 445 properties). The current cross-section of 64.1–74.9% therefore still has meaningful distance to travel before reaching that kind of finish.
When the day-of-week rule inverts — Thursday and Friday tighten, Saturday and Sunday soften
What makes Obon distinctive becomes obvious when each night is placed alongside the same weekday in the surrounding weeks. Using the single 30-days-out checkpoint, we compared Thursday through Sunday across the pre-Obon week (August 6–9), Obon itself (August 13–16), and the post-Obon week (August 20–23).
Source: MetroEngines Research; compiled by the HotelBank Editorial Team
Thursday comes in at 67.8% during Obon against 63.2% the week before and 63.0% the week after, and Friday at 70.2% against 66.5% and 64.8% — the weekday side is clearly elevated. Saturday, however, sits at 66.5% during Obon against 70.4% before and 70.3% after, and Sunday at 61.7% against 65.3% the week before, meaning the weekend side either falls below the surrounding weeks or merely matches them. The same pattern holds at the 45-days-out checkpoint (Saturday: 65.5% prior week, 63.2% Obon, 65.8% following week; Sunday: 60.9% prior week, 58.6% Obon, 58.5% following week), so this is a structural feature of the period rather than observational noise.
For context, a major music festival is scheduled to hold its Osaka dates at the Expo ’70 Commemorative Park from Friday August 14 through Sunday August 16 (per the organizer’s official announcement), and Kyocera Dome Osaka has professional baseball home games scheduled across the same three days. That Sunday August 16 is still the softest of the four nights despite this reflects its position as the return leg of the holiday — the night when lodging demand itself thins out. It is a textbook case that the presence of an event does not make every date of that event strong.
The gap to city hotels, and estimated settled ADR for August 2026
Viewing the same four nights through Osaka’s city hotels (N=91 properties, 24,219 rooms) shows an entirely different level.
| Stay date | Business, 45 days out | Business, final | City, 45 days out | City, final | Gap at final |
|---|---|---|---|---|---|
| Aug 13 (Thu) | 64.0% | 73.9% | 80.9% | 86.6% | 12.7pt |
| Aug 14 (Fri) | 66.4% | 74.9% | 80.7% | 86.3% | 11.4pt |
| Aug 15 (Sat) | 63.2% | 70.0% | 79.2% | 84.6% | 14.6pt |
| Aug 16 (Sun) | 58.6% | 64.1% | 77.5% | 81.4% | 17.3pt |
Source: MetroEngines Research; compiled by the HotelBank Editorial Team (estimated OCC is based on OTA-listed inventory; “final” is the observation as of July 28, 2026)
City hotels were already at 77.5–80.9% at 45 days out — close to where business hotels stand at the final checkpoint — and the gap widens on the softer nights (17.3 points on August 16). The fact that the distance to the upper category grows precisely on the soft nights suggests that business-hotel inventory on August 15–16 depends more heavily on elastic demand that moves with price.
What about the price side? Estimated settled ADR for Osaka business hotels in August 2026 is ¥9,169 (N=487 properties) on the basis of current sales conditions, against ¥12,628 (N=96 properties) for city hotels in the same month — a difference of roughly ¥3,500 (+37.7%). The most recent confirmed month, June 2026, came in at ¥7,884 (N=495 properties, confirmed), which is -32.8% against ¥11,735 in June 2025 (N=502 properties, confirmed). City hotels show the same pattern: ¥10,769 in June 2026 (N=95 properties) against ¥14,621 in June 2025 (N=91 properties), or -26.3%. The payback from the major international event demand of 2025 is showing up directly in the confirmed months.
Source: MetroEngines Research; compiled by the HotelBank Editorial Team (July–December 2026 are estimates based on current sales conditions, shown as dotted lines)
That said, ¥7,884 in June 2026 is also -5.5% against ¥8,339 in June 2024 (N=494 properties, confirmed), the pre-payback baseline — a level that cannot be explained as simply the mirror image of 2025. In a payback phase the whole market tends to drift downward, and this is the evidence of what happens when a property keeps following that drift: it ends up below even the pre-payback level. Note that the August 2026 estimate (¥9,169) and the August 2025 confirmed figure (¥13,211, N=499 properties) rest on different bases, so no simple year-on-year comparison is drawn here; that assessment should wait until the month closes.
For revenue managers running Osaka business hotels — implications and an action plan
(1) Benchmark your pace against the market night by night. The market’s final cross-section reads 73.9% on August 13, 74.9% on the 14th, 70.0% on the 15th and 64.1% on the 16th — a spread of 10.8 points across four days. Looking at your own OCC as a single four-day average erases that spread entirely. It is worth overlaying each night individually against the market curve to see which dates are running ahead of the market and which are lagging. Where you are ahead of the market, there may still be room on the price side.
(2) Switch off the weekend-shaped pricing calendar for these four days only. At the 30-days-out checkpoint, Thursday and Friday run above the surrounding weeks during Obon (Thursday 67.8% against 63.2% / 63.0%; Friday 70.2% against 66.5% / 64.8%), while Obon Saturday at 66.5% falls below 70.4% the week before and 70.3% the week after. Applying the standard “price Friday and Saturday high, Sunday and Monday low” rate grid unchanged risks a double miss: underpricing August 13–14 and overpricing August 15. Reordering by the measured day-by-day ranking rather than by day of week is worth doing.
(3) Hold a yardstick for how much more you can still pick up. In the most recent normal week (July 9–12), the market added +9.8 to +14.4 points between 16 days out and 2 days out. Applying that range to your own remaining inventory separates the volume that will clear on its own from the volume you have to go out and win. Worth pairing with the observation that softer nights have a flatter late-stage slope (August 16 gained only +2.4pt from 30 days out to the final checkpoint).
(4) Draw the discounting floor from the confirmed month. Confirmed estimated settled ADR for June 2026 was ¥7,884 — down 32.8% year on year and down 5.5% even against June 2024, before the payback. The market estimate for August is ¥9,169. With the market as a whole already below where it stood two years ago, this is a moment to work backwards from “cutting further cannot be earned back” rather than from “there is still room to cut.”
| Time horizon | Move | Decision trigger (figures from this article) | Objective |
|---|---|---|---|
| Today to this week | Reorder rates for the four nights by measured day-by-day ranking (Aug 14 > 13 > 15 > 16) rather than by day of week | If your August 15 rate is still set above your August 13 rate (the market reads Aug 15 at 70.0% < Aug 13 at 73.9%) | Simultaneously reduce the miss on tight nights and the leftover inventory on soft nights |
| Today to this week | Stop discounting August 13–14 and revisit how inventory is released, starting with the upper room types | If your OCC on the 13th–14th is running above the market’s final cross-section (73.9% / 74.9% as of July 28, 2026) | Preserve room to defend rate on the two nights with the thickest demand |
| Within two weeks (through early August) | Treat Sunday August 16 as a standalone problem date and pull inventory toward it through angles such as multi-night stays or early departures the next morning | The market’s August 16 moved only +5.5pt over 45 days and remains at 64.1% even at the final checkpoint | Reduce vacancy on the return-leg night by means other than a straight price cut |
| Within two weeks (through early August) | Set the floor for discounting in advance and share it across the team | The distance between the August 2026 market estimate of ¥9,169 and the confirmed June 2026 figure of ¥7,884 (-5.5% against June 2024) | Keep last-minute decisions from becoming reflexive follow-the-market discounting |
| Final stretch (2–3 days before the stay date) | Sort remaining inventory into “will clear on its own” and “must be won” to size the level of intervention | The +9.8 to +14.4pt pickup from 16 days out to 2 days out in the most recent normal week, applied to your own remaining rooms | Avoid unnecessary last-minute discounting while acting only on the rooms that genuinely remain |
| Looking to next month | Record where each of the four Obon nights finishes and keep it as next year’s 45-days-out baseline | The fact that the day-by-day ranking at 45 days out (66.4% > 64.0% > 63.2% > 58.6%) never changed through the final checkpoint | Make it possible to judge day-by-day strength next year from the 45-days-out cross-section alone |
Source: MetroEngines Research; compiled by the HotelBank Editorial Team
Putting a number on the discounting floor — three scenarios and a two-axis sensitivity grid
The measured figures above are enough on their own to frame the landing range for the remaining two weeks on paper. Only values that already appear in the body of this article are used: the estimated OCC at the final cross-section (73.9%, 74.9%, 70.0% and 64.1% for August 13–16, a four-day average of 70.7%), the +9.8 to +14.4pt pickup from 16 days out to 2 days out in the most recent normal week (July 9–12, 2026), and the three measured levels of estimated settled ADR (the August 2026 market estimate of ¥9,169, the pre-payback June 2024 confirmed figure of ¥8,339, and the most recent confirmed month, June 2026, at ¥7,884). No new measured claims are added.
| Scenario | Estimated settled ADR | Incremental pickup | Landing estimated OCC | Estimated RevPAR equivalent | Assumption applied |
|---|---|---|---|---|---|
| Pessimistic | ¥7,884 | +9.8pt | 80.5% | ¥6,347 | Follow the market down to the confirmed June 2026 level (¥7,884), with pickup at the measured floor (+9.8pt) |
| Mid | ¥8,339 | +12.1pt | 82.8% | ¥6,905 | Hold the floor at the pre-payback June 2024 level (¥8,339), with pickup at the midpoint of the measured range (+12.1pt) |
| Optimistic | ¥9,169 | +14.4pt | 85.1% | ¥7,803 | Hold the August 2026 market estimate (¥9,169), with pickup at the measured ceiling (+14.4pt) |
The weight of one ADR step versus one occupancy step
Opening the same framework onto two axes shows which lever does more work. Taking the center cell as the base (ADR ¥8,526 x landing estimated OCC 82.8%, both on a four-day-average basis for August 13–16, 2026), raising ADR by one step (¥322) adds ¥266 to estimated RevPAR equivalent, while adding one step of estimated OCC (+1.2pt) adds ¥102. Across the whole grid the range runs from ¥6,347 at the bottom to ¥7,803 at the top, a spread of about 23%.
| Estimated settled ADR \ landing estimated OCC (four-day-average basis for August 13–16, 2026) | 80.5% | 81.7% | 82.8% | 84.0% | 85.1% |
|---|---|---|---|---|---|
| ¥7,884 | ¥6,347 | ¥6,441 | ¥6,528 | ¥6,623 | ¥6,709 |
| ¥8,205 | ¥6,605 | ¥6,703 | ¥6,794 | ¥6,892 | ¥6,982 |
| ¥8,526 | ¥6,863 | ¥6,966 | ¥7,060 | ¥7,162 | ¥7,256 |
| ¥8,848 | ¥7,123 | ¥7,229 | ¥7,326 | ¥7,432 | ¥7,530 |
| ¥9,169 | ¥7,381 | ¥7,491 | ¥7,592 | ¥7,702 | ¥7,803 |
How much discounting costs, and the occupancy needed to cover it
Solving the identity in reverse sharpens the floor considerably. Starting from the mid scenario’s landing point (estimated OCC of 82.8% on a four-day-average basis for August 13–16, 2026), holding estimated RevPAR equivalent flat while cutting estimated settled ADR by 5% requires +4.4pt of estimated OCC; a 10% cut requires +9.2pt. And going from the market estimate of ¥9,169 down to the confirmed-month level of ¥7,884 (-14.0%) requires +13.5pt. That is virtually the entire pickup measured in the most recent normal week (+9.8 to +14.4pt). In other words, following the market down to the confirmed-month level only breaks even after spending every point of occupancy that would have accumulated naturally over the remaining two weeks. That calculation is what “work backwards from cutting further cannot be earned back, not from there is still room to cut” actually means.
Note: this section is a deterministic calculation using only the measured values stated in this article and the identity above; it is not a forecast of future results. Because estimated OCC is based on OTA-listed inventory and therefore runs higher than true room occupancy, estimated RevPAR equivalent should be read as a relative measure for comparison between scenarios and between cells, not as an absolute level.
Summary — three yardsticks
Yardstick 1: the day-by-day ranking is set 45 days out. Across the four Obon nights at Osaka business hotels, the order at 45 days out was August 14 at 66.4% > the 13th at 64.0% > the 15th at 63.2% > the 16th at 58.6%, and it never changed through the final checkpoint. The 45-days-out cross-section is not merely a progress reading — it works as a leading indicator of day-by-day strength.
Yardstick 2: Obon inverts the day of week. At the 30-days-out checkpoint, Thursday and Friday run above the surrounding weeks during Obon, while Saturday and Sunday run below them or merely match. Not applying a weekend-shaped rate grid unchanged to these four days is the fastest available correction for reducing missed revenue.
Yardstick 3: draw the floor from the confirmed month. Confirmed estimated settled ADR for June 2026 was ¥7,884 (down 32.8% year on year, and down 5.5% against June 2024). With the market as a whole already below the pre-payback level, pricing for the remaining two weeks should be designed around “where not to go below” rather than “how far to come down.”
About the data
- Definition of estimated OCC: occupancy on an OTA-listed inventory basis = 100 − 100 x rooms still listed on OTAs ÷ total rooms. It is an estimate based on how listed inventory is being absorbed on OTAs, and is defined differently from true room occupancy (it reads higher). The month covered in this article is August 2026, with measured figures for June and July 2026 used as comparison references.
- Booking curve: based on observations from 45 days before the stay date through the most recent reading.
- Definition of estimated settled ADR: the transaction price level (pre-tax equivalent) estimated from OTA and other sales data (lowest-plan levels x category-specific coefficients, ensembled across multiple channels). Past months are confirmed values; the current and future months are estimates based on current sales conditions. Median error against publicly disclosed operating results is 6.6%.
- Breakdown of N: booking curve — Osaka business hotels, 450 properties on August 13, 451 on the 14th, 449 on the 15th and 452 on the 16th (roughly 73,000 rooms each day); Osaka city hotels, 91 properties and 24,219 rooms (common to all four days). Estimated settled ADR — Osaka business hotels, N=487 properties for August 2026, N=495 for June 2026, N=502 for June 2025 and N=494 for June 2024; Osaka city hotels, N=96 properties for August 2026, N=95 for June 2026 and N=91 for June 2025. All figures are aggregated on a query basis of two adults per room for one night.
- Data as of July 29, 2026. Because sales conditions and inventory change daily, the figures in this article are a snapshot as of the retrieval date.
References and sources
- SUMMER SONIC 2026 official site | OSAKA INFO (Osaka dates, August 14–16, 2026, Expo ’70 Commemorative Park)
- Expo ’70 Commemorative Park | Notice on use of the park and surrounding facilities during SUMMER SONIC 2026, Friday August 14 to Sunday August 16, 2026
- Kyocera Dome Osaka | Event schedule for August 2026
■ Data sources
Inventory pickup (estimated OCC and sell-out rate) is compiled from daily observations of inventory listed for sale on OTAs for 449–452 business hotels and 91 city hotels in Osaka, aggregated by stay date and by lead time (MetroEngines Research). Estimated settled ADR is the transaction price level estimated from OTA sales data for the same area and category (lowest-plan levels x category-specific coefficients, ensembled across multiple channels); past months are confirmed values, while the current and future months are estimates on a listing-snapshot basis. Event dates come from the official announcements of the organizers and venue operators (sources listed above).
■ Calculation assumptions
The three scenarios and the two-axis sensitivity grid in the section “Putting a number on the discounting floor” are a deterministic calculation using only the identity estimated RevPAR equivalent = estimated settled ADR x estimated OCC. Inputs are limited to the measured values stated in the body of this article (the four-day average estimated OCC of 70.7% at the final cross-section; the +9.8 to +14.4pt pickup from 16 days out to 2 days out in the most recent normal week of July 9–12, 2026; and the three levels of estimated settled ADR, ¥7,884 / ¥8,339 / ¥9,169). Axis steps are equal divisions between the endpoint values, and the occupancy gain required to offset a discount is calculated as ΔOCC = OCC x r ÷ (1 − r). No new measured claims or external forecasts are included.
■ Limitations and caveats
Estimated OCC is based on OTA-listed inventory and is defined differently from true room occupancy (it reads higher). Estimated RevPAR equivalent should therefore be read as a relative comparison between scenarios and between cells rather than as an absolute level. Inventory and prices change daily, and lead-time figures for past dates continue to edge up as observations accumulate, so the figures in this article are a snapshot as of July 29, 2026. Estimated settled ADR for August 2026 is not a confirmed value, and because it rests on a different basis from the confirmed August 2025 figure (¥13,211, N=499 properties), no year-on-year comparison is calculated. The three scenarios do not express the probability of any outcome; they are the mechanical consequences of the assumptions applied.