

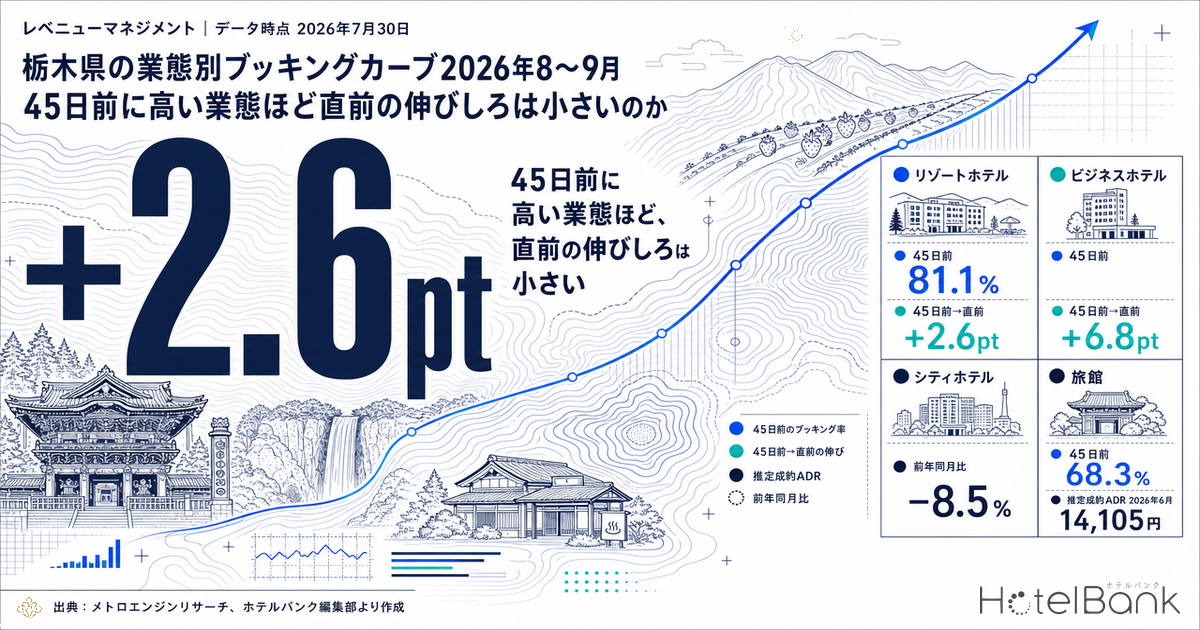
Looking at stays on Saturday, 22 August 2026 in Tochigi Prefecture from 45 days out, estimated OCC (based on OTA-listed inventory) stood at 81.1% for resort hotels (N=37 properties), 73.2% for business hotels (N=117 properties), 70.2% for city hotels (N=14 properties) and 68.3% for ryokan (N=196 properties) — a spread of 12.8 points across hotel types. Yet tracking the same stay date through to the most recent observation (24 days out), the additional gain was +6.8 points for business hotels, +5.9 points for city hotels and +5.6 points for ryokan, against just +2.6 points for resort hotels. The relationship — the higher a hotel type sits at 45 days out, the less room it has left to add in the final stretch — holds across all three August Saturdays in Tochigi. Ryokan alone, however, do not fall on that line. This article lines up booking curves for the four hotel types at three fixed points — 45 days out, 30 days out and the near-term reading — and sets out a yardstick for how to position inventory and rates over the final two weeks.
Scope: Tochigi Prefecture — city hotels N=14 properties / business hotels N=117 properties / resort hotels N=37 properties / ryokan N=196 properties. Price figures in this article are estimated transacted ADR (the transaction price level estimated from OTA and other sales data, tax-exclusive equivalent); occupancy is an estimate based on OTA-listed inventory. Definitions for both appear at the end of the article. Data as of 30 July 2026.
- — The ranking is set 45 days out — For stays on Saturday, 22 August 2026, estimated OCC at 45 days out was 81.1% for resort hotels (N=37 properties), 73.2% for business hotels (N=117 properties), 70.2% for city hotels (N=14 properties) and 68.3% for ryokan (N=196 properties). The 12.8-point spread between hotel types never reshuffled through to the final observation.
- — The higher the type, the flatter the slope — For the same stay date, the gain from 45 days out to the near-term reading (24 days out) was +6.8pt for business hotels, +5.9pt for city hotels and +5.6pt for ryokan, against +2.6pt for resort hotels. Over the six days from 30 days out to the near-term reading, resort hotels moved just 0.4pt.
- — Ryokan alone fall off the line — Averaged across the three Saturdays: 69.8% at 45 days out with a gain of +4.9pt. That is a smaller gain than city hotels (67.9%, +7.3pt), which start from a similar level — putting ryokan in a “low level and low growth” quadrant. The depth of supply behind this is substantial: 196 properties and 7,181 rooms in the prefecture.
- — Mixing days of the week erases the structure — Averaged across the two Wednesdays, ryokan post the largest gain at +5.9pt and city hotels the smallest at +1.9pt — reversing the Saturday order. Comparing curves therefore presupposes matching both hotel type and day of week.
- — Price direction splits by hotel type — Year-on-year change in estimated transacted ADR for June 2026 (finalised) was +2.8% for business hotels and +0.8% for resort hotels, against −2.3% for ryokan and −8.5% for city hotels. This calls for a rate-revision calendar by hotel type rather than a single company-wide adjustment rate.
Stays on Saturday, 22 August 2026 — a fixed-point comparison at 45 days, 30 days and the near-term reading
First, we fix the axis of comparison. The table below takes the four hotel types in Tochigi Prefecture and cuts the same stay date (Saturday, 22 August 2026) at three fixed points: 45 days out, 30 days out, and the near-term reading (24 days out — the most recent cross-section observable as of this article’s data date). The booking curves are based on observations running from 45 days before the stay date through to the latest reading.
| Hotel type | Properties | Total rooms | 45 days out | 30 days out | Near-term (24 days out) | 45 days out → near-term |
|---|---|---|---|---|---|---|
| Resort hotels | 37 | 2,396 | 81.1% | 83.3% | 83.7% | +2.6pt |
| Business hotels | 117 | 10,249 | 73.2% | 78.7% | 80.0% | +6.8pt |
| City hotels | 14 | 1,487 | 70.2% | 74.0% | 76.1% | +5.9pt |
| Ryokan | 196 | 7,181 | 68.3% | 73.4% | 73.9% | +5.6pt |
Source: Compiled by the HotelBank Editorial Team from MetroEngines Research
The ranking of the four hotel types was already settled at 45 days out, and no reshuffling occurred thereafter. Resort hotels were highest at 45 days out with 81.1%, moving to 83.3% at 30 days out and 83.7% at the near-term reading — the slope flattening as the window closes. Over the six days from 30 days out to the near-term reading they moved just 0.4 points, which is effectively flat.
Business hotels, by contrast, moved most in the 45-days-out to 30-days-out segment: +5.5 points from 73.2% to 78.7%, then a further +1.3 points to the near-term reading. City hotels ran 70.2% at 45 days out → 74.0% at 30 days out → 76.1% near-term, and unlike the other three types still had +2.1 points of growth left in the back half (30 days out → near-term). Ryokan added +5.1 points from 68.3% at 45 days out to 73.4% at 30 days out, then stalled at +0.5 points through to the near-term reading.
Source: Compiled by the HotelBank Editorial Team from MetroEngines Research
Looking at the shape of the curves, resort hotels start from an already-high position at 45 days out and then extend sideways with small fluctuations — a “front-loaded” type. Business hotels and ryokan build up at a roughly constant slope, a “linear” type, while city hotels are closest to a “back-loaded” shape, flat in the first half and rising in the second. Even within the same prefecture and on the same stay date, a different hotel type means a different window in which demand has to be captured. The same structure — curve shapes diverging by hotel type — is observed in urban markets too: in Tokyo, the gain from 45 days out to the near-term reading splits widely by type, at +25.7 points for business hotels, +14.5 points for city hotels and +1.9 points for capsule hotels.
Is the 45-days-out level inversely related to the final gain? Positioning the four hotel types
A single day could still be coincidence, so we repeated the same calculation for the three Saturdays in August 2026 (8, 15 and 22 August). All three have observations at both 45 days out and 24 days out, allowing a comparison with the length of the observation window held constant.
Source: Compiled by the HotelBank Editorial Team from MetroEngines Research
The bars show estimated OCC at 45 days out (three-day average) and the line shows the gain from 45 days out to the near-term reading (three-day average). Moving left to right, as the 45-days-out level rises, the gain falls: 7.3 points (city hotels, N=14 properties) → 6.2 points (business hotels, N=117 properties) → 2.8 points (resort hotels, N=37 properties). Resort hotels, already built up to 79.7% at 45 days out, have structurally little room left to add in the final stretch.
Ryokan (N=196 properties), however, fall off this line. Their level at 45 days out is 69.8% — second lowest, behind city hotels — yet their gain of 4.9 points is smaller than that of business hotels. In other words they sit in a fourth quadrant of “low at 45 days out and slow to grow thereafter”, which means they face a different problem from the other three types. Ryokan are the most numerous hotel type in Tochigi Prefecture, with 196 properties and 7,181 rooms in total, and that depth of supply may be showing up directly as a slower pace of sell-through.
Running the same calculation for weekdays (the two Wednesdays of 5 and 19 August 2026; 12 August is excluded because demand during the Obon week has a different character) changes the ordering of the hotel types.
| Hotel type (properties) | 3 Saturdays, 45 days out | 3 Saturdays, gain | 2 Wednesdays, 45 days out | 2 Wednesdays, gain |
|---|---|---|---|---|
| Resort hotels (37) | 79.7% | +2.8pt | 76.3% | +3.1pt |
| Business hotels (117) | 72.8% | +6.2pt | 65.8% | +4.7pt |
| Ryokan (196) | 69.8% | +4.9pt | 64.0% | +5.9pt |
| City hotels (14) | 67.9% | +7.3pt | 66.2% | +1.9pt |
Source: Compiled by the HotelBank Editorial Team from MetroEngines Research
On Wednesdays, ryokan post the largest gain of the four types at +5.9 points, and the “low level and low growth” picture visible on Saturdays disappears. City hotels move the other way, with their Wednesday gain shrinking to +1.9 points — the exact opposite of their Saturday profile (+7.3 points). Business hotels also sit 7 points lower at 45 days out on Wednesdays (65.8%) than on Saturdays, with a correspondingly smaller gain of +4.7 points. Resort hotels alone held a stable shape regardless of the day of week, running 76–80% at 45 days out and around +3 points of gain on both Saturdays and Wednesdays.
What this difference means is that the structure of “the higher a hotel type sits at 45 days out, the less room it has left” operates strongly on peak-demand dates such as Saturdays, and does not carry over directly to weekdays. Judging your own property’s progress against a monthly average curve that mixes days of the week therefore lets Saturday shortfalls and weekday shortfalls cancel each other out and disappear from view. Comparing curves presupposes matching the day of week. The same day-of-week variation shows up in other markets as well — business hotels in Aichi and Hiroshima, for instance, show a Sunday trough and a Thursday peak.
The 45-days-out cross-section heading into mid-September, and the price-side yardstick
The next peak, stays on Saturday, 12 September 2026, sits exactly at the 45-days-out cross-section as of the data date. Estimated OCC was 73.3% for resort hotels (N=37 properties), 67.5% for ryokan (N=190 properties), 67.4% for business hotels (N=117 properties) and 64.6% for city hotels (N=14 properties). Compared with the 45-days-out reading for Saturday, 22 August (resort 81.1%, business 73.2%, city 70.2%, ryokan 68.3%), the ranking is unchanged in that resort hotels lead, but the gap between resort hotels and the rest has narrowed from 7.9 points on 22 August (versus business hotels) to 5.9 points.
Onto this we overlay the price-side yardstick. Estimated transacted ADR in Tochigi Prefecture for June 2026, the most recent finalised month, was ¥14,401 for resort hotels (N=45 properties), ¥14,105 for ryokan (N=209 properties), ¥7,053 for city hotels (N=15 properties) and ¥6,319 for business hotels (N=137 properties). The comparison with the same month a year earlier (both finalised values) is shown below.
| Hotel type | June 2025 (finalised) | June 2026 (finalised) | YoY | August 2026 (current estimate) | September 2026 (current estimate) |
|---|---|---|---|---|---|
| Resort hotels | ¥14,290 N=41 | ¥14,401 N=45 | +0.8% | ¥23,322 N=42 | ¥19,048 N=41 |
| Ryokan | ¥14,444 N=213 | ¥14,105 N=209 | −2.3% | ¥18,266 N=206 | ¥17,780 N=196 |
| City hotels | ¥7,704 N=14 | ¥7,053 N=15 | −8.5% | ¥9,710 N=15 | ¥9,567 N=15 |
| Business hotels | ¥6,149 N=134 | ¥6,319 N=137 | +2.8% | ¥9,777 N=125 | ¥9,700 N=118 |
Source: Compiled by the HotelBank Editorial Team from MetroEngines Research
Comparing finalised values year on year, business hotels are up 2.8% and resort hotels up 0.8% — modest gains — while ryokan are down 2.3% and city hotels down 8.5%. The August and September 2026 figures are estimates based on current sales conditions and will shift as each month closes. A straightforward comparison against finalised values has to wait for month-end confirmation, but as a sense of level, August lifts resort hotels into the ¥23,300 range and ryokan into the ¥18,200 range, before September settles resort hotels into the ¥19,000 range and ryokan to around ¥17,800.
For ryokan, the most numerous hotel type, it is worth viewing the annual shape of estimated transacted ADR year over year.
Source: Compiled by the HotelBank Editorial Team from MetroEngines Research
Ryokan in Tochigi Prefecture trace a twin-peaked seasonal shape in both 2025 and 2026, with a trough from February to June and peaks in August and November–December. 2026 opened strongly, with January at ¥19,060 (N=201 properties, finalised) exceeding the ¥15,651 of January the previous year (N=215 properties, finalised), but by June it had fallen to ¥14,105 — 2.3% below the same month a year earlier. Current estimates put August at ¥18,266 (N=206 properties) and September at ¥17,780 (N=196 properties). The Saturday picture seen in the booking curves — low at 45 days out and slow to grow thereafter — and the depth of the trough in this seasonal shape are two inputs worth reading together when building a rate-revision calendar.
For revenue managers running hotels and ryokan in Tochigi Prefecture — implications and an action plan
1. Benchmark your property’s progress against the same hotel type and the same day of week. For Saturday, 22 August 2026, estimated OCC at 45 days out ranged from 68.3% to 81.1% across hotel types — a 12.8-point spread — and the ordering of the types itself flips between Saturdays and Wednesdays (ryokan gains +4.9pt on Saturdays versus +5.9pt on Wednesdays; city hotels +7.3pt versus +1.9pt). Using a prefecture-wide average curve, or an average that spans hotel types, as your benchmark leaves room for Saturday lag and weekday lag to offset each other and vanish from view. The comparison is best made on a same-type, same-day-of-week basis.
2. Let the 45-days-out level determine how much weight to place on final-stretch tactics. Resort hotels moved only +2.8pt from 79.7% at 45 days out (three-Saturday average) through to the near-term reading, and just 0.4pt over the six days from 30 days out to the near-term reading (22 August). For hotel types where the market already sits at a high level at 45 days out, planning that assumes a large build-up in the final two weeks is unlikely to hold. Conversely, a profile like city hotels — adding +7.3pt from 67.9% at 45 days out — still leaves room in the design of that final segment. Where your property sits at 45 days out is a basis for deciding how to allocate effort to last-minute measures.
3. For ryokan, Saturdays — “low at 45 days out and slow to grow” — are the central issue. Averaged across the three Saturdays, ryokan sit at 69.8% at 45 days out with a gain of +4.9pt, a smaller increase than city hotels (67.9%, +7.3pt) starting from a similar level. Given the depth of supply — 196 properties and 7,181 rooms in the prefecture — there is room to shift the emphasis away from designing to recover through last-minute value pricing and towards designing how Saturday allocations are filled ahead of the 45-days-out mark.
4. Translate the seasonal shape and year-on-year change into a rate-revision calendar. Estimated transacted ADR for ryokan is twin-peaked in both 2025 and 2026, with a trough from February to June and peaks in August and November–December, and the year-on-year comparison between finalised months was −2.3% for June 2026. Business hotels, meanwhile, ran +2.8% — the opposite direction. Because the direction of movement from the prior year differs by hotel type even within the same prefecture, holding a calendar by hotel type rather than a single company-wide adjustment rate merits consideration.
| Time horizon | Measure | Decision trigger (figures from this article) | Objective |
|---|---|---|---|
| T-45 (up to 45 days out) | Extract only the Saturdays in the target month and check your property’s 45-days-out performance against the hotel-type benchmark | If your property’s Saturday 45-days-out reading is clearly below the benchmark for its type (resort 79.7% / business 72.8% / ryokan 69.8% / city 67.9%) | Identify early which days of the week are lagging |
| T-45 (up to 45 days out) | Set allocations for the next peak, such as Saturday 12 September, by looking at the 45-days-out cross-section | Given that the 45-days-out reading for that date — ryokan 67.5%, business 67.4%, city 64.6% — sits below the equivalent point for 22 August | Avoid carrying over August’s structure out of inertia |
| T-30 (around 30 days out) | Make the 30-days-out level a checkpoint and reset your assumptions for remaining growth by hotel type | For 22 August: resort 83.3% → 83.7% near-term (+0.4pt); business 78.7% → 80.0% (+1.3pt). If your property is close to the flat pattern | Avoid overstating assumed final-stretch gains |
| T-30 (around 30 days out) | Check your property’s rates for the month against the estimated transacted ADR range for its hotel type | Current estimates for August 2026 are the ¥23,300 range for resort hotels, the ¥18,200 range for ryokan, around ¥9,800 for business hotels and around ¥9,700 for city hotels. If your rates sit far from the level for your type | Separate price-band misalignment from inventory factors |
| Final two weeks | Switch how inventory is released by hotel type, according to the level reached at 45 days out | Bearing in mind that the higher side at 45 days out (resort band, Saturdays) added only +2.6 to +2.8pt, while the lower side (city band, Saturdays) moved +5.9 to +7.3pt | Align the timing of releasing remaining allocations |
| Final two weeks | Prepare separate measures for weekdays and Saturdays so weekday upside is not left on the table | Averaged across the two Wednesdays, ryokan post the largest gain at +5.9pt and city hotels the smallest at +1.9pt. If you are assuming your weekday curve has the same shape as Saturdays | Separate tactics by day of week |
Source: Compiled by the HotelBank Editorial Team from MetroEngines Research
Summary — three yardsticks for reading Tochigi’s curves
Yardstick 1: the “height” at 45 days out. For stays on Saturday, 22 August 2026, estimated OCC at 45 days out was 81.1% for resort hotels, 73.2% for business hotels, 70.2% for city hotels and 68.3% for ryokan. The ranking settled at that point never reshuffled through to the final observation. The 45-days-out cross-section tells you a substantial part of how a stay date will end up.
Yardstick 2: the “slope” from 45 days out to the near-term reading. For the same stay date, the gain was +6.8pt for business hotels, +5.9pt for city hotels, +5.6pt for ryokan and +2.6pt for resort hotels. Averaged across the three Saturdays, the relationship holds that the higher a hotel type sits at 45 days out, the flatter its slope. Ryokan, however, fall off that line at 69.8% and +4.9pt, sitting in a “low level and low growth” position.
Yardstick 3: match the day of week. Averaged across the two Wednesdays, ryokan post the largest gain at +5.9pt and city hotels the smallest at +1.9pt, reversing the Saturday order. An average curve that mixes days of the week smooths this reversal away. Comparing curves starts from matching both hotel type and day of week.
About the data
■ Data sources
• Definition of estimated OCC (based on OTA-listed inventory): occupancy based on OTA-listed inventory = 100 − 100 × rooms remaining on OTA listings ÷ total rooms. It is an estimate based on the sell-through of inventory offered on OTAs and is defined differently from actual room occupancy (it reads higher).
• Booking curves: based on observations from 45 days before the stay date through to the latest reading.
• Definition of estimated transacted ADR: the transaction price level (tax-exclusive equivalent) estimated from OTA and other sales data (lowest-plan price level × coefficients by hotel type, ensembled across multiple channels). Past months are finalised values; the current and future months are estimates based on current sales conditions. Median error against published operating results is 6.6%.
• Breakdown of N: Tochigi Prefecture — city hotels N=14 properties (1,487 rooms) / business hotels N=117 properties (10,249 rooms) / resort hotels N=37 properties (2,396 rooms) / ryokan N=196 properties (7,181 rooms). N for estimated transacted ADR differs by month; as of June 2026, resort hotels N=45 properties, ryokan N=209 properties, city hotels N=15 properties, business hotels N=137 properties. For stays on Saturday, 12 September 2026, ryokan are N=190 properties.
■ Calculation assumptions
• Comparisons are made for the same stay date and the same hotel type, with aggregation matched by day of week. The three Saturdays are a simple average of 8, 15 and 22 August 2026; the two Wednesdays are a simple average of 5 and 19 August. Wednesday 12 August, in the Obon week, is excluded from the Wednesday average because demand has a different character.
• The starting point of each curve is fixed at 45 days before the stay date, and lead-time segments beyond 45 days are out of scope. “Near-term” refers to the most recent cross-section observable as of this article’s data date, which for each August stay date is 24 days before the stay. Stays on Saturday, 12 September 2026 are at a stage where only the 45-days-out cross-section is observable.
• Year-on-year comparisons of estimated transacted ADR are made between finalised values (June 2025 and June 2026). August and September 2026 are estimates based on current sales conditions, and no direct comparison with finalised values is made.
■ Limitations and caveats
• Target months and observation windows: booking curves cover stays on 5, 8, 12, 15, 19 and 22 August and 12 September 2026, observed from 45 days before each stay date through to the latest reading. Estimated transacted ADR is monthly from January 2025 to December 2026.
• Estimated OCC is an estimate based on the sell-through of OTA-listed inventory and is defined differently from actual room occupancy (it reads higher). It cannot be read as a substitute for actual occupancy.
• Because less than two years of observational data has accumulated, year-on-year comparisons of estimated OCC are not covered in this article. Year-on-year comparisons are presented only on the price side (estimated transacted ADR).
• City hotels have a small base at N=14 properties, so inventory decisions at a handful of properties can move the prefecture average. Figures for this hotel type need to be read with a margin.
• The relationship that “the higher a hotel type sits at 45 days out, the less room it has left in the final stretch” is derived from observations of three Saturdays and two Wednesdays, and is a descriptive account based on the ordering of four hotel types. It has not been tested for statistical significance.
• Data as of 30 July 2026. Sales conditions and inventory change daily, so the figures in this article are a snapshot as of the time of retrieval.