

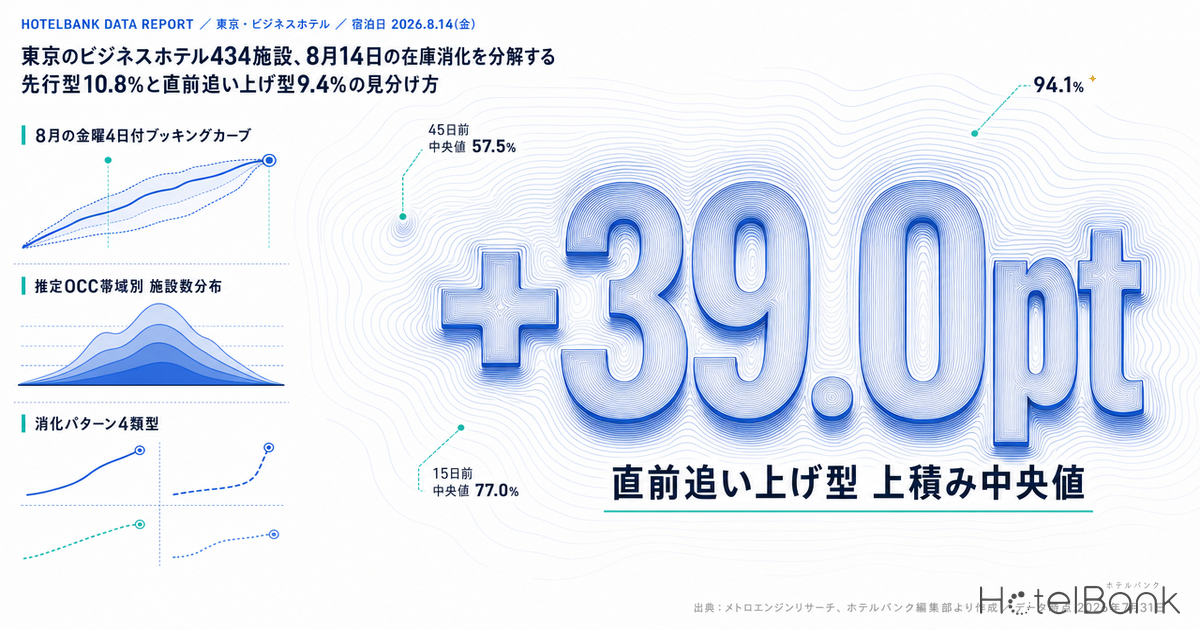
How much of the room stock for Friday, August 14, 2026 has already sold at Tokyo’s business hotels? Tracking property-level observations from 45 days out through the most recent reading, the median estimated OCC (OTA-listed inventory basis) across 434 properties built up from 57.5% at T-45, to 65.5% at T-30, to 77.0% at the latest T-15 reading. But the picture behind that median is anything but uniform. A “front-loaded” group that had already sold past 70% at T-45 (median within the group: 81.5%) accounts for 10.8% (47 properties), while a “late-surge” group sits slightly below the market median at 56.6% at T-45 yet reaches 94.1% by T-15, with a median property-level gain of +39.0pt, accounting for 9.4% (41 properties). At the other end, a “low-sell-through” group still stuck around 50% even at T-15 makes up 17.3% (75 properties). Same date, same hotel type, same city — and the shape of sell-through splits four ways. This article breaks down the market-wide booking curve and the property-level sell-through distribution for Tokyo business hotels, anchored on a single stay date: August 14, 2026.
Scope: Tokyo, business hotels, stay date Friday, August 14, 2026. Market curve N=820–867 properties (varies by observation point); property-level distribution N=434 properties. Occupancy figures are estimates based on OTA-listed inventory. This article does not address price levels — inventory sell-through only. All definitions appear at the end of the article. Data as of July 31, 2026.
• Estimated OCC (occupancy rate) = the share of sold rooms against total rooms in the area (an estimate based on OTA sales inventory). The formula is 100 − 100 × OTA-listed remaining rooms ÷ total rooms. It is an estimate based on how inventory listed on OTAs is being consumed, and is defined differently from actual room occupancy (it reads higher).
• “T-45,” “T-30,” and “T-15” refer to the number of days remaining until the stay date (August 14, 2026).
• This article names no individual properties and deals only with anonymized distributions and area aggregates. It does not address price or rate levels.
• Source: MetroEngines Research (continuous tracking of OTA public rates and inventory across approximately 168,000 properties in Japan)
- — Across 434 properties, median estimated OCC runs 57.5% at T-45, 65.5% at T-30, and 77.0% at T-15. Simply overlaying your own three readings on these lets you judge both pace and pattern.
- — Sell-through splits four ways. The front-loaded group at 10.8% (81.5% at T-45) and the late-surge group at 9.4% (56.6% at T-45) both land at 94.1% by T-15 — the end point alone cannot tell them apart.
- — The median gain from T-45 to T-15 is +17.4pt. But 22.4% gained under 10pt, 20.0% gained 30pt or more, and 8.1% went backwards — the average picture does not describe any individual property.
- — August 14’s elevation was built before T-45. The T-45 to T-30 gain lands at +4.6 to +5.4pt across all four Fridays in August, so the gap between dates was set by where each curve started.
- — The spread in ward-level medians narrows from 11.8pt at T-45 to 8.3pt at T-15. Ota Ward went from the lowest of the seven wards at 49.2% at T-45 to 73.8% on a +24.6pt gain — area strength is not settled at T-45.
Four Fridays in August — Only August 14 Stands Apart on Curve Height
Start with the shape of the market as a whole. August 2026 has four Fridays: the 7th, 14th, 21st, and 28th. Of these, the 14th is the last weekday of the Obon week that runs on from Mountain Day on Tuesday the 11th. Lined up by the same day of the week within the same month, the four booking curves separate cleanly by height.
Estimated OCC at 45 days before the stay date reads 65.5% for August 7, 72.4% for August 14, 69.4% for August 21, and 67.4% for August 28. August 14 is already the highest of the four dates at the T-45 entry point, 6.9pt above August 7. The ranking is unchanged at T-30, where August 14 sits at 77.2% against 70.1% for August 7, a 7.1pt gap. August 14’s latest observation (T-16) has reached 83.1%.
What is interesting is that the size of the gain from T-45 to T-30 is nearly identical across the four dates: +4.6pt for August 7, +4.8pt for August 14, +5.4pt for August 21, and +5.4pt for August 28. In other words, August 14’s elevation was essentially decided by the difference accumulated before T-45; how it grows after T-45 differs little from the other Fridays. It is not the slope of the curve but its starting level that creates the gap between dates.
Source: MetroEngines Research; compiled by the HotelBank Editorial Team
| Stay date | T-45 | T-30 | Latest observation | Days out at latest | Share of properties with no visible listed inventory (T-30) |
|---|---|---|---|---|---|
| Fri, Aug 7 | 65.5% | 70.1% | 79.8% | T-9 | 7.0% |
| Fri, Aug 14 | 72.4% | 77.2% | 83.1% | T-16 | 10.7% |
| Fri, Aug 21 | 69.4% | 74.8% | 77.8% | T-23 | 9.3% |
| Fri, Aug 28 | 67.4% | 72.8% | 72.8% | T-30 | 5.0% |
Tokyo, business hotels. Observed properties at each point N=820–867. Source: MetroEngines Research; compiled by the HotelBank Editorial Team
A second clue is the estimated share of properties with no visible listed inventory. For August 14 this runs 10.0% at T-45, 10.7% at T-30, and 11.0% at the latest T-16 reading — consistently around 10%. August 28, within the same month, sits at 5.0% at T-30, less than half of August 14. Not only on market-average OCC but also on the thickness of the “no sellable inventory visible” layer, August 14 behaves differently from the other Fridays.
The 434-Property Distribution — Median +17.4pt, Yet 8.1% Fell Below Their T-45 Level
From here we drop to the property level. Aggregating each of Tokyo’s 53 municipalities individually, inventory observations for August 14, 2026 at Tokyo business hotels were available for 873 of the 1,532 properties in scope. Excluding properties whose maximum observed listed inventory falls short of 30% of registered room count (properties where limited allotment distorts any reading of sell-through) leaves 498 properties as the analysis population. Narrowing further to properties observed at all three points — T-45, T-30, and T-15 — and whose listed inventory is consistent with registered room count yields the 434 properties used for the distribution. Because aggregation runs municipality by municipality, this is every property meeting the conditions, not a top-ranked subset.
Viewed by percentile, estimated OCC across these 434 properties looks as follows.
| Observation point | 25th percentile | Median | 75th percentile | 90th percentile | Interquartile range |
|---|---|---|---|---|---|
| T-45 | 43.8% | 57.5% | 70.2% | 79.2% | 26.4pt |
| T-30 | 52.5% | 65.5% | 75.7% | 87.0% | 23.2pt |
| T-15 (latest) | 66.2% | 77.0% | 86.5% | 94.1% | 20.3pt |
Tokyo, business hotels, N=434 properties. Source: MetroEngines Research; compiled by the HotelBank Editorial Team
Computing the gain property by property and taking the median gives +6.7pt from T-45 to T-30, +9.9pt from T-30 to T-15, and +17.4pt across the full T-45 to T-15 window. Growth is larger in the second half. At the same time the interquartile range contracts from 26.4pt to 23.2pt to 20.3pt, so dispersion between properties converges gently as the stay date approaches. Yet even after that convergence a 20pt band remains. Even at T-15, nearly 28pt separates the 25th percentile at 66.2% from the 90th percentile at 94.1%.
The distribution of the gains themselves is more scattered still. Against a median increase of +17.4pt in estimated OCC from T-45 to T-15, 22.4% (97 properties) gained under 10pt, 25.3% (110 properties) gained 10–20pt, 24.2% (105 properties) gained 20–30pt, and 20.0% (87 properties) gained 30pt or more. And 8.1% (35 properties) had a lower estimated OCC at T-15 than at T-45 — that is, listed inventory increased. The largest gain is +88.9pt and the smallest is −38.9pt, a span of roughly 128pt. It is safer to assume that the average picture — “the market adds about 10pt between T-30 and two weeks out” — applies to almost no individual property’s day-to-day work. How this dispersion varies by hotel type (business +25.7pt, city +14.5pt, capsule +1.9pt) is a separate question we have examined for the Tokyo market elsewhere.
Source: MetroEngines Research; compiled by the HotelBank Editorial Team
Counting properties by estimated OCC band makes the movement from T-45 to T-15 visible. Properties below 40% numbered 89 (20.5%) at T-45 but fall to 18 (4.1%) by T-15. Conversely, the 90%-and-above band grows eightfold, from 11 properties (2.5%) at T-45 to 88 (20.3%) at T-15. Taking 80% and above, the count moves from 42 properties (9.7%) at T-45 to 192 (44.2%) at T-15. On that arithmetic, more than four in ten Tokyo business hotels have sold 80% of their listed inventory two weeks before the stay date.
| Estimated OCC band | T-45 | T-30 | T-15 (latest) |
|---|---|---|---|
| Under 40% | 89 properties (20.5%) | 41 properties (9.4%) | 18 properties (4.1%) |
| 40% to under 60% | 149 properties (34.3%) | 125 properties (28.8%) | 57 properties (13.1%) |
| 60% to under 80% | 154 properties (35.5%) | 181 properties (41.7%) | 167 properties (38.5%) |
| 80% to under 90% | 31 properties (7.1%) | 62 properties (14.3%) | 104 properties (24.0%) |
| 90% and above | 11 properties (2.5%) | 25 properties (5.8%) | 88 properties (20.3%) |
Tokyo, business hotels, N=434 properties. Source: MetroEngines Research; compiled by the HotelBank Editorial Team
Sell-Through Splits Four Ways — Front-Loaded 10.8%, Late-Surge 9.4%
Percentiles alone do not reveal how the rooms sold. So we sorted the 434 properties into four patterns based on their T-45 level and their T-15 end point. The definitions: 70% or above at T-45 and 90% or above at T-15 is front-loaded; below 70% at T-45 but reaching 90% or above at T-15 is late-surge; below 60% at T-15 is low-sell-through; everything else is mid-range.
| Pattern | Properties (share) | T-45 | T-30 | T-15 | Gain (median across properties) | Median room count |
|---|---|---|---|---|---|---|
| Front-loaded | 47 properties (10.8%) | 81.5% | 88.4% | 94.1% | +13.4pt | 138 rooms |
| Late-surge | 41 properties (9.4%) | 56.6% | 74.2% | 94.1% | +39.0pt | 102 rooms |
| Mid-range | 271 properties (62.4%) | 58.3% | 66.1% | 76.8% | +17.0pt | 126 rooms |
| Low-sell-through | 75 properties (17.3%) | 33.9% | 40.5% | 50.0% | +13.7pt | 82 rooms |
Each figure is the median within the pattern. Tokyo, business hotels, N=434 properties. Source: MetroEngines Research; compiled by the HotelBank Editorial Team
Source: MetroEngines Research; compiled by the HotelBank Editorial Team
Three things stand out. First, the front-loaded and late-surge patterns share the same T-15 end point (94.1% for both). Watching only the final sell-through level, you cannot tell them apart. The dividing line is the T-45 level — 81.5% versus 56.6% — and unless you record that single point, you cannot determine which pattern your own property belongs to.
Second, the late-surge group’s gain of +39.0pt is roughly three times the front-loaded group’s +13.4pt. This is the layer carrying the heaviest inventory and pricing workload in the final two weeks. Its median room count of 102 is also smaller than the front-loaded group’s 138.
Third, the largest cohort is the mid-range group at 271 properties (62.4%), reaching 76.8% at T-15 — almost exactly the 77.0% overall median. This is where “normal” sits for Tokyo business hotels; climbing into the 90s remains the domain of roughly one property in five. For how the same August 14 date progressed at Osaka business hotels, see Osaka Business Hotels, Obon 2026: 74.6% on Aug 14 vs 63.7% on Aug 16.
Properties whose listed inventory hit zero at least once during the T-45 to T-15 observation window number 23 out of the 498-property analysis population (4.6%). The median days-out at which zero was first observed was T-33. The window is deliberately capped at T-45 through T-15 so that listings disappearing just after the stay date are not misread as sell-through. August 14 is a relatively strong date within the Tokyo business hotel market, but properties whose inventory vanishes early account for under 5% of the total; most carry inventory right up to the final stretch before the stay date.
Ward-Level Medians — Level at T-45, an 8.3pt Spread by T-15
Below are the median estimated OCC figures for the seven Tokyo wards with 15 or more properties in scope.
| Ward | Properties in scope | T-45 | T-30 | T-15 | T-45 to T-15 change |
|---|---|---|---|---|---|
| Chuo | 66 | 59.0% | 68.2% | 81.0% | +22.0pt |
| Taito | 87 | 57.4% | 63.2% | 78.8% | +21.4pt |
| Shinjuku | 33 | 59.0% | 67.9% | 77.3% | +18.3pt |
| Minato | 52 | 61.0% | 67.4% | 75.5% | +14.5pt |
| Chiyoda | 37 | 53.5% | 63.9% | 74.8% | +21.3pt |
| Ota | 25 | 49.2% | 61.2% | 73.8% | +24.6pt |
| Toshima | 26 | 55.5% | 67.8% | 72.7% | +17.2pt |
Tokyo, business hotels; only wards with 15 or more properties in scope. Stay date August 14, 2026. Source: MetroEngines Research; compiled by the HotelBank Editorial Team
At T-45, ward medians span 11.8pt, from Ota at 49.2% to Minato at 61.0%. By T-15 that narrows to 8.3pt, from Chuo at 81.0% down to Toshima at 72.7%. The ranking also reshuffles. Minato, the highest at T-45, drops to fourth by T-15, while Ota, the lowest at T-45, posts the largest gain of the seven wards at +24.6pt to reach 73.8%. Area “strength” is not settled by the T-45 level; it is only fixed once the final two weeks of accumulation are included.
For Revenue Managers Running Tokyo Business Hotels — Implications and an Action Plan
(1) Your pattern is determined by the T-45 level, not the end point. Front-loaded and late-surge properties both land at 94.1% at T-15. Looking only at the numbers just before the stay date, the two look identical. The dividing line is the gap between 81.5% and 56.6% at T-45. Recording your booking status at three points — T-45, T-30, and T-15 — and overlaying the market medians (57.5% / 65.5% / 77.0%) gives you a consistent yardstick for judging which pattern you are in, every time.
(2) The “+10pt in the two weeks after T-30” average does not describe your property. Gains from T-45 to T-15 scatter across roughly 128pt: 22.4% under 10pt, 20.0% at 30pt or more, and 8.1% negative. Rather than setting the market median of +17.4pt as your target line, it is more practical to first establish your own historical gain on comparable dates and then watch for deviation from that.
(3) August 14’s elevation was built before T-45. On the market curve, the T-45 to T-30 gain lands at +4.6 to +5.4pt across all four Fridays, so the gap between August 14 and August 7 (6.9pt at T-45, 7.1pt at T-30) was already settled before T-45. The more readable a date’s demand shape — as with Obon week — the more likely it is that the decisive groundwork happens earlier than T-45. Put the other way: once past T-45, the room to recover may be limited, and there is a case for shifting focus in the final two weeks to allocating remaining inventory and managing the landing.
(4) Area averages do not bite at T-45; they bite late. Ward medians span 11.8pt at T-45 and narrow to 8.3pt by T-15. Ota Ward was the lowest of the seven at 49.2% at T-45 yet added +24.6pt to reach 73.8%. A low T-45 level in neighboring areas does not necessarily mean demand is weak for that date. If you use area figures as a benchmark, it is reasonable to line them up through the latest observation, not just T-45.
| Time horizon | Action | Decision trigger (figures from this article) | Objective |
|---|---|---|---|
| Today to this week (two weeks to the stay date) | Sweep every room type for remaining August 14 inventory and check for allotments that are stopped or unlisted | Your T-15 estimate is below the 77.0% market median and you have added less than +17.4pt since T-45 | Land at the mid-range level (62.4% of properties, 76.8% at T-15) |
| Base final-two-week pricing on a sell-through pace of remaining inventory ÷ remaining days, and decide the size of your daily increments in advance | Narrow increments if you are tracking the late-surge trajectory (median gain +39.0pt); wider increments if you are on the low-sell-through trajectory (50.0% at T-15) | Shift last-minute decisions from case-by-case discretion to pre-set rules | |
| Within two weeks (toward August 21 and 28) | For August 21 and 28, compare your current progress against the market’s T-30 level | Market estimated OCC at T-30 is 74.8% for August 21 and 72.8% for August 28. Falling well short suggests delayed inventory release | Detect the post-Obon trough in advance rather than reacting to it late |
| Review inventory allocation by sales channel and check whether listed allotments have become extremely small relative to room count | Even in this article, 375 of 873 properties dropped out of the analysis on limited allotment (maximum listed inventory under 30% of registered room count) | Confirm that lost opportunity is not originating on the allocation side | |
| Toward next month (groundwork for September onward) | Build a fixed-point format that records T-45, T-30, and T-15, and keep it for every date | Include the market medians of 57.5% / 65.5% / 77.0% as reference lines | Make pattern identification repeatable on a single consistent yardstick |
| For dates with a readable demand shape (long weekends, event days), consider moving the starting point of your rate-revision calendar earlier than T-45 | The gap between August 14 and August 7 already stood at 6.9pt at T-45, and the T-45 to T-30 gain was an undifferentiated +4.6 to +5.4pt across all four dates | Avoid pushing the decisive groundwork too late |
Source: MetroEngines Research; compiled by the HotelBank Editorial Team
Conclusion — Three Yardsticks
Yardstick 1: the three points T-45, T-30, and T-15. Median estimated OCC across 434 Tokyo business hotels runs 57.5% / 65.5% / 77.0%. Overlaying these three numbers on your own three readings is enough to judge both pace and pattern. A single end point cannot separate front-loaded (81.5% at T-45) from late-surge (56.6% at T-45).
Yardstick 2: the distribution behind the +17.4pt gain. The median gain from T-45 to T-15 is +17.4pt, but 22.4% gained under 10pt, 20.0% gained 30pt or more, and 8.1% went negative. Do not target the average picture — benchmark against your own historical gains.
Yardstick 3: movement between bands. Properties at 80% or above estimated OCC moved from 42 (9.7%) at T-45 to 192 (44.2%) at T-15, and those at 90% or above from 11 (2.5%) to 88 (20.3%). Meanwhile, only 23 of the 498-property analysis population (4.6%) saw listed inventory hit zero at any point between T-45 and T-15. Most Tokyo business hotels enter the final stretch still holding inventory two weeks before the stay date.
About the Data
- Definition of estimated OCC (OTA-listed inventory basis): OTA-listed inventory occupancy rate = 100 − 100 × OTA-listed remaining rooms ÷ total rooms. It is an estimate based on how inventory listed on OTAs is being consumed, and is defined differently from actual room occupancy (it reads higher).
- Booking curve: based on observations from 45 days before the stay date through the most recent reading.
- Definition of estimated settled ADR (no figures are used in this article): the settled rate level (pre-tax equivalent) estimated from sales data such as OTAs (lowest-plan level × hotel-type coefficient, ensembled across multiple channels). Past months are confirmed values; the current and future months are estimates based on current sales conditions. Median error versus published operating results is 6.6%.
- Breakdown of N: the market curve covers observed Tokyo business hotels at N=820–867 properties (varying by observation point). The property-level distribution starts from 1,532 properties in scope across Tokyo’s 53 municipalities aggregated individually, of which 873 had inventory data; excluding properties whose maximum observed listed inventory falls short of 30% of registered room count leaves 498; narrowing to properties observed at all three points (T-45, T-30, T-15) with listed inventory consistent with registered room count gives N=434. Ward-level aggregates cover only the seven wards with 15 or more properties in scope.
- On sell-out references: “share of properties with no visible listed inventory” is an estimate of the share of properties whose listed inventory cannot be confirmed on OTAs and similar channels. Property-level zero-inventory observations are aggregated only within the T-45 to T-15 observation window.
- This article names no individual properties and deals only with anonymized distributions and area aggregates.
- Data as of July 31, 2026. Because sales conditions and inventory change daily, the figures here are a snapshot as of that point.
References and Sources
■ Data source
OTA public inventory and rate data continuously collected by MetroEngines Research (covering approximately 168,000 properties in Japan). For Tokyo business hotels and the stay date of Friday, August 14, 2026, property-level observations were built up by aggregating each of Tokyo’s 53 municipalities individually. The market-wide booking curve covers observed properties in the same prefecture and hotel type at N=820–867 (varying by observation point); the property-level distribution covers N=434 properties observed at all three points. Data as of July 31, 2026.
■ Estimation assumptions
Estimated OCC = 100 − 100 × OTA-listed remaining rooms ÷ total rooms. “T-45,” “T-30,” and “T-15” refer to the number of days remaining until the stay date. Properties whose maximum observed listed inventory falls short of 30% of registered room count are excluded from the analysis population, because limited allotment distorts any reading of sell-through (375 of the 873 properties with inventory data fell into this category). The four sell-through patterns are defined as follows: 70% or above at T-45 and 90% or above at T-15 is front-loaded; below 70% at T-45 and 90% or above at T-15 is late-surge; below 60% at T-15 is low-sell-through; everything else is mid-range.
■ Limitations and caveats
(1) Estimated OCC is an estimate based on how inventory listed on OTAs is being consumed, and is defined differently from actual room occupancy (it reads higher). (2) Because the population is assembled by stacking individual municipality-level aggregates, it does not match the property count returned by a single prefecture-level query under the same conditions (on the order of 800 properties). Figures compiled at different aggregation units cannot be compared directly. (3) The number of properties with retrievable inventory varies by observation point, so the market curve’s N ranges from 820 to 867 depending on the point; thin cross-sections can distort the shape of the distribution. (4) Zero-inventory observations are confined to the T-45 to T-15 window, so listings disappearing just after the stay date are not reinterpreted as sell-through. (5) This article is a snapshot of a single stay date and cannot be generalized to other dates, areas, or hotel types.
・Cabinet Office, “About National Holidays” https://www8.cao.go.jp/chosei/shukujitsu/gaiyou.html (Mountain Day in 2026 falls on Tuesday, August 11)
Related Reading
- Osaka Business Hotels, Obon 2026: 74.6% on Aug 14 vs 63.7% on Aug 16
- Osaka Obon 2026 Booking Curve: Aug 14 at 74.9%, Aug 16 Stuck at 64.1%
- Tochigi Booking Curves by Type: Resort 81.1% at T-45, Only +2.6pt Left
- 94.5% Sold 45 Days Out: Omagari Fireworks vs a Normal Akita Weekend
- Awaodori 2026: 98.8% Sold 45 Days Out — 39.4pt Over Normal Weekends