

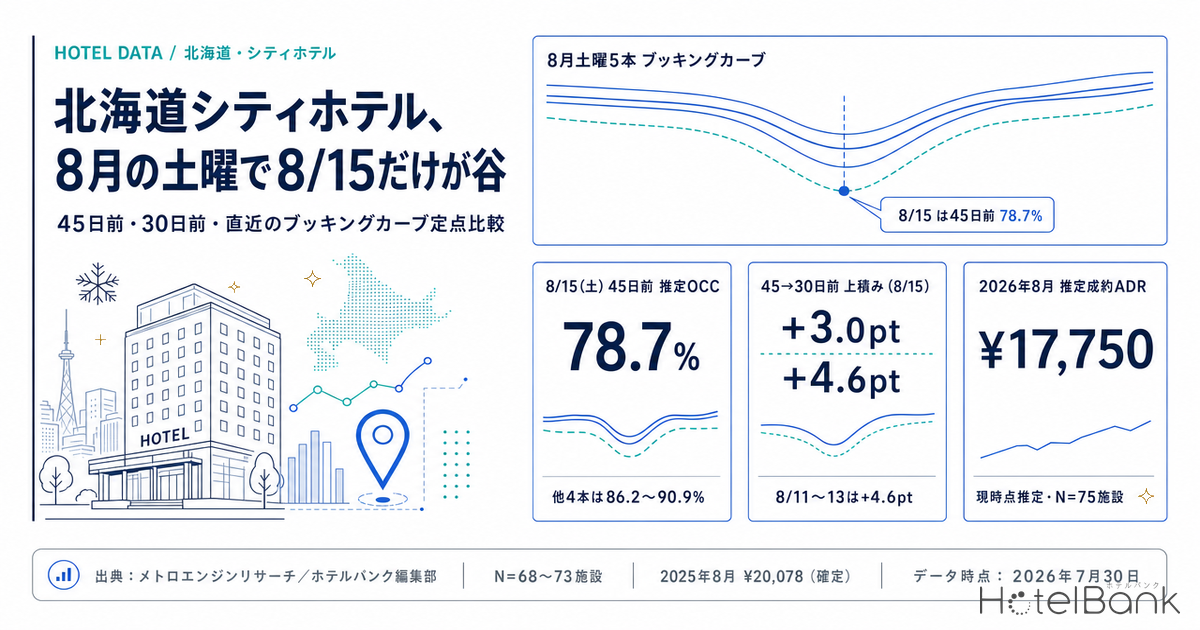
For city hotels in Hokkaido, August is one of the strongest demand months of the year. Yet when the stay dates in August 2026 are lined up against the same yardstick — the reading taken 45 days before the stay date — only one of the five Saturdays stands apart: Saturday, August 15 at an estimated OCC of 78.7% (arrival 15 August 2026, as of 45 days before the stay date), some 7 to 12 points below the other four (86.2–90.9%). What is more, the gain from 45 days out to 30 days out was just +3.0 points for August 15, below the +4.3 points of Saturday, August 8 and the +4.6 points of August 11–13. This is not a trough that fills in later; it is a trough where the pace itself is slow. This article cuts the booking curve for Hokkaido city hotels at three fixed points — 45 days out, 30 days out, and the latest observation — and compares the August stay dates side by side.
Scope: Hokkaido, city hotels, N=68–73 properties (varies by stay date; listed room scale 15,266–15,815 rooms). The estimated settled ADR covers N=75 properties. The price metric in this article is the estimated settled ADR (the settled price level inferred from OTA and other sales data, on a tax-exclusive basis); occupancy is an estimate based on OTA-listed inventory. Definitions for both appear at the end of the article. Data as of 30 July 2026.
- — Lining up the five August Saturdays at 45 days before the stay date, only August 15 sits at an estimated OCC of 78.7% (arrival 15 August 2026, at the 45-day point) — 7.5 to 12.2 points below the other four (86.2–90.9%).
- — The gain from 45 to 30 days out was just +3.0 points for August 15, below the +4.6 points of August 11–13. This is not a trough in level but a trough in pace.
- — On a single observation date (28 July 2026), the cross-section reads Thursday, August 13 at 92.9% > Friday, August 14 at 89.8% > Saturday, August 15 at 85.1% > Sunday, August 16 at 83.6%. In Obon week the peak is Thursday and the trough is the weekend.
- — A second peak arrives late in the month. At 45 days out, August 22 stands at 86.8% and August 29 at 88.6%, and for August 29 the estimated share of properties with no confirmable listed inventory reaches 27.4% — level with August 8’s 27.8% and the highest among the 13 stay dates.
- — On price, finalized figures moved from ¥17,192 in August 2024 to ¥20,078 in August 2025 (+16.8%), but 2026 has posted three consecutive year-on-year declines: −0.9% in April, −1.4% in May and −3.6% in June. The ¥17,750 figure for August 2026 is a current-point estimate; any comparison with finalized values must wait for month-end.
Line up the five August Saturdays at 45 days out and only August 15 breaks ranks
We begin by overlaying the estimated OCC (OTA-listed-inventory basis) for the five Saturdays in August, from 45 days before the stay date through to the latest observation. The horizontal axis is the number of days remaining until the stay date; moving right brings us closer to the stay date.
Source: Compiled by the HotelBank Editorial Team from MetroEngines Research
At the 45-day point, the five Saturdays ranked as follows: August 1 at 90.9%, August 29 at 88.6%, August 22 at 86.8%, August 8 at 86.2%, and August 15 at 78.7%. The top four fall within a 4.7-point band, while August 15 sits a further 7.5 points below the lowest of them, August 8. The Saturday that falls in the middle of Obon turns out to be the weakest — the opposite of intuition.
More important is the slope of the curve. Over the 15 days from 45 to 30 days out, August 8 built from 86.2% to 90.5% (+4.3 points) and August 22 from 86.8% to 89.2% (+2.4 points). August 15 moved from 78.7% to 81.7% — a gain of +3.0 points. Even though its absolute level is roughly 10 points lower, the size of its gain is little different from the other dates, so the gap is closing in on the stay date without narrowing. At the latest observation (28 July 2026, 18 days remaining) it stood at 85.1%, still 10.1 points behind August 8 (11 days remaining) at 95.2% on the same observation date.
From another angle, the estimated share of properties whose listed inventory could not be confirmed on OTAs and similar channels, measured at the 45-day point, was 27.8% for August 8, 27.4% for August 29, 23.3% for August 22 and 22.2% for August 1 — against 17.8% for August 15. The pattern typical of a peak date, where inventory at the stronger properties disappears first, was comparatively weak for August 15 as of 45 days out.
Obon week peaks on Thursday and troughs on the weekend — a fixed-point comparison across 13 dates
Looking only at Saturdays leads to a misreading of the structure. The table below sets out three fixed points — 45 days out, 30 days out and the latest observation — for 13 stay dates, adding the weekdays of Obon week and representative Wednesdays in August.
| Stay date (August 2026) |
Day | 45 days out Est. OCC (August 2026 arrivals) |
30 days out Est. OCC (August 2026 arrivals) |
Gain, 45 → 30 days out |
Latest observation Est. OCC |
Latest observation days remaining |
N= |
|---|---|---|---|---|---|---|---|
| August 1 | Sat | 90.9% | 93.3% | +2.4pt | 95.0% | 4 days | 71 |
| August 5 | Wed | 80.6% | 84.8% | +4.2pt | 89.7% | 8 days | 72 |
| August 8 | Sat | 86.2% | 90.5% | +4.3pt | 95.2% | 11 days | 68 |
| August 11 | Tue | 83.9% | 88.5% | +4.6pt | 92.0% | 14 days | 72 |
| August 12 | Wed | 83.3% | 87.9% | +4.6pt | 91.5% | 15 days | 72 |
| August 13 | Thu | 85.1% | 89.7% | +4.6pt | 92.9% | 16 days | 73 |
| August 14 | Fri | 82.4% | 86.7% | +4.3pt | 89.8% | 17 days | 72 |
| August 15 | Sat | 78.7% | 81.7% | +3.0pt | 85.1% | 18 days | 70 |
| August 16 | Sun | 79.2% | 81.7% | +2.5pt | 83.6% | 19 days | 73 |
| August 19 | Wed | 82.6% | 85.2% | +2.6pt | 87.2% | 22 days | 71 |
| August 22 | Sat | 86.8% | 89.2% | +2.4pt | 89.7% | 25 days | 68 |
| August 26 | Wed | 81.6% | 83.2% | +1.6pt | 83.5% | 29 days | 73 |
| August 29 | Sat | 88.6% | — | — | 90.1% | 32 days | 70 |
Estimated OCC = an estimate based on OTA-listed inventory. All latest observations are as of 28 July 2026. August 29 is shown as “—” because the observation 30 days before the stay date is not yet available. Source: Compiled by the HotelBank Editorial Team from MetroEngines Research
Source: Compiled by the HotelBank Editorial Team from MetroEngines Research
The shape of Obon week that emerges from this table is unambiguous. Taking the cross-section on a single observation date (28 July 2026) and lining up the four dates whose days remaining are roughly aligned, we get Thursday, August 13 at 92.9%, Friday, August 14 at 89.8%, Saturday, August 15 at 85.1% and Sunday, August 16 at 83.6% — a staircase descending from a Thursday peak towards the weekend. August 11 at 92.0%, which includes Mountain Day (Tuesday, 11 August 2026), and August 12 at 91.5% are also high, giving a structure in which demand in Obon week is concentrated in the first half, with the following weekend clearly easing. A Thursday peak with a softer weekend is not unique to Obon week in Hokkaido: the same day-of-week shape — a Thursday peak and a Sunday trough — has also been observed among business hotels in Aichi and Hiroshima.
This has a natural explanation in travel and homecoming patterns. Those who begin their break on Mountain Day stay from August 11 through 13, while August 15 and 16 fall on the return leg or the tail end of a stay, leaving demand for city hotels in Hokkaido’s urban centres relatively thin. Put the other way round, building a rate calendar on the assumption that “Obon means Saturday is strongest” would set the highest rates precisely on August 15 and 16.
The recovery towards month-end also deserves attention. August 22 starts from 86.8% at 45 days out and August 29 from 88.6% — both above the Saturdays of Obon week. For August 29, the estimated share of properties with no confirmable listed inventory on OTAs and similar channels stood at 27.4% at the 45-day point, level with August 8’s 27.8% and the highest among the 13 dates, and it reached 90.1% at the latest observation (32 days remaining). The peak of summer demand does not end in mid-August: there is a second peak on the late-month weekends — that is the shape of the Hokkaido city hotel market in August 2026.
The comparison of the three Wednesdays reinforces the same conclusion. August 5 rose from 80.6% at 45 days out to 89.7% at the latest observation (8 days remaining), a gain of +9.1 points; August 19 from 82.6% to 87.2% (22 days remaining), +4.6 points; and August 26 from 81.6% to 83.5% (29 days remaining), +1.9 points. Because the days remaining differ, the end points cannot be compared directly, but the starting levels on weekdays all fall within the low 80% range — showing that what determines the strength of demand is less the day of the week than whether the date falls in the first half of Obon, or on a late-month weekend.
Where will August 15 land? A range back-calculated from actuals in the same market over the remaining 18 days
So far this is an observation that “August 15 is weak”. What practice requires is the next step — an estimate of where it will actually land. Using as a reference set the stay dates in July 2026 for the same Hokkaido city hotel market, whose curves have already closed, we can measure the observed size of the gain from a given level at 18 days remaining.
Of the 31 stay dates in July 2026, we extract the eight stay dates whose estimated OCC at 18 days remaining fell between 83% and 88% — the same band as August 15’s 85.1% — and measure the gain from that point to the final observation: a minimum of +2.6 points, a median of +4.9 points and a maximum of +6.3 points. Applying these to August 15’s 85.1% gives the following landing range.
| Scenario | Basis (observed gain in July 2026) | Gain from 18 days remaining to final |
Landing estimated OCC for August 15 |
|---|---|---|---|
| Pessimistic | Minimum of the eight stay dates (20 July = +2.6pt) | +2.6pt | 87.7% |
| Central | Median of the eight stay dates | +4.9pt | 90.0% |
| Optimistic | Maximum of the eight stay dates (22 July = +6.3pt) | +6.3pt | 91.4% |
The reference set comprises stay dates in July 2026 in the same area and same property category whose curves have closed. The gain is the difference in estimated OCC from 18 days remaining to the final observation. Source: Compiled by the HotelBank Editorial Team from MetroEngines Research
The point to note is that even the optimistic scenario stops at 91.4%. Saturday, August 8 had already reached 95.2% with 11 days remaining, leaving a gap of roughly 5 points against the central scenario of 90.0%. The 7.5-point gap that opened up at 45 days out is unlikely to be fully closed by a late run from 18 days remaining — that is how this range should be read. If the decision is to “wait, because it will fill up at the last minute”, the basis for it needs to be property-specific circumstances rather than a market-wide surge.
There is a further implication in how the reference set had to be chosen. The four Saturdays in July 2026 were already high at 18 days remaining, at 92.5–96.8%, and their subsequent gains were limited to +0.4 to +3.0 points, because the ceiling was close. In other words, not a single Saturday in July started from a level like 85.1%. August 15 is better treated not as “a Saturday that got off to a slow start” but as a stay date rising from the same band as a weekday — that is closer to the observed behaviour.
The seasonal shape of estimated settled ADR — August is the annual peak, but 2026 finalized values have fallen year on year since spring
We now lay a price yardstick over the occupancy picture. Viewing the estimated settled ADR for Hokkaido city hotels (N=75 properties) with the years overlaid, August has been the annual peak in each of the past two years.
Source: Compiled by the HotelBank Editorial Team from MetroEngines Research
On finalized figures, August 2024 came in at ¥17,192 (N=75 properties) and August 2025 at ¥20,078 (N=74 properties). Both were the highest month of their respective years, and the year-on-year change between finalized values was +16.8%. Hokkaido is distinctive in having a second peak in February (¥17,410 → ¥18,171), but August is a clearly higher single-month peak.
The sequence of finalized months in 2026, however, is not a simple upward march. Comparing finalized values year on year gives +29.4% in January (¥11,324 → ¥14,658), +4.4% in February (¥17,410 → ¥18,171) and +8.4% in March (¥10,939 → ¥11,858) — growth through the winter — while April came in at −0.9% (¥9,820 → ¥9,728), May at −1.4% (¥13,738 → ¥13,551) and June at −3.6% (¥15,356 → ¥14,796), three consecutive months below the prior year. What the finalized values show is that the momentum of the growth rate reversed in the first half of the year. Monthly rate movements in business-travel cities including Sapporo have been tracked over a continuous 25-month series.
| Month | 2025 Est. settled ADR |
2026 Est. settled ADR |
YoY | Basis |
|---|---|---|---|---|
| January | ¥11,324 | ¥14,658 | +29.4% | Finalized × Finalized |
| February | ¥17,410 | ¥18,171 | +4.4% | Finalized × Finalized |
| March | ¥10,939 | ¥11,858 | +8.4% | Finalized × Finalized |
| April | ¥9,820 | ¥9,728 | −0.9% | Finalized × Finalized |
| May | ¥13,738 | ¥13,551 | −1.4% | Finalized × Finalized |
| June | ¥15,356 | ¥14,796 | −3.6% | Finalized × Finalized |
| August | ¥20,078 (finalized) | ¥17,750 (current-point estimate) | — | Not calculated because the bases differ |
January 2025 through June 2026 are all finalized values (N=73–76 properties). August 2026 covers N=75 properties and is an estimate based on current sales conditions; a simple comparison with finalized values must wait for month-end. Source: Compiled by the HotelBank Editorial Team from MetroEngines Research
The estimated settled ADR for August 2026 is ¥17,750 (N=75 properties), an estimate based on current sales conditions. It may move with future sales, and it is calculated on a different basis from the finalized ¥20,078 of August 2025. The two cannot be placed side by side to compute a year-on-year change. The correct reading is to wait for the month-end close before comparing with finalized values. That said, the run of year-on-year declines from April to June on a finalized-to-finalized basis is context that cannot be ignored when thinking about price management in August.
For revenue managers running city hotels in Hokkaido — implications and an action plan
(1) Test the assumption that “Obon means Saturday is strongest” against your own rate calendar. The market cross-section (as of 28 July 2026) read Thursday, August 13 at 92.9%, Friday, August 14 at 89.8%, Saturday, August 15 at 85.1% and Sunday, August 16 at 83.6% — descending from a Thursday peak. If your rates for August 13–16 are still built on a day-of-week template in which Saturday carries the highest price, they may be out of step with the shape of the market. Simply confirming the direction of that mismatch changes what can be done in the remaining two weeks.
(2) Treat August 15 as a trough in pace, not a trough in level. The gain from 78.7% at 45 days out to 81.7% at 30 days out was +3.0 points, below the +4.6 points of August 11–13. If only the level were low there would be room for a last-minute rush to fill it, but when the pace is also slow the case for waiting on the same assumption weakens. It is worth checking whether bookings for your own August 15 are building at the same slope as August 13.
(3) Consider holding inventory for late August as “the second peak”. August 22 started from 86.8% at 45 days out and August 29 from 88.6% — well above the Obon-week Saturday of August 15 at 78.7%. For August 29, the estimated share of properties with no confirmable listed inventory stood at 27.4% at the 45-day point, level with August 8’s 27.8% and the highest among the 13 dates. Concentrating attention on Obon and releasing late-month inventory early risks leaving this peak on the table.
(4) Hold your price yardstick as a monthly estimated settled ADR. The market’s estimated settled ADR for August 2026 is ¥17,750 as a current-point estimate (N=75 properties). If your own average rate in August — the annual peak — sits well away from this level, it is worth separating whether that gap is an intended strategy or simply the output of a day-of-week template. Note, though, that this is a current-point estimate that may move, and comparison with finalized values should wait for month-end.
The following is an action plan by time horizon, taking 30 July 2026 as the starting point. None of these are claims that “doing this will definitely improve results”; they are an attempt to translate the data in this article into material for your own decisions.
| Horizon | Action | Decision trigger (figures from this article) | Purpose |
|---|---|---|---|
| Today – this week | Write out your own rate ranking (highest first) for the four days of August 13–16 and match it against the market ranking | On a single cross-section the market reads 8/13 92.9% > 8/14 89.8% > 8/15 85.1% > 8/16 83.6%. If your highest rate falls on 8/15, check it | Make the gap between a day-of-week template and the shape of demand visible |
| Today – this week | For inventory on August 15 and 16, identify where non-price levers (consecutive-night conditions, minimum length of stay, cancellation terms) could be relaxed | The gain for 8/15 from 45 to 30 days out was +3.0pt, below the +4.6pt of 8/11–13 | Remove the constraints losing demand before going straight to a rate cut |
| Within two weeks | Switch to tracking remaining rooms for August 15 and 16 by the slope on a days-remaining axis rather than by daily absolute counts | 8/15 stood at 85.1% at the latest observation (18 days remaining); the gap to 8/8 (11 days remaining) at 95.2% on the same date is 10.1pt | Judge whether a last-minute rush is coming by the slope rather than by feel |
| Within two weeks | For the high-occupancy band of August 11–13, decide the floor rate in advance in case remaining rooms are heavier than expected | The market reads 8/11 92.0%, 8/12 91.5% and 8/13 92.9% (all at 14–16 days remaining) — a high level | Keep last-minute decisions from becoming ad hoc by moving within a pre-agreed floor |
| Looking to next month | Treat August 22 and 29 as weekends in their own right rather than the tail end of Obon, and review the pace at which inventory is released | At 45 days out, 8/22 is at 86.8% and 8/29 at 88.6%, well above 8/15’s 78.7%. For 8/29 the estimated share of properties with no confirmable listed inventory is 27.4% (level with 8/8’s 27.8%, the highest) | Avoid destroying the late-month peak through early discounting |
| Looking to next month | Once August 2026 results are finalized, make it routine to check your own August average rate against the market’s estimated settled ADR | The market figure for August 2026 is a current-point estimate of ¥17,750 (N=75 properties); comparison with finalized values must wait for the month-end close | Track your position against the seasonal shape continuously, rather than reacting to a single month |
Source: Compiled by the HotelBank Editorial Team from MetroEngines Research
Conclusion — three yardsticks for reading Hokkaido city hotels in August
Yardstick 1: Cut by “first half vs second half of Obon”, not by day of week
On a single observation date the cross-section reads Thursday, August 13 at 92.9%, Saturday, August 15 at 85.1% and Sunday, August 16 at 83.6%. A staircase descending from a Thursday peak cannot be reproduced by a day-of-week rate calendar. In years when demand clusters in the first half — the half that includes Mountain Day (Tuesday, 11 August 2026) — the relative positions of weekdays and weekends switch places.
Yardstick 2: Judge a trough by slope, not by level
With two points — 45 days out and 30 days out — the size of the gain (the difference in points) can be calculated. August 15 gained +3.0 points, August 11–13 +4.6 points and August 26 +1.6 points. Where the level is low but the slope is steep there is room to fill; where both level and slope are weak, a different lever is needed. That is the distinction this allows.
Yardstick 3: Hold your price position against a monthly estimated settled ADR
On finalized figures the market grew from ¥17,192 in August 2024 to ¥20,078 in August 2025 (+16.8%), yet in 2026 the year-on-year change for finalized months has turned negative — −0.9% in April, −1.4% in May and −3.6% in June. The current-point estimate for August 2026 is ¥17,750 (N=75 properties), and comparison with finalized values must wait for month-end. Rather than reacting to a single month’s number, tracking where your property sits against the seasonal shape on a multi-year view is what pays off when preparing for next August.
About the data in this article
■ Data sources
- Definition of estimated OCC (OTA-listed-inventory basis): occupancy on an OTA-listed-inventory basis = 100 − 100 × rooms remaining on OTA listings ÷ total rooms. It is an estimate based on how listed inventory is being sold down on OTAs, and its definition differs from actual room occupancy (it reads higher). The target month for this article is August 2026; the observation windows are as set out below.
- Booking curve: based on observations from 45 days before the stay date through to the latest reading.
- Definition of estimated settled ADR: the settled price level (tax-exclusive basis) inferred from OTA and other sales data (lowest-plan level × category coefficient, ensembled across multiple channels). Past months are finalized values; the current and future months are estimates based on current sales conditions. Median error versus publicly disclosed operating results is 6.6%.
- Breakdown of N: for the booking curve, Hokkaido city hotels at N=68–73 properties per stay date (listed room scale 15,266–15,815 rooms). For the estimated settled ADR, Hokkaido city hotels (verified category) at N=75 properties (August 2026), with N=73–76 properties for each month from January 2024 to June 2026 used in the comparison.
■ Assumptions
- Public holidays in 2026 follow the data published by the Cabinet Office in “National Holidays” (11 August 2026 = Mountain Day).
- Assumptions for the landing range (Table 4): of the stay dates in July 2026 in the same area and property category whose curves have closed, the eight stay dates with an estimated OCC of 83–88% at 18 days remaining were used as the reference set, and the minimum, median and maximum gain from that point to the final observation were added to August 15’s 85.1%. The reference set does not include Obon, so differences in seasonality are not factored in.
■ Limitations and caveats
- The “share of properties whose listed inventory could not be confirmed on OTAs and similar channels” is an estimate; it does not verify that each property was actually sold out.
- Data as of 30 July 2026. Sales conditions and inventory change daily, so the figures in this article are a snapshot as at the time of retrieval. All latest booking-curve observations are as of 28 July 2026.
- The share of properties with no confirmable listed inventory, and the target N, vary with the point of re-retrieval even for the same stay date and the same days remaining, because observed properties are added on an ongoing basis. The values in this article were re-retrieved as at the data date above.
References and sources
- Cabinet Office, “National Holidays” (Japanese) (used to confirm 11 August 2026 = Mountain Day)