

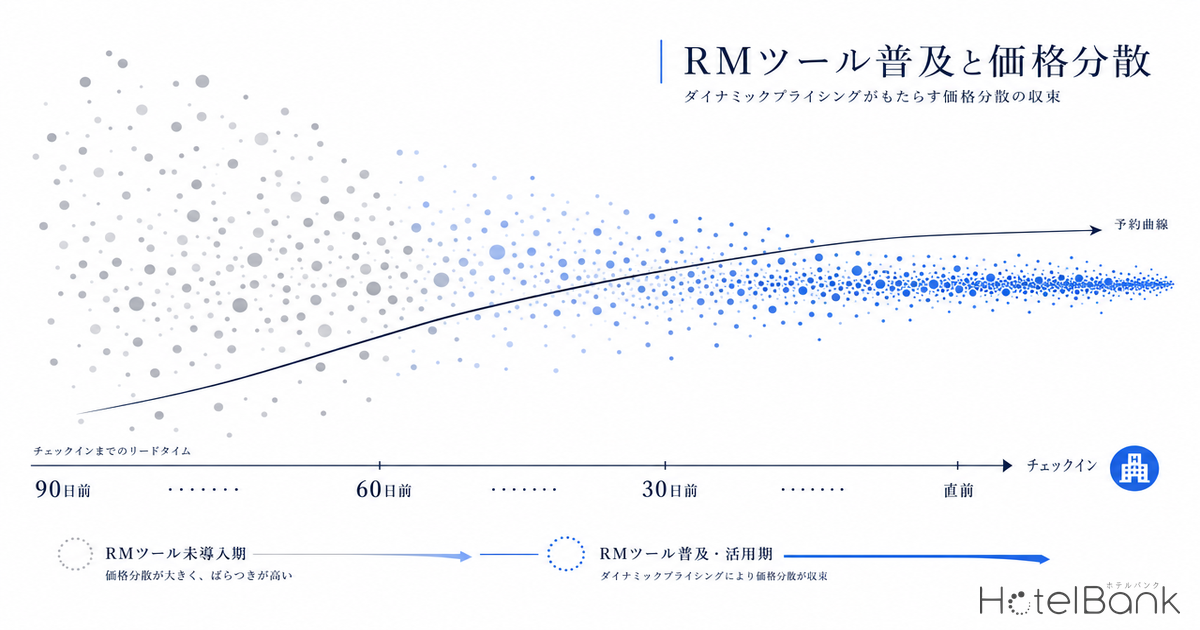
Revenue management (RM) tools and dynamic pricing were once the preserve of major chains and large properties held by listed REITs, but in recent years they have spread into a realistic option even for small and mid-sized lodging operators. As more properties move prices in line with demand, how does the market’s “price dispersion” change? Drawing on MetroEngines Research’s OTA public-price data and booking curves, this article quantifies ADR variability (coefficient of variation) and price dispersion by day-of-week and lead time, broken down by area × hotel type for Tokyo and Osaka, to read how RM adoption is reshaping market structure.
Metric Definitions Used in This Article
- ADR (Average Daily Rate): The average of selling prices published on OTAs and similar channels. This differs from actual transacted prices (when cross-checked against REIT disclosures, published ADR tends to run +25–30% above transacted ADR. Because unsold higher-priced plans remain listed on OTAs, the average of published prices is structurally pushed above the transacted price). Per-room rate for double occupancy (tax included), averaged across all plans (from room-only to meal-inclusive plans).
- Coefficient of Variation (CV): An indicator of ADR variability across properties, calculated as standard deviation ÷ mean × 100 (%). The larger the value, the wider the range of pricing across individual properties within the same area and hotel type.
- OCC (Occupancy Rate): The share of sold rooms against the total room count in an area (an estimate based on OTA sales inventory).
- Data Source: MetroEngines Research
- — The spread of RM tools into smaller properties is causing market price dispersion (ADR coefficient of variation) to behave differently across hotel types and areas.
- — Even within the same area, ADR variability differs sharply by hotel type. The more demand-responsive a segment’s pricing becomes, the wider its day-of-week and lead-time gaps grow.
- — Booking-curve analysis by lead time shows that RM maturity reveals itself in how well a property controls price in the final weeks before check-in.
- — Tokyo and Osaka have different dispersion structures; each city’s characteristics define the room available for price management.
- — REIT-disclosed, transaction-based results (e.g. Invincible OCC 85.8% in April 2026) illustrate the endpoint of occupancy × rate optimization reached by mature, large-property portfolios.
RM adoption among smaller properties as the starting point
RM (revenue management) refers to the management practice of forecasting future demand from past sales data and market trends, and controlling room selling prices and inventory to maximize revenue. Dynamic pricing, its tactical arm, is the mechanism that moves prices in real time in response to demand, inventory, day of week, and competitor moves. According to explanations from industry players, AI utilization that was once limited to advanced efforts by a handful of major operators has, in recent years, become a realistic option that small and mid-sized lodging properties are increasingly adopting.
Adoption generally progresses in stages. Properties typically start with a rule-based approach (manual or semi-automatic price adjustments tied to day of week and remaining rooms), then shift over six months to a year toward AI-forecast or hybrid models — a path widely recognized as a reproducible adoption route. In other words, the advance of RM adoption passes through a state in which “properties that move prices” and “properties that keep running close to fixed rates” coexist, gradually changing the price behavior of the market as a whole. This article quantifies how that change shows up on top of public-price data, through the lens of price dispersion.
Area ADR is rising, but the movement differs by hotel type
First, let us confirm the overall market backdrop. Plotting the monthly ADR trends for Tokyo and Osaka as a year-over-year overlay, both are running above the same month a year earlier — a phase in which pricing latitude is increasing. As of May 2026, Tokyo stood at ¥34,400 (+4.7% YoY) and Osaka at ¥26,300 (+6.2% YoY). An upward trend in which prices are easy to move means the environment in which RM tools can deliver results is steadily falling into place.
Source: MetroEngines Research, prepared by the HotelBank Editorial Team
Behind this market average, however, lies a large difference in how prices are moved by hotel type. Segments that move prices nimbly in response to demand coexist with segments that remain on relatively fixed pricing — and that is precisely where the room for growth from RM adoption comes into view. In the sections that follow, we quantify that gap from three angles: variability across properties, day-of-week gaps, and lead time.
Price dispersion by hotel type — variability differs greatly even within the same area
Even within the same Tokyo area and the same hotel type, public prices vary across properties. The table below aggregates property-level ADR and the coefficient of variation (CV) by hotel type for the Obon peak date (Saturday, August 15, 2026). A larger CV indicates a wider range of pricing across properties within that segment — that is, greater diversity of pricing strategy.
| Hotel type | Properties | Avg. ADR | Coefficient of variation (CV) |
|---|---|---|---|
| Ryokan | 61 | ¥43,900 | 88.2% |
| Resort hotel | 19 | ¥64,600 | 75.5% |
| City hotel | 114 | ¥61,600 | 63.2% |
| Business hotel | 938 | ¥30,100 | 50.7% |
| Deluxe hotel | 55 | ¥118,600 | 44.2% |
Scope: Tokyo, check-in August 15, 2026, N=1,236 properties (only hotel types with 10+ properties shown) / Source: MetroEngines Research, prepared by the HotelBank Editorial Team
What stands out is the gap in the coefficient of variation between hotel types. Ryokan (CV 88.2%) and resort hotels (75.5%) show large variability across properties, while business hotels (50.7%) and deluxe hotels (44.2%) are relatively tightly clustered. The small dispersion in the deluxe tier likely reflects not only inherently high rates with a limited price range, but also mature RM operation centered on large properties, where a “template” for demand-responsive pricing has converged within the area.
Conversely, segments with large dispersion — such as ryokan and resorts — still hold considerable room to optimize pricing, that is, substantial potential for revenue expansion through RM adoption. If small and mid-sized ryokan use tools to advance demand-linked pricing, they may be able to draw a smoother price curve that captures more during peak periods while lifting demand in the off-season.
Source: MetroEngines Research, prepared by the HotelBank Editorial Team
The “power to move prices” seen in day-of-week gaps differs by hotel type
The clearest single signal of how deeply RM operation has taken hold is the price gap between weekdays and weekends. Whether a property can firmly raise prices on high-demand weekends reflects the skill of its price control. Comparing hotel-type ADR in Tokyo on a weekday (Tuesday, July 7, 2026) and a weekend (Saturday, July 11, 2026) reveals a clear hierarchy.
| Hotel type | Weekday ADR (Tue) | Weekend ADR (Sat) | Weekend premium |
|---|---|---|---|
| Ryokan | ¥43,200 | ¥68,000 | +57.3% |
| Business hotel | ¥26,300 | ¥38,300 | +45.6% |
| Resort hotel | ¥65,300 | ¥87,400 | +33.9% |
| City hotel | ¥54,600 | ¥68,700 | +25.8% |
| Deluxe hotel | ¥95,600 | ¥112,300 | +17.5% |
Scope: Tokyo, Tuesday July 7, 2026 vs Saturday July 11, 2026 / Source: MetroEngines Research, prepared by the HotelBank Editorial Team
Ryokan (+57.3%) and business hotels (+45.6%) raise prices substantially on weekends, suggesting demand-linked pricing is functioning. The smaller day-of-week gap for deluxe hotels (+17.5%), by contrast, reflects a structural difference: they tend to sustain high occupancy on weekdays as well from business and inbound demand, so the demand trough by day of week is inherently shallow. The size of the weekend premium is not a matter of superior or inferior; it is better read as a difference in pricing strategy suited to each demand pattern. How far the price rise of business hotels — which carry a large weekend premium — has progressed nationwide is explored region by region in our National Business Hotel ADR Analysis.
Source: MetroEngines Research, prepared by the HotelBank Editorial Team
Price dispersion by lead time — what the booking curve suggests
Another axis of dispersion is lead time (the number of days until check-in, LT). In a market where RM has taken hold, prices are finely adjusted as bookings progress while watching remaining rooms and demand, so the price movement along LT (the booking curve) takes on a shape unique to each hotel type. The table below shows, for Tokyo’s Obon peak date (August 15, 2026), the average public price and the change in remaining rooms over the LT90→LT60 window by hotel type.
| Hotel type | Properties tracked | LT90 avg. price | LT60 avg. price | Inventory sold (LT90→60) |
|---|---|---|---|---|
| Business hotel | 822 | ¥24,500 | ¥24,200 | Rooms −15.6% |
| City hotel | 96 | ¥39,700 | ¥41,700 | Rooms −10.3% |
| Luxury (ADR ¥100k+) | 38 | ¥124,400 | ¥116,000 | Rooms −9.0% |
Scope: Tokyo, check-in August 15, 2026, LT90–LT60 window / Inventory sold = rate of decrease in remaining rooms / Source: MetroEngines Research, prepared by the HotelBank Editorial Team
City hotels raise prices into LT60, while business hotels stay almost flat and luxury properties show a slight downward adjustment from an early high. Even toward the same peak date, the shape of the price curve thus differs by hotel type. As RM tools spread, these lead-time price adjustments grow more granular: properties can automatically present aggressive prices early on strong-demand dates and tight-inventory situations, and offer nimble value-pricing in weaker-demand situations. How LT-by-LT prices move toward a long-weekend peak is also tracked concretely in our Silver Week 2026 booking-curve analysis.
What matters here is that price dispersion can move in both directions — widening and converging. In the early stage of RM adoption, dispersion across properties actually widens because price-movers and non-movers coexist. Eventually, as many properties optimize prices in line with demand signals, prices for the same area and same demand date converge toward a theoretical optimum, and disorderly variability declines. The currently high dispersion in the ryokan and resort tiers can be interpreted as the picture of a market in the very midst of this transition.
Source: MetroEngines Research, prepared by the HotelBank Editorial Team
Comparison with Osaka — a different city, a different dispersion structure
The structure of price dispersion also differs by area. Aggregating hotel-type coefficients of variation for Osaka on the same Obon peak date (August 15, 2026) reveals a pattern different from Tokyo. Osaka’s business hotels sit at CV 48.4%, close to Tokyo’s (50.7%), while small-scale, highly diverse segments such as guesthouses (CV 102.4%) and adults-only properties (106.8%) show conspicuously large dispersion.
| Hotel type (Osaka) | Properties | Avg. ADR | Coefficient of variation (CV) |
|---|---|---|---|
| Deluxe hotel | 24 | ¥73,900 | 59.0% |
| Ryokan | 42 | ¥45,400 | 83.0% |
| City hotel | 95 | ¥37,600 | 59.9% |
| Adults-only | 62 | ¥24,800 | 106.8% |
| Business hotel | 499 | ¥23,900 | 48.4% |
Scope: Osaka, check-in August 15, 2026, N=903 properties (only hotel types with 10+ properties shown) / Source: MetroEngines Research, prepared by the HotelBank Editorial Team
Common to both cities is the tendency that the larger and more standardized the segment’s operation, the smaller its dispersion, while smaller and more diverse segments show greater dispersion. It is precisely these high-dispersion segments, dominated by small and mid-sized properties, that hold the greatest headroom to sharpen pricing precision and expand revenue opportunities through RM tool adoption. Hidden within this intra-segment gap — easily missed when looking only at the market-average ADR — lies the room for growth that dynamic-pricing adoption can unlock.
“Transaction-based” price behavior seen in REIT results
OTA public prices are the average of selling prices and differ from actual transacted prices. For reference, the monthly, transaction-based operating results disclosed by listed REITs offer a glimpse of differing maturity in price operation. Invincible Investment Corporation (8963) reported April 2026 results of OCC 85.8%, ADR ¥14,666, and RevPAR ¥12,579 across 101 domestic hotels (vs the same month a year earlier: OCC +0.8pt, ADR −2.5%). In the same month, Japan Hotel REIT Investment Corporation (8985) grew ADR +4.6% YoY and RevPAR +4.1%.
In large-property portfolios where RM operation has matured, an approach is firmly established whereby occupancy is kept high while ADR is fine-tuned to demand — building up RevPAR without sacrificing OCC. If small and mid-sized properties, through tool adoption, can approach this balance between occupancy and rate, they can curb missed pricing during peak periods and nimbly move otherwise-unfilled off-season inventory, lifting revenue across the full year. This is not a denial of the present situation, but a proposal that properties which already command strong demand can gain further revenue-expansion opportunities by refining their price operation. For the structural debate over whether occupancy or rate is driving the 2026 ADR rise, our piece on reading pricing-structure change via OCC × ADR divergence explores the background.
Note that large properties held by listed REITs include facilities held by seven entities: Ichigo Hotel REIT Investment Corporation (3463), Invincible Investment Corporation (8963), Japan Hotel & Residential Investment Corporation (3472), Japan Hotel REIT Investment Corporation (8985), Hoshino Resorts REIT, Inc. (3287), Mori Trust REIT, Inc. (8961), and Kasumigaseki Hotel REIT (401A). Their operating results serve as one benchmark for the price operation that small and mid-sized properties can aim for after adopting RM.
Conclusion — price dispersion is a mirror of RM adoption
This article quantified price dispersion by area × hotel type for Tokyo and Osaka from three angles: variability across properties, day-of-week gaps, and lead time. What emerged is, first, that segments with many small and mid-sized properties — such as ryokan and resorts — show large price dispersion across properties and therefore great headroom for price optimization; second, that the weekend premium is large for ryokan and business hotels, where demand-linked pricing is functioning; and third, that the price curve along lead time takes a shape unique to each hotel type, with RM adoption making those adjustments more granular.
As RM adoption advances, dispersion temporarily widens during the transition as price-movers and non-movers coexist; eventually, as many properties optimize prices in line with demand signals, prices for the same demand date converge toward a more rational point. The high price dispersion observed today shows that the market is right in the middle of this transition. By looking not only at the market-average ADR but also at intra-segment variability, the location of the revenue opportunities that dynamic-pricing adoption can unlock comes into sharper focus.
⚠ Note on ADR for future dates: The ADR and booking curves for the Obon peak date (August 2026) and similar in this article are snapshots of selling prices and remaining rooms published on OTAs at the time of the survey, and will fluctuate as new plans are added and prices adjusted closer to the check-in date. Please treat the current figures as in-progress, observed trends.
Related Reading
- Silver Week 2026: First in 11 Years — ADR & Booking Curve Analysis
- Onsen Ryokan Acquisition Ceilings: ¥17.6M–24.4M/Room via ADR×OCC×12%
- Private Open-Air Bath Rooms: ADR Premium Before Summer 2026 Peak — 120 Top-Rated Inns
- Kanto Coast ADR 2026: Chiba, Kanagawa & Izu Summer Beach Hotel Pricing
- Business Hotel Price Surge: National ADR Analysis & 10 Cost-Effective Prefectures
- Hokkaido Defies Tsuyu: 6-City June ADR Comparison 2026 (+11.9% YoY)
References & Sources
■ Market data
- MetroEngines Research — OTA public-price data (Tokyo & Osaka, check-in August 15, 2026, ADR & coefficient of variation by hotel type), monthly ADR trends (January 2024–May 2026), booking curves (Tokyo, LT90–60 by hotel type)
■ REIT monthly operating results
- Invincible Investment Corporation “Monthly Operating Status, April 2026” (101 domestic hotels)
- Japan Hotel REIT Investment Corporation “Monthly Operating Results, April 2026”
■ Industry reports & commentary
- Relo Hotel Solutions Inc. “What Is Dynamic Pricing? Mechanisms, Success & Failure Cases for Hotel Adoption [2026 Edition]”
- Dynamic Plus “D+” “What Is Dynamic Pricing? A Thorough Guide to Mechanisms, Cases, and Adoption Methods”
- Dynatech “What Are the Benefits of Adopting Dynamic Pricing for Hotels?”