

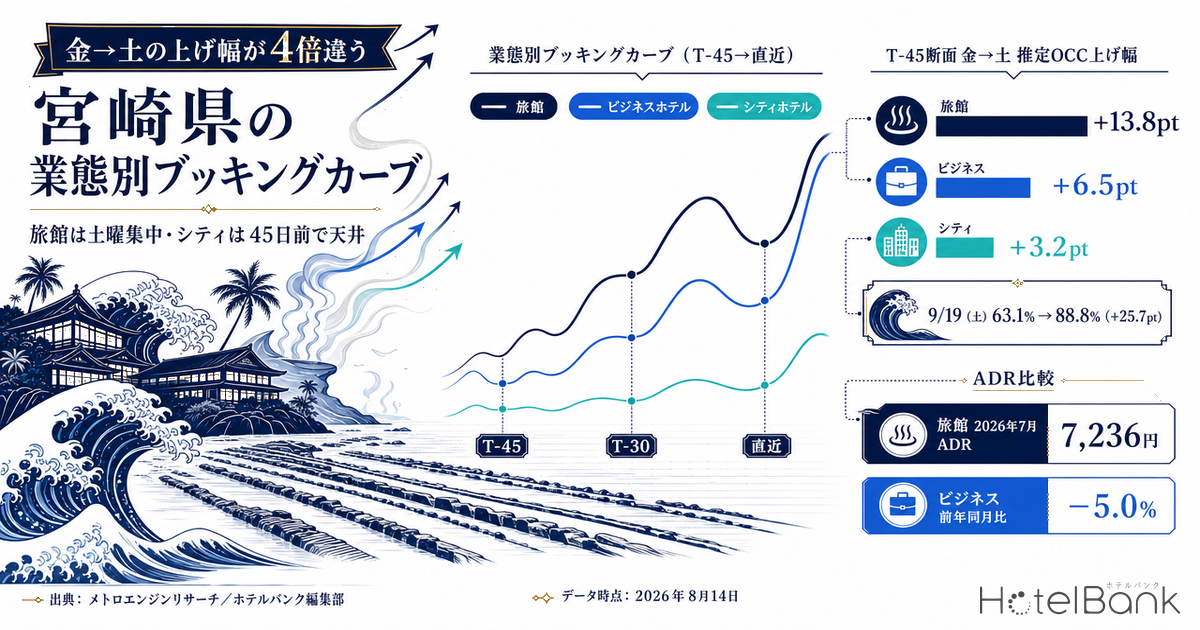
Even within a single prefecture — Miyazaki — the shape of demand looks completely different once you split the market by property type. Take a single fixed lead-time cross-section, 45 days before the stay date, and compare adjacent Fridays and Saturdays: the lift in estimated OCC (based on OTA-listed inventory) came to +13.8pt on average for ryokan, +6.5pt for business hotels, and +3.2pt for city hotels — a spread of more than four times across the three types. And that ordering never once flipped across all five Friday–Saturday pairs examined. City hotels are already pinned in the 85–95% range at 45 days out, so there is structurally little room left for the day of week to move anything. Ryokan, by contrast, sit in the 50s to low 60s on the Friday at T-45, and it is the Saturday alone that stacks up sharply. This article lines up booking curves for Miyazaki’s business hotels, city hotels, and ryokan at three fixed checkpoints — 45 days out, 30 days out, and the latest observation — and sets out a yardstick for when, and on which day of the week, each type should be moving price and inventory.
Scope: Miyazaki Prefecture business hotels (N=75–78 properties), city hotels (N=18 properties), and ryokan (N=36–39 properties). Price figures in this article are estimated settled ADR (the transacted price level inferred from OTA and other sales data, tax-exclusive equivalent); occupancy is an estimate based on OTA-listed inventory. Full definitions appear at the end of the article. Data as of August 14, 2026.
- — At the 45-days-out cross-section, the Friday-to-Saturday lift in estimated OCC was +13.8pt for ryokan, +6.5pt for business hotels, and +3.2pt for city hotels. The ordering held in all five Friday–Saturday pairs examined.
- — City hotels are already pinned at 85.7–94.5% by 45 days out, leaving structurally little room to move things by day of week. For them, T-45 is a cross-section where the outcome is largely already decided.
- — Business hotels built from 68.8% at T-45 to 82.0% at T-16 for Saturday, August 29 — +13.2pt — with the slope steepening from around T-26. Room to act remains in the final three weeks.
- — Settled results for June–July 2026 (by day of week) show the same ordering in the Saturday-minus-Friday gap: +7.0pt for ryokan, +5.6pt for business hotels, +2.7pt for city hotels. Business hotels run 14.0pt below weekday level on Sundays — the largest single pocket of slack in the week.
The Friday-to-Saturday Lift at 45 Days Out — Ryokan +13.8pt, City +3.2pt
We start by isolating a single lead-time cross-section — 45 days before the stay date (T-45) — and comparing estimated OCC for adjacent Fridays and Saturdays. Using two neighboring days within the same week minimizes the influence of seasonality and broad market trend, so what remains is a clean read on how much the day of week itself is worth. The scope is five Friday–Saturday pairs running from August 21 through September 26, 2026. Thin cross-sections where observed properties fell below 70% of the total property count were excluded, because population volatility there manufactures false peaks and troughs (that criterion is why the September 5, 2026 cross-section is not used in this article).
Source: MetroEngines Research; compiled by the HotelBank Editorial Team
All five pairs preserved the order ryokan > business > city. Against ryokan’s +13.8pt average, business hotels came in at +6.5pt and city hotels at +3.2pt. Ryokan jumped particularly hard from Friday, September 18 to Saturday, September 19 — from 63.1% to 88.8%, a lift of +25.7pt. That September 19 is the gateway into a five-day holiday run: Respect for the Aged Day falls on Monday, September 21 and the Autumnal Equinox on Wednesday, September 23, with a bridging national holiday on Tuesday, September 22 in between. The pattern reads as ryokan demand concentrating on the first day of that run as early as 45 days out. Business hotels managed only +9.9pt into the same holiday entry, and city hotels +6.8pt. How that five-day run unwinds over its back half is examined nationally in Silver Week 2026 Back Half at T-47.
| Stay-date pair | Ryokan | Business hotels | City hotels |
|---|---|---|---|
| Aug 21 (Fri) → Aug 22 (Sat) | 68.4% → 75.9% +7.5pt 32/38 → 32/37 properties observed |
70.8% → 74.7% +3.9pt 72/78 → 72/78 properties observed |
94.5% → 95.6% +1.1pt 14/18 → 14/18 properties observed |
| Aug 28 (Fri) → Aug 29 (Sat) | 58.4% → 66.9% +8.5pt 33/39 → 34/37 properties observed |
62.2% → 68.8% +6.6pt 74/78 → 73/78 properties observed |
88.3% → 92.0% +3.7pt 15/18 → 16/18 properties observed |
| Sep 11 (Fri) → Sep 12 (Sat) | 64.1% → 81.0% +16.9pt 36/38 → 35/38 properties observed |
77.9% → 84.6% +6.7pt 77/77 → 75/77 properties observed |
90.9% → 91.3% +0.4pt 18/18 → 18/18 properties observed |
| Sep 18 (Fri) → Sep 19 (Sat) *Entry into the five-day holiday run |
63.1% → 88.8% +25.7pt 33/38 → 33/37 properties observed |
63.3% → 73.2% +9.9pt 76/77 → 76/77 properties observed |
85.7% → 92.5% +6.8pt 18/18 → 18/18 properties observed |
| Sep 25 (Fri) → Sep 26 (Sat) | 59.7% → 70.3% +10.6pt 35/38 → 36/38 properties observed |
61.2% → 66.5% +5.3pt 77/77 → 75/77 properties observed |
86.5% → 90.4% +3.9pt 18/18 → 18/18 properties observed |
| Average lift across the five pairs | +13.8pt | +6.5pt | +3.2pt |
Source: MetroEngines Research; compiled by the HotelBank Editorial Team
One caveat is worth stressing here: city hotels’ modest +3.2pt does not mean they are failing to sell the weekend. City hotels are already at 85.7–94.5% on the Friday at 45 days out. Because the remaining inventory that forms the denominator is small, the room for day of week to move anything is structurally capped. In other words, T-45 for a city hotel is a cross-section where the outcome is already all but settled, while T-45 for a ryokan is the starting point from which Saturday alone will now stack up — two completely different meanings for the same date.
Three Checkpoints — T-45, T-30, Latest: Which Types Build and Which Stand Still
Next we line up three checkpoints for the same stay dates — 45 days out (T-45), 30 days out (T-30), and the latest observation — to see how each type accumulates along the lead time. The booking curves here are based on observations from 45 days before the stay date through the present; anything earlier than that is outside the scope of this article. For an example of the same three-checkpoint frame applied in a neighboring prefecture, see Kagoshima Summer Booking Curves: 23.2pt Gap by Type at 45 Days Out.
| Stay date | Type | T-45 | T-30 | Latest observation | T-45 → latest |
|---|---|---|---|---|---|
| Aug 28 (Fri) | Ryokan | 58.4% (33/39) | 63.5% (35/39) | 67.3% (37/39) T-15 | +8.9pt |
| Business | 62.2% (74/78) | 66.6% (75/78) | 74.0% (77/78) T-15 | +11.8pt | |
| City | 88.3% (15/18) | 88.7% (18/18) | 90.8% (18/18) T-15 | +2.5pt | |
| Aug 29 (Sat) | Ryokan | 66.9% (34/37) | 68.7% (29/37) | 73.2% (35/37) T-16 | +6.3pt |
| Business | 68.8% (73/78) | 76.4% (76/78) | 82.0% (77/78) T-16 | +13.2pt | |
| City | 92.0% (16/18) | 91.9% (18/18) | 92.6% (18/18) T-16 | +0.6pt | |
| Sep 11 (Fri) | Ryokan | 64.1% (36/38) | 66.1% (36/38) | 66.1% (36/38) T-29 | +2.0pt |
| Business | 77.9% (77/77) | 81.9% (75/77) | 81.6% (77/77) T-29 | +3.7pt | |
| City | 90.9% (18/18) | 93.0% (18/18) | 93.2% (18/18) T-29 | +2.3pt | |
| Sep 12 (Sat) | Ryokan | 81.0% (35/38) | 83.4% (36/38) | 83.4% (36/38) T-30 | +2.4pt |
| Business | 84.6% (75/77) | 87.3% (77/77) | 87.3% (77/77) T-30 | +2.7pt | |
| City | 91.3% (18/18) | 95.5% (18/18) | 95.5% (18/18) T-30 | +4.2pt |
Source: MetroEngines Research; compiled by the HotelBank Editorial Team. For September 11 and 12, the latest observation as of the data date falls at T-29 and T-30 respectively.
Taking Saturday, August 29 as an example and overlaying the continuous booking curves from T-45 through T-16 makes the difference in “shape” between the types far clearer.
Source: MetroEngines Research; compiled by the HotelBank Editorial Team (observed properties: ryokan 28–36 of 37, business 73–77 of 78, city 16–18 of 18)
The city hotel line runs almost flat from 92.0% at 45 days out to 92.6% at the latest observation. Its total swing is about 1pt (91.5–92.6%), and there are even stretches where it dips slightly. Business hotels, by contrast, build from 68.8% to 82.0% (+13.2pt) and ryokan from 66.9% to 73.2% (+6.3pt). The business hotel curve steepens noticeably from around T-26, with a thick late rush in the final two to three weeks. Ryokan step up once around T-29 and then land essentially flat from T-18 onward.
The practical implication is clear. City hotels are playing a game that has to be won on rate by 45 days out; business hotels are playing a game of picking up volume in the final three weeks; ryokan are playing a game where demand concentrates on a single day — Saturday. For the very same stay date in the very same prefecture, the moment to pull the lever differs by more than 20 days depending on the property type.
The Same Ordering Holds in Settled Results — Day of Week, June–July 2026
Everything so far has concerned pace toward future stay dates. To check whether the same structure shows up in settled results for months already past, we examine daily data for June and July 2026. The holiday run containing a public holiday (July 18–20) is excluded because the character of the days of week changes there, as are any days where observed properties fell below 70% of the total property count.
| Type | Weekdays (Mon–Thu) | Fri | Sat | Sun | Sat − Fri |
|---|---|---|---|---|---|
| Ryokan N=28–38 properties | 77.5% (34 days) | 77.9% (8 days) | 85.0% (5 days) | 75.8% (7 days) | +7.0pt |
| Business hotels N=75–81 properties | 82.7% (35 days) | 82.1% (9 days) | 87.7% (6 days) | 68.7% (7 days) | +5.6pt |
| City hotels N=16–18 properties | 90.9% (35 days) | 91.1% (9 days) | 93.8% (6 days) | 84.9% (7 days) | +2.7pt |
Source: MetroEngines Research; compiled by the HotelBank Editorial Team
In settled results too, the Saturday-versus-Friday gap came out as ryokan +7.0pt > business +5.6pt > city +2.7pt — exactly the ordering seen at the 45-days-out cross-section. When the same ranking appears in both forward pace and settled results, it reads not as an accident of observation timing but as the demand structure of Miyazaki itself.
The size of the Sunday drop-off is equally worth noting. Business hotels fall from 82.7% on weekdays to 68.7% on Sundays, a 14.0pt decline, whereas ryokan slip only 1.7pt (77.5% → 75.8%) and city hotels 6.0pt (90.9% → 84.9%). Because business hotels lean heavily on weekday corporate travel demand, the trough of their week lands squarely on Sunday. Ryokan show the opposite: a small gap between the Saturday peak and the Sunday trough, suggesting they may be selling the weekend as a single Saturday-plus-Sunday block. For Miyazaki’s business hotels, how to fill that −14.0pt Sunday is arguably a bigger pocket of opportunity than chasing Saturday rate.
Where Estimated Settled ADR Sits — Ryokan and City Rising, Business Flat
Different occupancy shapes come with different price levels and seasonal profiles. Looking at Miyazaki’s estimated settled ADR by property type, the year-on-year comparison between settled months (July 2026 vs July 2025) shows ryokan and city hotels posting near-double-digit growth, while business hotels came in below the prior year.
| Type | July 2025 settled |
July 2026 settled |
Year on year | September 2026 current estimate |
|---|---|---|---|---|
| Ryokan | ¥6,462 N=44 properties | ¥7,236 N=45 properties | +12.0% | ¥9,582 N=42 properties |
| City hotels | ¥6,689 N=19 properties | ¥7,306 N=20 properties | +9.2% | ¥11,461 N=19 properties |
| Business hotels | ¥6,357 N=87 properties | ¥6,038 N=86 properties | −5.0% | ¥9,316 N=83 properties |
Source: MetroEngines Research; compiled by the HotelBank Editorial Team. The September 2026 figure is an estimate based on the current state of sales; because it rests on a different calculation basis from settled figures, no direct comparison with settled values is drawn (we wait for month-end settlement).
In July 2025 the three types were bunched almost level at ¥6,357–6,689 in estimated settled ADR. By July 2026, ryokan stood at ¥7,236 and city hotels at ¥7,306 against business hotels at ¥6,038 — a step of roughly ¥1,200 opening up between the ryokan-and-city group and business hotels. Over the course of a year, the difference in occupancy shape has surfaced as a separation in price bands. Business hotels are down 5.0% year on year (N=86 properties) even though occupancy is by no means weak, at 82.7% on weekdays in the settled June–July results. That combination — occupancy holding high while price sits below the prior year — suggests headroom for rate may still be on the table.
Source: MetroEngines Research; compiled by the HotelBank Editorial Team (August onward is an estimate based on the current state of sales, shown as a dotted line)
Overlaying the years, ryokan show peaks around the New Year period and February with a trough in early summer. Business hotels have a one-off February peak but have otherwise tracked flat in a band around ¥6,000 through the year. Ryokan opened 2026 above the prior year in the first half (January ¥8,978, February ¥9,327 against ¥7,330 and ¥8,579), dipped marginally below the prior year only in March (¥7,221 versus ¥7,420), and have run consistently above the prior year from April onward. Business hotels cleared the prior year in January and February, but have since strung together months slightly below it from March.
For Revenue Managers Running Business, City, and Ryokan Properties in Miyazaki — Implications and an Action Plan
(a) Insights from an operating standpoint
1. The baseline for “what percentage at 45 days out is normal” is completely different by property type. The market’s T-45 cross-section ran 85.7–94.5% on Fridays and 90.4–95.6% on Saturdays for city hotels, 61.2–77.9% and 66.5–84.6% for business hotels, and 58.4–68.4% and 66.9–88.8% for ryokan. Reading your own pace for the same stay date against where it sits in those ranges lets you separate “we are behind” from “this is simply the shape of this property type.” A ryokan sitting in the 60s at 45 days out is a normal shape, and panicking into a rate cut there risks throwing away the Saturday build that is still to come.
2. Where the rate-revision calendar should sit shifts by more than 20 days across types. On the Saturday, August 29 curve, city hotels were essentially flat from T-45 to T-16 with a swing of about 1pt, while business hotels built +13.2pt with the slope steepening from around T-26. For city hotels, settings made before the 45-day mark tend to become the result; for business hotels, room to act remains in the final three weeks. Ryokan see only Saturday spike (+13.8pt on average across the five pairs), so treating Friday and Saturday under a single rate design leaves substantial Saturday revenue on the table. The distribution of how much rate separation is actually being applied between Friday and Saturday is examined at property level in Weekend Premium 2026: Tokyo Business 24% vs Hakone Ryokan 10%.
3. The biggest pocket of slack for business hotels is not Saturday rate but Sunday occupancy. In the settled June–July 2026 results, business hotels ran 68.7% on Sundays against 82.7% on weekdays — 14.0pt lower. The ryokan Sunday drop-off is just 1.7pt. Converting Saturday demand into an extra Sunday night may be a larger theme than chasing the +5.6pt on Saturday.
4. One property type is running high occupancy while its rate sits below the prior year. Business hotels posted estimated settled ADR of ¥6,038 in July 2026 (N=86 properties), down 5.0% year on year. Weekday occupancy over the same period was 82.7% — not low. That combination points to headroom on the pricing side rather than weakness in demand. Ryokan (+12.0%) and city hotels (+9.2%), meanwhile, have grown rate, so pricing strategy is diverging even within a single prefecture.
| Horizon | Action | Decision trigger | Objective |
|---|---|---|---|
| Today to this week (inventory around T-15) |
Re-examine remaining Saturday inventory in late August against the benchmark for your property type | If, as a business hotel, your pace for Aug 29 (Sat) sits well below the market’s T-16 level of 82.0% | Capture the late rush of the final three weeks. Avoid holding back too much inventory in the stretch where the curve steepens |
| Check the extension and multi-night path into Sunday | If your Sunday occupancy persistently runs more than 10pt below your weekday level (the market gap for business hotels is 14.0pt) | Fill the trough of the week. Check the design room for connecting Saturday guests into the following night | |
| Within two weeks (mid-September stay dates) |
Revisit rate design for the Sep 19–23 holiday range by property type | If, as a ryokan, your pace for Sep 19 (Sat) has not reached the market’s T-45 level of 88.8% | Align the price band with a pattern where demand concentrates on the first day of the run (+25.7pt Fri to Sat) |
| Check whether Friday and Saturday rates are managed separately | If, as a ryokan, you are selling Friday and Saturday at the same rate (the market’s Fri-to-Sat gap averages +13.8pt across five pairs) | Secure a rate differential proportionate to Saturday’s demand density | |
| Toward next month (preparing October onward) |
For city hotels, move the main battleground back to settings made before 45 days out | If your curve has already reached around the market level of 90% at T-45 (T-45 to latest for Aug 29 was +0.6pt) | On the premise that late-stage upside is small, shift toward a design that builds rate at the early stage |
| Benchmark business hotel price bands against the market level | If your settings remain below the market’s estimated settled ADR of ¥6,038 for July 2026 while occupancy tracks around 82.7% on weekdays | Consider the room to recover the 5.0% year-on-year rate decline through next season’s settings |
Source: MetroEngines Research; compiled by the HotelBank Editorial Team
Summary — Three Yardsticks You Can Use in Miyazaki
Yardstick 1: the level at 45 days out means something different for each property type. A city hotel’s 85–95% means “all but decided”; a ryokan’s 58–68% means “the starting point from which Saturday now builds.” Do not read the same number against the same standard.
Yardstick 2: the Friday-to-Saturday lift is +13.8pt for ryokan, +6.5pt for business hotels, and +3.2pt for city hotels. That ordering held across all five Friday–Saturday pairs, and it reappeared in the settled June–July 2026 results (ryokan +7.0pt, business +5.6pt, city +2.7pt). The scale of your weekend premium design can be anchored to those ratios.
Yardstick 3: the point at which to pull the lever shifts by more than 20 days across types. City hotels before T-45; business hotels in the final three weeks from T-26 onward; ryokan at the level of the individual day of week. Confirm which stretch of your own curve is where the slope lifts, then reposition the center of gravity of your rate-revision calendar accordingly.
Miyazaki’s city hotel population is small, at N=18 properties, which structurally leaves the prefecture-wide figure vulnerable to being pulled by the movement of a handful of properties. Business hotels (N=75–78) and ryokan (N=36–39), on the other hand, carry enough depth to be read including the dispersion within each type. What this three-way comparison ultimately shows is a very simple fact: a single metric such as “prefecture-average occupancy” cannot tell you where your own property stands.
About the Data
- Definition of estimated OCC: occupancy based on OTA-listed inventory = 100 − 100 × rooms still listed on OTAs ÷ total rooms. It is an estimate based on how inventory offered for sale on OTAs is being consumed, and its definition differs from actual room occupancy (it reads higher). This article labels it “estimated OCC (based on OTA-listed inventory).”
- Booking curve: based on observations from 45 days before the stay date through the present. Scope is stay dates from August 19 to September 26, 2026, with the observation window running to the data date. The cumulative progression is what we call the booking curve.
- Definition of estimated settled ADR: the transacted price level (tax-exclusive equivalent) inferred from OTA and other sales data (lowest-plan level × property-type coefficient, ensembled across multiple channels). Past months are settled figures; the current and future months are estimates based on the current state of sales. Median error against published operating results is 6.6%.
- Breakdown of N: booking curves and estimated OCC cover Miyazaki Prefecture business hotels (75–81 total properties, varying by observation date), city hotels (16–18), and ryokan (28–39). For estimated settled ADR, business hotels are N=83–87, city hotels N=19–20, and ryokan N=42–47. Observed property counts at each checkpoint are stated in the tables in the body text. Thin cross-sections where observed properties fell below 70% of the total property count are not used in the conclusions (the September 5, 2026 cross-section is excluded on this criterion).
- Treatment of public holidays: September 21 (Respect for the Aged Day), September 22 (holiday), and September 23 (Autumnal Equinox Day), 2026, and July 20, 2026 (Marine Day) follow the published data in the Cabinet Office’s “National Holidays.” The July 18–20 holiday run is excluded from the day-of-week aggregation.
- Data date: August 14, 2026. Because sales conditions and inventory change daily, the figures in this article are a snapshot as of the time of retrieval.
References and Sources
- Cabinet Office, “National Holidays” (public holiday list, CSV) https://www8.cao.go.jp/chosei/shukujitsu/syukujitsu.csv
■ Data Sources
Daily observation of publicly listed OTA inventory and published prices within Miyazaki Prefecture (aggregated by MetroEngines Research). Booking curves use observations by lead time for each stay date; day-of-week results use daily settled data for June–July 2026; prices use the monthly estimated settled ADR series by property type. Public holiday classification follows the published data in the Cabinet Office’s “National Holidays.” Data date: August 14, 2026.
■ Calculation Assumptions
Estimated OCC (based on OTA-listed inventory) = 100 − 100 × rooms still listed on OTAs ÷ total rooms. The Friday-to-Saturday lift is taken as the difference between adjacent Friday and Saturday within the same week at the same lead-time cross-section (T-45), on the assumption that this offsets seasonality and market trend. The three checkpoints are aligned at T-45, T-30, and the latest observation, and the lead time of the latest observation is stated in the body tables for each stay date. The day-of-week aggregation excludes the holiday run containing a public holiday (July 18–20, 2026). Estimated settled ADR is a tax-exclusive equivalent; past months are settled figures while the current and future months are estimates based on the current state of sales, and no direct comparison between the two is drawn.
■ Limitations and Caveats
Estimated OCC is an estimate based on how inventory offered for sale on OTAs is being consumed, and its definition differs from actual room occupancy (it reads higher). Because observed property counts fluctuate by date, thin cross-sections falling below 70% of the total property count are not used in the conclusions (the September 5, 2026 cross-section is excluded on this criterion). Miyazaki’s city hotels form a small population at N=16–18 properties, leaving the prefecture-wide figure liable to be pulled by the movement of a few properties. Median error for estimated settled ADR against published operating results is 6.6%. Because sales conditions and inventory change daily, the figures in this article are a snapshot as of the time of retrieval.
Related Reading
- Kagoshima Summer Booking Curves: 23.2pt Gap by Type at 45 Days Out
- Hiroshima Booking Curves: 26.2pt Gap at T-45, Ryokan +10.9pt Late
- Okayama Booking Curves: 3 Checkpoints, Aug 8 Late-Surges +11.8pt
- Weekend Premium 2026: Tokyo Business 24% vs Hakone Ryokan 10%, N=659
- Silver Week 2026 Back Half at T-47: Sep 23 Matches a Normal Wednesday
- Hokkaido ADR H1 2026: City −5.7%, Business +4.1%, April the Turn